|
This is the third post in the series Historians Confront the Climate Emergency, hosted by ActiveHistory.ca, NiCHE (Network in Canadian History & Environment), Historical Climatology, and Climate History Network. Dr. Daniel Macfarlane, Western Michigan University  We’re in a climate emergency. This isn’t just rhetorical hyperbole, but a statement backed by more than 13,000 scientists. Even the venerable publication Scientific American agreed to adopt the term earlier this year. Canada is particularly culpable for this crisis because of its petro-state status and hyper-consumerism. My research deals with the transborder history and politics of Canada-U.S. water and energy issues, lately involving climate change. But it is in my teaching role that I spend the most time addressing the climate emergency since I’m in an environmental and sustainability studies department (which has a climate change minor). This includes an introductory course that features a major climate change component, as well as senior courses such as the seminar I’m teaching this fall that concentrates on my campus’s carbon emissions. True, I have the advantage of teaching in an environment-focused setting that looks as much at the present and the future as the past. But all historians, regardless of experience in environmental history or history of science, can bring the climate emergency into their classroom. What I would like to do in this post is to suggest some areas, based on my teaching experiences and reading of recent literature, where climate change could be injected into Canadian history survey courses. During the pandemic, I’ve read a wide range of new popular books about the climate crisis – from the technocratic solutions of Bill Gates to the Green New Deal advocacy of Kate Aronoff. Within those public-facing books, I noticed four key debates – or spectrums since they don’t have to be either-or questions – about tackling climate. These are illustrated below, with the ‘X’ marking where I land within each: 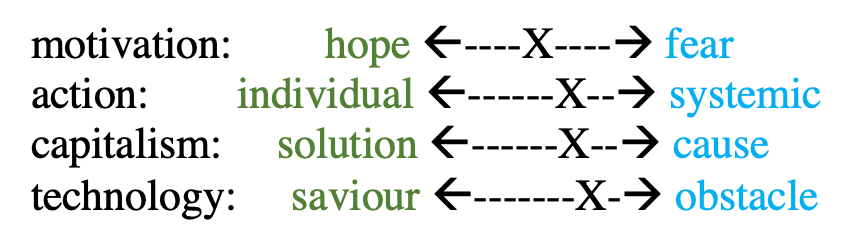 I could write a whole post about why I fall where I do. But that isn’t the point here. Instead, I’m going to offer strategies for infusing lectures, discussions, and assignments with aspects of those four debates. Probably the most obvious way to do that is enhance the emphasis on natural resources. Climate change, as well as our other big ecological problems, are tightly linked to how we use and consume resources. The most relevant type of resource when it comes to greenhouse gases is energy. Canadians have long been amongst the most profligate people in the history of the globe in terms of energy consumption (only some of which can be explained by Canada’s widely dispersed population and cold climate). Canada has also been a global production leader in several different energy forms, with hydroelectricity and oil likely the most well-known (though we could count uranium as well because of its role in nuclear power). To incorporate energy history, university instructors could go several routes, such as peppering it into lectures throughout the term, or create an entire section or module. It just so happens that the major energy eras and transitions line up pretty well with major periods of Canadian history extending deep back into the premodern period: animal/human muscle, wood, coal, hydro, fossil fuels, etc. Truthfully, energy could be the organizing principle for an entire survey course (and this book would make a great text). 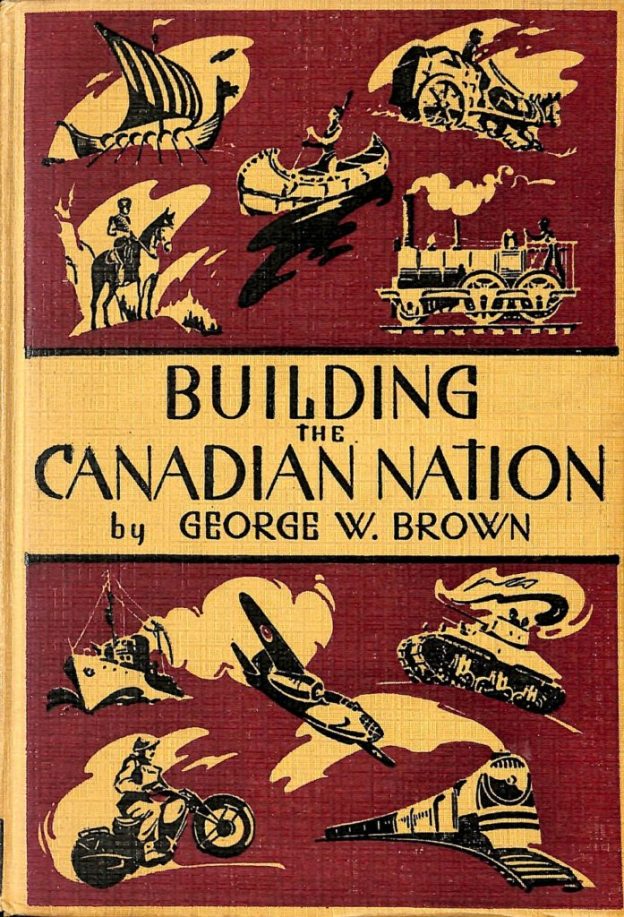 The textbook “Building the Canadian Nation” by George W. Brown The development of energy is intrinsically tied to common classroom themes in Canadian political history: federalism (disputes over provincial rights to harvest hydropower and fossil fuels); regional identity (Ontario Hydro, Hydro-Québec, and BC Hydro; the prairies and oil; coal on the east coast; etc.); Canada-U.S. relations (electricity, fossil fuel, and uranium exports). Many major topics that normally come up anyway, from the railways to free trade, are inherently about energy and environment, providing segues to wrestle with climate change and Canada’s contribution and response to it.
Hydroelectric dams, fossil fuels, and pipelines have long wreaked havoc on First Nations communities. The history of energy developments therefore also dovetails with Canada’s history of settler and extractive colonialism. And discussions about reconciliation can relate to contemporary calls for a just transition away from fossil fuels. Tying in with the systemic vs. individual debate, other aspects of the history of social movements and human rights in Canada could be an entrée for grappling with climate change. Sticking with the systemic angle, another existing theme in the Canadian curriculum where climate change could clearly piggyback is the role of the state. The history of capitalism is yet another prevalent theme that can be merged with exploring climate change. The tension between government regulation and intervention versus the free market is already apparent in Canadian history and lends itself to talking about capitalism as the solution or the cause. For those addressing the history of technology, Canada has been at the forefront of a number of technological changes dealing with the extraction and burning of energy, from the world’s biggest hydropower stations a century ago to the tar sands today. Technology is why we have cheap energy. Cheap energy is a sine qua non of “modern” Canadian lifestyles, the reason why consumer products are (relative to their true cost) inexpensive and available. And cheap energy is a major reason, maybe the main reason, we have climate change. The extraction and production of energy – e.g., coal miners and oil roughnecks – connects with important themes in labour and class history, while the ways energy is consumed – such as household work or petro-masculinity – can be combined with themes in social and gender history. And how has cheap energy and the attendant assumptions of abundance practically and conceptually shaped modern Canadian society and Canadian identity? Students are frequently interested in studying the differences between Canada and the United States. Canada’s social safety net and collectivism are often held up as distinctive from American individualism and privatization. But that may be the narcissism of small differences relative to the historic exploitation of natural resources, per capita levels of consumption, and greenhouse gas emissions; on those scores, to the rest of the globe the U.S. and Canada look pretty identical. When it comes time to teach about Canadian international history, for all the claims about Canada’s middle power or peacekeeper proclivities, it is in the realm of fossil fuels and climate change that Canada might actually be a superpower (but the bad kind). Another pedagogical approach is to look at past adaptations to a changing climate. That is, the climate has shifted in the past, and peoples living in the territory now called Canada had to figure out ways to cope. If you’re teaching the pre-Confederation survey, the Little Ice Age (roughly the 16th to the 18th centuries) caused changes to food acquisition and agriculture strategies, which in turn had social, political, and military knock-on effects. Resilience emerges as a theme to interlink cultural responses to climate change in the past and present. For those doing post-Confederation history, many of the climactic shifts we currently recognize were already occurring by the Second World War. The start of the Cold War is one of the candidates for dating the beginning of the Anthropocene, which could serve as an organizing topic or concept (this series will have more on the Anthropocene in future posts). What about some specific class exercises and assignments? Try integrating historical sources as indirect proxies for comparing climate from past to present. You might have heard of using ice cores, sediments, or tree rings to infer historic climatic conditions. But the types of records historians are likely more familiar with, such as paintings, diaries, ship or whaling log books, and fur trade fort journals, can also be revealing and double as a unique way to introduce undergrads to the use of primary sources. (A contributor to this series, Dagomar Degroot, has written extensively about the use of various textual records for climate history). Artistic representations can show glacial retreat or pollution levels, for example. Or, given the prominence of the fur trade in Canada’s history, using fort journals to compare past temperatures and change of seasons with the present could be an instructive way to expose students to both climate history and primary sources. There are places online where some of those types of information are already organized for easy integration into your curriculum. For the pre-Confederation period, check out Canada’s Year Without a Summer. The titular year in question is 1816; the Tambora volcano erupted the previous year in Indonesia, leading to subsequent cold weather in early eastern Canada. This website was created by Alan MacEachern and Michael O’Hagan with course instructors in mind: it offers more than 120 sources, as well as guidance for how teachers could incorporate these into class. For the post-Confederation period, try Environment Canada’s National Climate Data and Information Archive which has (digital) reams of historical climate data. A professor could create an exercise or assignment, for example, in which students pick a location – such as their hometown or their university – and compare past and present weather/climate conditions. This is not an exhaustive list of ideas, but some easy ways to get started. Given the reality and urgency of the climate crisis, and its relevance to the lives and concerns of students, it is something all introductory history courses need to address. Daniel Macfarlane is an Associate Professor in the Institute of the Environment and Sustainability at Western Michigan University, co-editor of The Otter-La loutre, and a member of the executive board of NiCHE, Network in Canadian History & Environment.
0 Comments
This is the second post in the series Historians Confront the Climate Emergency, hosted by ActiveHistory.ca, NiCHE (Network in Canadian History & Environment), Historical Climatology, and Climate History Network. Dr. Dagomar Degroot, Georgetown University  Global temperature anomalies over the last 2,019 years. Ed Hawkins using data from PAGES2k and HadCRUT4.6. Historians have always concerned themselves as much with the present as the past. Some do so explicitly, their work guided by a conscious desire to provide context for a matter of present concern. Others do so implicitly. They may study the past because it makes them curious, but that curiosity is inevitably shaped by their day-to-day lives. One way or another, history as a discipline is the outcome of the history historians must live through. Today no challenge seems more daunting than the climate crisis. Earth’s average temperature has warmed by over one degree Celsius since the nineteenth century, and it is likely – though not inevitable – that much more warming is on its way. Global temperature changes of this magnitude, with this speed, profoundly alter both the local likelihood and severity of extreme weather. Human-caused heating will reverberate through the Earth for millennia – by slowly melting ice sheets and raising sea levels, for example. Our lives and livelihoods will be – in many cases, are already – shaped by this crisis. No surprise, then, that ever more historians now think urgently and seriously about the implications of climate change for their scholarship. Forecasts of the warmer future are still dominated by economics and climate science, but few now deny that scholars of the past – including historians – can offer unique perspectives on how we entered this crisis, where it might be taking us, and how we can avoid its greatest dangers. As this series reveals, historians grapple with climate change in increasingly diverse ways, and here it is again useful to draw a distinction between implicit and explicit approaches. In a sense, just about every kind of history has relevance to the present crisis, because climate affects every aspect of the human experience. Climate change alters the environments that sustain and shape our lives, shifting the basic conditions that channel our actions and thoughts. The climate crisis is therefore as much about the transformation of the planet as it is about the reshaping of human relationships. Any history that deals with those relationships – all history, by definition – implicitly tells us something about climate change and its social consequences. If you are a historian, your work is about global warming. The editors of this series, however, asked me to describe how scholars of the past explicitly engage with the climate crisis. Arguably, the most influential and numerous publications have originated in both the history of science and the related fields of climate history and historical climatology. A quick and necessarily incomplete overview of just these two kinds of scholarship reveals the value and diversity of historical approaches to climate change. Historians of science initially concentrated on how global warming was discovered and understood by scientists with increasing certainty. While it is simplistic to conclude that scientists “knew” about global warming for many decades, or even over a century – as is often stated in popular media and occasionally in scholarship – historians of science nevertheless revealed the deep roots of today’s scientific understanding of global warming. Led by Naomi Oreskes, they also found that serious debate among climate scientists over the existence of human-caused global warming ended in the 1990s, or perhaps even earlier. Although a majority of the public doesn’t know it, just about every climate scientists understands that humans are today responsible for the rapid heating of the planet. Confirming the scientific consensus on global warming led some historians of science to argue that fossil fuel companies and far-right scientists cynically promoted climate denial in order to serve their regressive political or economic interests. This was – and remains – perhaps the most influential and politically potent argument proposed by historians about the climate crisis. Climate scientists, in this narrative, bravely announced their inconvenient truths but could not overcome the falsehoods propagated by their more media-savvy antagonists. Nevertheless, other historians soon pointed out that climate science has long involved more than the apolitical discovery and communication of truth. Historians of science revealed for example how models and simulations came to dominate climate science – rather than other ways of knowing – and argued that climate scientists themselves failed to choose communications strategies that could mobilize grassroots, local action. Historians have long traced the emergence of ideas about climate from antiquity through the present. Recently, historians of science have revealed that the climate ideas most view as characteristically modern in fact have deep roots. They have shown, for example, that legends of ancient climate changes caused by human sin or shortsightedness helped influence the development of early modern science, and – with new practices in forestry and agriculture – contributed to the emergence of what we might now call sustainability thinking. Climate historians and historical climatologists take an entirely different approach to the climate crisis. Historians active in historical climatology search for human records – usually documents – that either describe past weather or activities that must have been strongly influenced by weather. By finding enough of these records – by scouring what they call the “archives of society” – historical climatologists uncover how climate changed over decades or even centuries. Working with those who uncover evidence for past weather in the “archives of nature” – tree rings, ice cores, or lakebed sediments, for example – they can develop remarkably precise “reconstructions” that reveal the existence of substantial climatic fluctuations even before the onset of today’s extreme warming. The antecedents of this work date back to the nineteenth century, but it was really only in the 1970s that Christian Pfister and other pioneers proposed ranking qualitative accounts of weather on simple ordinal scales. These scales allowed for the closer integration of the archives of society with the archives of nature, especially in Europe, but historical climatologists studying different parts of the world continued to use distinct methods for quantifying historical evidence. Only now are they working towards developing a common approach. In any case, reconstructions permit histories of human responses to past climate changes. While these climate changes have been relatively modest in global scale – the Little Ice Age, the most studied period of preindustrial climate change, only cooled the Earth by several tenths of a degree Celsius between the fifteenth and eighteenth centuries – some were nevertheless sufficient to dramatically alter local environments. Archaeologists, economists, geneticists, geographers, linguists, literary scholars, and paleoscientists have all used distinct methods and sources to uncover how these alterations shaped the history of human populations. Yet few disciplines have contributed more to this scholarship – recently coined the “History of Climate and Society” – than history. Historians have in recent years increasingly avoided making simple connections between climate changes, harvest failures, and demographic disasters: a chain of events that scholars of past climate have long emphasized. New climate histories instead uncover wellsprings of both vulnerability and resilience within communities, and they increasingly consider the full range of possible relationships between climate change and human history across the entire world and into the twentieth century. Together, historians of science and climate historians have done much more than add a little climate to historians’ understanding of the past. Histories of climate science help uncover why governments and corporations have not responded quickly or adequately to the climate crisis. They also reveal how the crisis might be communicated more effectively, or how more diverse ways of knowing could be incorporated within climate science. They show us why we should nevertheless believe the forecasts of climate science – and how we can best act on that belief. Historical climatology helps reveal the baselines against which human emissions are changing Earth’s climate today, and helps uncover the likely response of local environments to global warming. Climate historians can suggest what strategies may succeed or fail when climates change, and add complexity to forecasts of the future that too often assume simple social responses to shifting environmental conditions. Many tell stories about the influence of climate on human affairs that capture public attention more vividly than frightening statistics ever could. Yet both climate history and historical climatology also demonstrate the fundamental discontinuity between climates present and past. The speed, magnitude, and cause of present-day warming simply has no parallel in the history of human civilization. History is a guide to climate action, but it also warns us that to a large extent we are in uncharted waters. 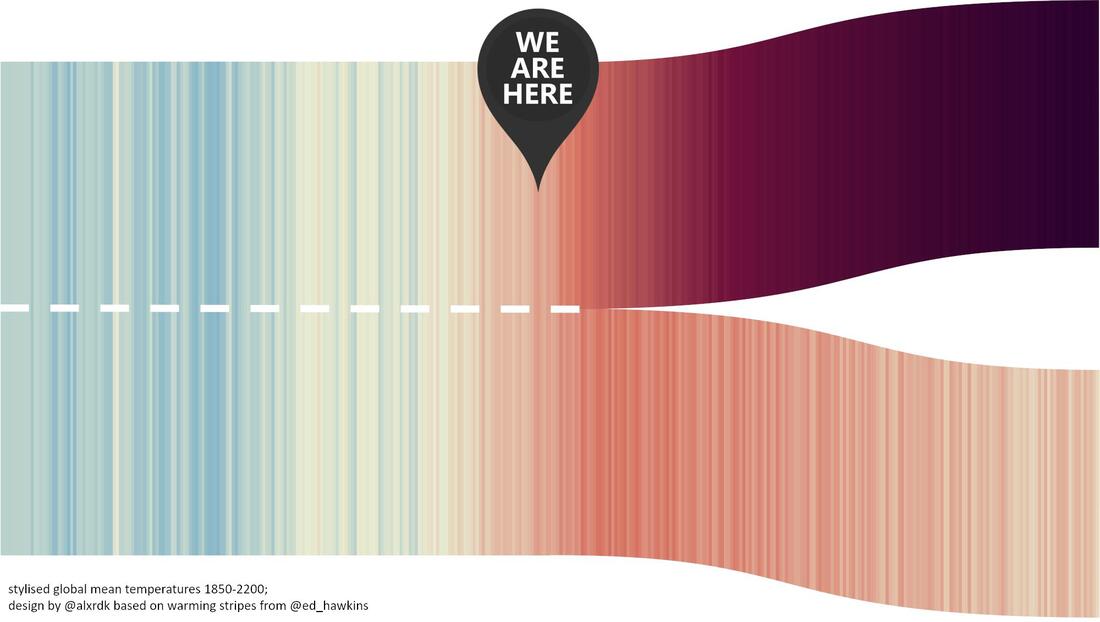 RCP 8.5 and RCP 2.6: two very different future emissions scenarios, and very different fates for humanity. Ten years ago, when I started this website, my message was something like: believe me, history helps us understand global warming! I could not have imagined that, in just ten years, climate change would be widely recognized as a serious subject for historical study – or that historians such as Ruth Morgan would earn a seat in a working group of the Intergovernmental Panel on Climate Change. In some ways, the sea change in the historical discipline has mirrored a broader transformation in social attitudes towards climate change: a transformation driven in part by the courage of young activists, but also by the growing severity of the climate crisis. Climate scholarship in history is now more numerous and more diverse – in its topics and authorship – than it ever has been, a shift that also echoes developments in climate activism.
I expect these trends to continue. When future historians write about our time, you can be sure that climate change will play a central role in the story. As we live through that history, our scholarship will be climate scholarship – whether we see it that way or not. This is the introductory post to the series, “Historians Confront the Climate Emergency,” hosted by ActiveHistory.ca, NiCHE (Network in Canadian History & Environment), Historical Climatology and Climate History Network. Dr. Edward Dunsworth and Dr. Daniel Macfarlane What a summer. In late June, a “heat dome” stalked the Pacific regions of Canada and the United States, pushing thermometers close to the 50-degree mark and causing the sudden death of 570 people in British Columbia alone. By July, hundreds of forest fires raged throughout the west coast and in the prairie regions of northern North America, their smoke billowing out across much of the rest of the continent. Parts of Turkey, Macedonia, Italy, Greece, and Tunisia were also devastated by forest fires (with Argentina hit during the southern hemisphere’s summer months earlier in the year). 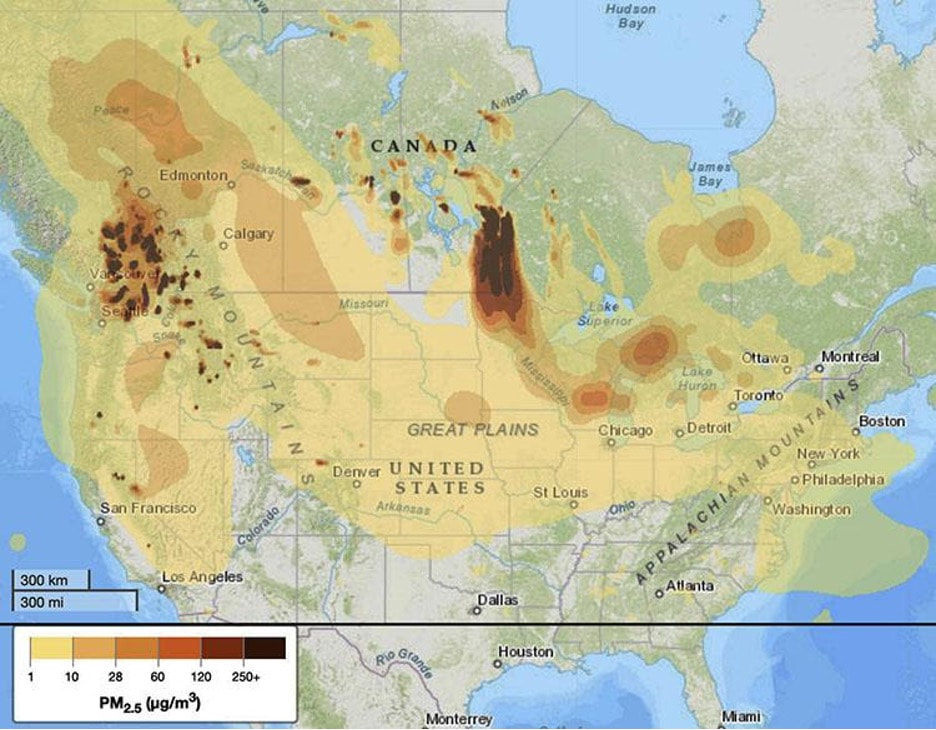 Smoke forecast for 11 p.m. EST, 31 July 2021. Firesmoke.ca via Wildfire Today. Deadly floods in China, Niger, Somalia, India, Germany, Brazil, and Guyana, killing hundreds and causing damage in the tens of billions of dollars. Drought in Iraq, Syria, Ethiopia, Iran, and Madagascar, driving millions towards food insecurity and starvation (400,000 people in Madagascar alone are at risk of starvation). Hurricanes, tropical storms, and cyclones battering the Caribbean and United States; Laos, the Philippines, and Indonesia; India and Bangladesh; Mozambique and Tanzania.[i] In case the burning mountains, sinking villages, swimming subway trains, and starving masses weren’t evidence enough, the Intergovernmental Panel on Climate Change (IPCC) released yet another alarming report stressing the imperative urgency of reducing greenhouse gas emissions. The 2015 Paris Agreement had laid out a goal of limiting global warming to well below 2, preferably to 1.5 degrees Celsius, compared to pre-industrial levels. But this newest IPCC report made it clear that those targets were by now almost unattainable, and devoted significant attention to the looming risk of “tipping points” – such as the melting of Arctic permafrost – that are likely to trigger cascading events and result in fundamental, and potentially irreversible, transformations to Earth systems. The media rolled out phrases like ‘code red’ or ‘emergency’ or ‘wake-up call’. “The alarm bells are deafening,” said the UN Secretary-General. And – oh yeah – a pandemic whose genesis was almost certainly linked to climate change continued to ravage the globe, claiming its four millionth victim and showing little signs of abating – certainly not among the vast majority of the planet’s people who have not yet had the privilege of vaccination. Meanwhile, amid this ever-growing list of ominous events, we – the authors of this post, but also many of you readers – carried out our work as historians: researching and writing books and articles, delivering conference papers, preparing syllabi, grading papers, processing evermore perplexing emails from university administrators, and all the rest of it. It all seemed a bit disjointed, a bit discordant, a bit surreal. Here was Ed, gazing up at a Montreal sky darkened by smoke from forest fires along the Manitoba-Ontario border, nearly 2,000 kilometres away, working away at revisions on a book about tobacco farm labour in 20th century Ontario. There was Dan, preparing a syllabus on carbon emissions and interviewing people about historical climate change impacts on Lake Ontario, taking a break to read the dire warnings of the IPCC about the very survival of our planet. We are in a climate emergency. But still the humdrum – and at times not so humdrum – beat of everyday life carries on. The dissonance of it all can prompt some big questions, even existential ones, for historians. What does it mean to be a historian on a planet on fire? What does it mean to study the human past when the human future is in dire peril? This series does not claim to answer these questions. Indeed, the answers to them will be worked out by all of us, in collective dialogue and debate, over the decades to come. Instead, we have more modest aims, but ones that we nonetheless hope will encourage scholars of the past – in whatever discipline they find themselves – to think in new ways about how the work of historians might speak to the totalizing crisis at whose precipice humanity now stands. For this ten-part series, we asked a wide-ranging and interdisciplinary roster of contributors to respond to the following animating questions: how should we historians and academics respond to the climate crisis? And how are we already doing so, in our research and our teaching? From its conception, a key aim of this series has been to bring scholars from fields other than environmental or climate history into the conversation about the climate emergency and how it relates to the work of historians. (Indeed, the very editorship of the series reflects this intention, with environmental historian Dan joining labour and migration historian Ed as co-editors). It struck us that since the climate emergency is not simply an environmental development, but also a social and political one, one that intersects with innumerable other processes – from colonialism to capitalism to migration to gender to racism to global inequality to diplomacy and so on – then it follows that historians from a diverse range of subfields should have lots to say about the crisis, leveraging their expertise towards a richer understanding of its origins, thereby enabling sounder approaches towards its resolution. In practice, however, we found this to be a more difficult task than anticipated. In putting together the series a trend quickly emerged in which historians in the usual-suspect subfields readily said “yes” to participating, while bringing in voices from other fields proved more challenging (though well worth the effort given the stellar contributors we ultimately lined up). Perhaps this was a fluke and no grand lessons should be gleaned from it. But perhaps it speaks to some of the barriers that exist to engaging with the climate emergency as historians. Incorporating a technical and science-heavy subject – and one that may seem more contemporary and future-oriented than historical – into writing or teaching can be intimidating for those who aren’t environmental or climate historians. With this in mind, we in part envision this series as aimed at those folks who want to engage with the climate crisis in their work as historians but may be unsure about where to start. We hope this series can provide some avenues for thinking about, and incorporating, the climate crisis into their work as teachers, researchers, and writers. The series will run over the next five weeks, with posts appearing on Tuesdays and Thursdays on both ActiveHistory.ca and NiCHE (and cross-posted on HistoricalClimatology.com and ClimateHistory.net). The contributions can be loosely grouped into two main categories: “Critical perspectives on the climate emergency” and “Climate in the classroom.” The series features contributors from a range of scholarly disciplines with a diverse array of research interests, who run the gamut from emerging scholars to renowned experts in their fields. In titling the series, “Historians Confront the Climate Emergency,” we are claiming an expansive definition of historian that has less to do with disciplinary boundaries and instead simply refers to anyone who studies the past; and more to the point, for our purposes as “active historians,” to anyone who studies the past with an eye to better understanding, and thus better informing, the present. Over the next five weeks, we are thrilled to share contributions from:
Stay tuned. Daniel Macfarlane is an Associate Professor in the Institute of the Environment and Sustainability at Western Michigan University, co-editor of The Otter-La loutre, and a member of the executive board of NiCHE, Network in Canadian History & Environment. Edward Dunsworth is an Assistant Professor in the Department of History and Classical Studies at McGill University and a member of the editorial committee at ActiveHistory.ca. [i] Examples drawn from a number of news reports and from the impressive International Disaster Database, from the Centre for Research on the Epidemiology of Disasters at the Université catholique de Louvain, Belgium.
Dr. Andrea Kiss, Technische Universität Wien General background The countries of the Hungarian Crown - with the Hungarian kingdom the most prominent - represented one of the key political and military powers in East-Central Europe in the Middle Ages. The Hungarian kingdom alone (which included present-day Hungary, Slovakia, Eastern Austria, Eastern Slovenia, Western Ukraine, Western and Central Romania, Northern Serbia, and Northern Croatia) occupied an area (325,000 km2) larger than the entire British Isles. When combined with the 42,000 km2 Slavonia (present-day Central, Northern Croatia and North-west Bosnia), it covered the entire Carpathian Basin (Fig. 1). Population density was well under the high-medieval average for Western Europe, but the region was less affected by the Black Death than other areas, so by the mid-14th century, the figure was more comparable. The end of the Middle Ages was marked by the Battle of Mohács (1526), when the Hungarian royal army was crushed by the incomparably larger Ottoman forces. 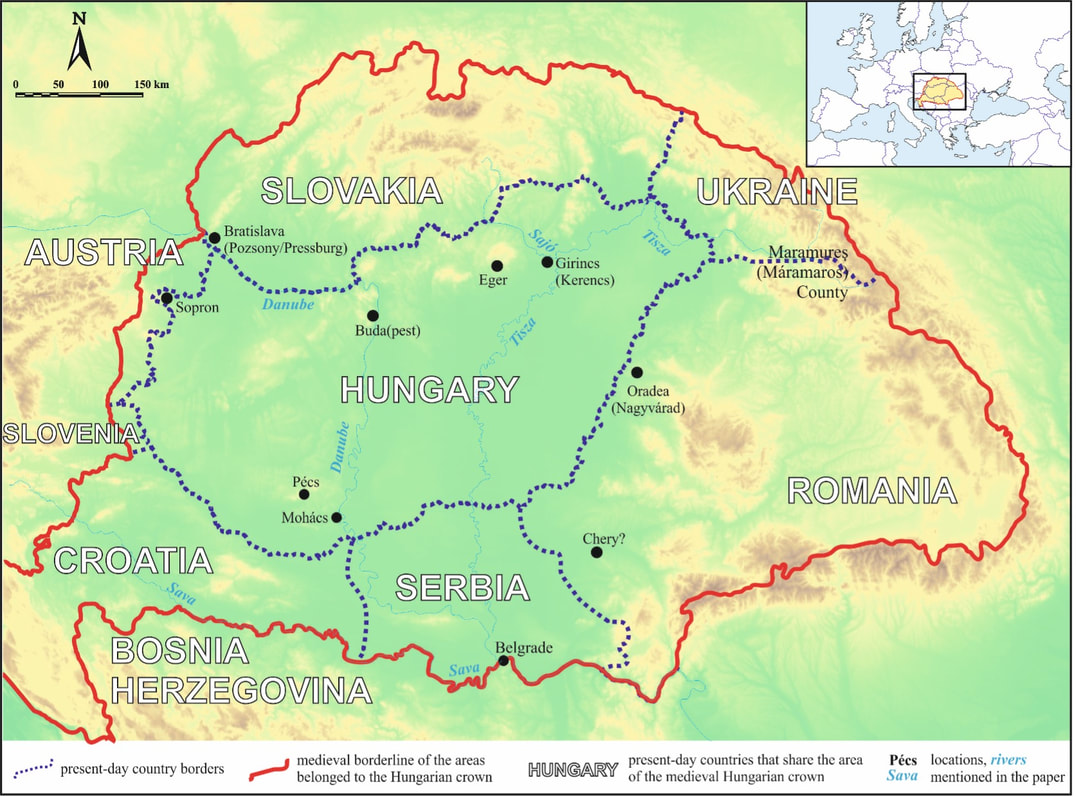 Fig. 1 The countries of the Hungarian crown (the kingdoms of Hungary, Slavonia, Croatia, and Dalmatia), with the locations and rivers mentioned in the paper (historical names in brackets) Isolated examples of documents referring to the weather survive from the high medieval (11th-13th century) period; records are more frequent from the mid-to-late 13th century and especially from the early 14th century. What makes the Carpathian Basin truly unique compared with the rest of Europe is the composition of contemporary source types, above all those containing weather-related information. Contemporary sources – vivid real-life weather and flood reports The medieval climate- and environment-related sources from the Carpathian Basin are rather special because, except for the mid-to-late 15th century, the main European sources of historical climate analysis (i.e., chronicles and annals) are mostly lacking. Instead, there are tens of thousands of particularly rich and detailed charters dating from the 13th and especially the early 14th centuries containing lengthy field surveys and descriptions of environmental and weather conditions. Additionally, economic-administrative documents are available sporadically from the 14th and systematic from the 1430s onwards; among these, especially the chamberlain accounts of Bratislava (historical Pozsony/Pressburg; hereafter Pressburg accounts) provide a great deal of weather-related information (Fig. 2). 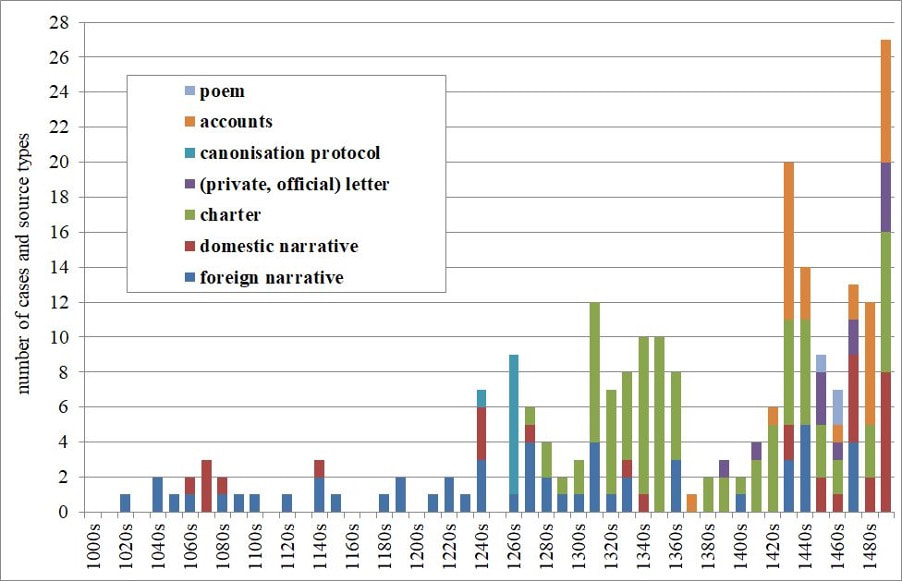 Fig. 2 Decadal distribution of weather-related source types (floods excluded; for floods, see: Kiss, 2019) in the medieval Carpathian Basin (1000-1500; work in progress) each source with weather report taken as one case. Published data: Kiss 2013, 2014, 2016, 2017, 2020a; Kiss and Nikolić-Jakus, 2015 Charters, letters, and town, estate and tithe accounts occasionally contain short but very realistic and punctual reports on actual weather conditions (e.g., rainy, snowy, foggy, hot, cold), weather extremes (e.g., storm, thunderstorm, hail, and so on), and weather-related extremes (especially floods and some of the great droughts); floods and hard winters tend to receive the most attention. Further data on weather and weather-related extreme events in Hungary are occasionally found in foreign narratives, mainly in the German-speaking areas and neighboring countries. Thus, while narratives are overwhelmingly important in medieval European climate-history research, an almost complete lack of weather-related information in the few high- and late-medieval narratives relating to Hungary and the Carpathian Basin means that a historian of the region has to use sources rarely used elsewhere. This is especially true for the period up to the mid-15th century, from which point other major European source types – particularly narratives and town accounts – assume a greater significance. Unique legal documentation of weather and floods: field surveys, perambulations and other charter types Charters are a unique medieval legal-administrative source type for climate history research in Hungary, which fact originates from the differences in legal documentation practices from most other parts of Europe. While charter production practices in high medieval times show no significant differences from other Central European types (East-Central European in particular), the documents are longer, more detailed, and often even annalistic from the 13th century. Nevertheless, it is the new royal dynasty in the early 14th century – the Italian Angevins, Charles Robert I in specific – that brings the real change, also responsible for the quantity boom of charters particularly from the 1320s (more details: Kiss 2019). 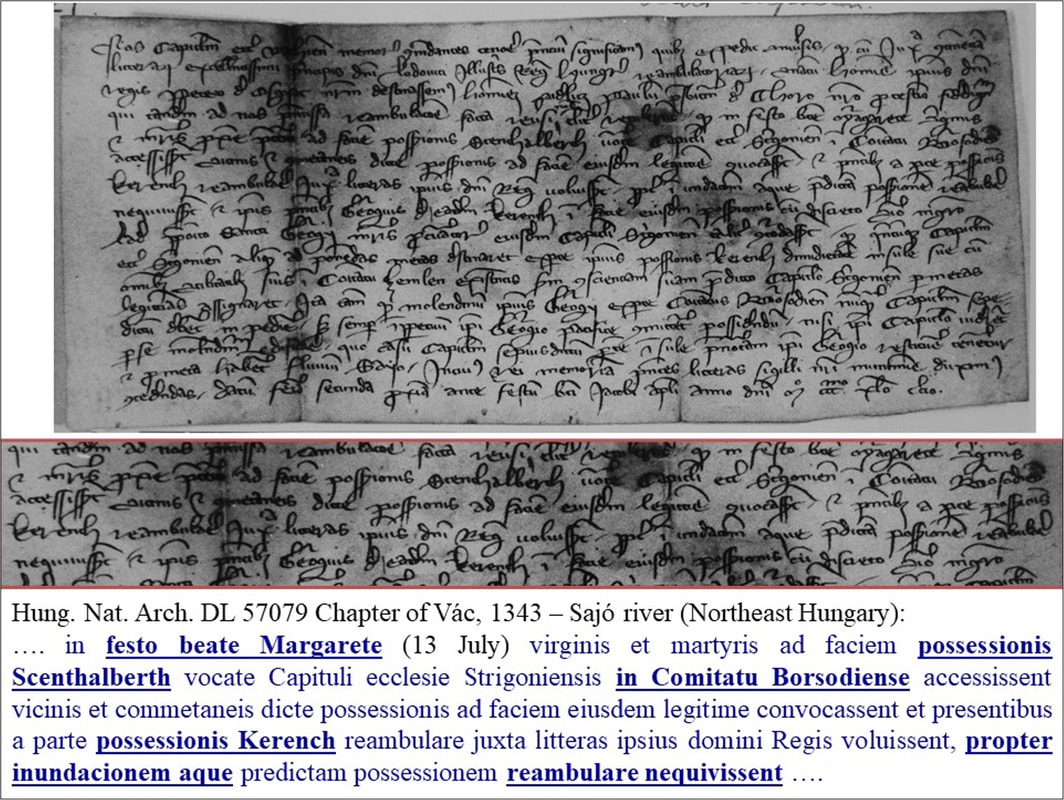 Fig. 3 Hungarian National Archives (HNA) DL 57079. The perambulation charter of Kerencs and Szentalbert landed possessions on the borders of Zemplén and Borsod Counties (in present-day North-east Hungary), describing the partly unsuccessful perambulation caused by an inundation Apart from the (donation) charter reports on famous political-military events also mentioning weather extremes, the most distinctive branch of charters contains field surveys and perambulations. In a field survey or perambulation charter the surveyors describe in detail processes and landscape features while walking along the boundaries, and point out obstacles – including weather- or flood-related – that hinder or obstruct them (example: Fig. 3). Moreover, these official reports were subject to further inspections that give further legitimation to the reliability and accuracy of their contents. Perambulators often made repeated attempts to complete their work; sometimes it had to be abandoned altogether because of extreme weather(-related) environmental conditions, for example, great floods, deep snow, or other extreme weather conditions, or a combination of such hindrances (e.g., Kiss, 2009, 2019). Although charters are key sources for weather research for the period between the 13th and early-to-mid-16th centuries, they are crucially important in any climate reconstruction for the 1320s-1420s (Fig. 2; see also Kiss, 2014, 2016, 2020). Nevertheless, other types of charter (e.g., prorogation and inquisitorial) can also contain weather-related entries, especially regarding travel and transportation. A particularly interesting, smaller group of charters is the royal donations: occasionally taking the form of narratives, with annalistic, detailed descriptions of important events or military campaigns, donation charters may also refer to the weather when it has an impact on the story. For example, information on the thawing of the snow and the subsequent downpour that led to the catastrophic defeat of the Mongols in Transylvania during the Second Mongol Invasion in 1285 was included in donation charters (see Kiss, 2014). Another important group of contemporary weather-related records is the legal documents issued by ecclesiastical jurisdictions. The canonization trial protocols of Saint Margaret, the Dominican nun (and royal princess), are a rare example: the official investigations – which were carried out by papal legates – took place in Buda(pest area) in 1276, seven years after her death, and contain the testimonies of over a hundred eyewitnesses. The most important miracle (as described by eyewitnesses) concerned two Danube ice jam floods that occurred in December 1267-January 1268; some of the witnesses also described sudden rain, muddy, inundated terrain, and gloomy weather. The church had its own legal system within (and beyond) the country: complaints against a member of the church, applications for a modification of ecclesiastical rights (e.g., establishing new parishes or changing boundaries), or inquiries into particular incidents were usually addressed to the local bishop or his administration. Avoiding the local bishop, some of these applications were directly addressed and sent to the pope, and are preserved in Avignon or Rome. Reaching their peak around the late 14th and the early 15th centuries, these sometimes contain references to weather or floods, while data on specific prayers and processions (rogation ceremonies) asking for rain are also known in one-one cases (e.g., Kiss, 2016, 2017). Official in the private and private in the official: (un)official letters and medieval memoires Official and/or private letters occasionally contain particularly important reports on weather extremes; these become more frequent in the 15th century. Their importance lies not only in their realistic and clearly dated eyewitness descriptions of these events but also in the information they provide on their social context and consequences. They offer insights into the private individual and/or popular perceptions of the events (in terms of religious belief or practical understanding). Authorship ranges from town citizens through medium- and high-status churchmen and noblemen up to kings and queens; occasionally, the letters of foreign legates provide interesting information on the subject. With rare exceptions, the letters show a rather practical, ‘survival mode’ approach to unusual/unexpected extreme weather. In addition to describing events, they usually focus on practical issues, for instance offering solutions and/or reorganizing subsequent activities. A good example is the extreme early ice-cover case that was described in a letter written by a Florentine legate in 1427. Ottoman troops had crossed the icy Danube near Belgrade in the south in mid-November (!) and caused great destruction in the region. In the meantime, the legate was waiting to cross the Sava River, which was impassable because of strong ice drifts (C. Tóth et al., 2020). Another interesting letter – written by the castellan to his lord, John of Hunyad – comes from the south-east (see Fig. 1), where a castle called Chery was swept away (!) by torrential waters just before mid-April 1443 (HNA DL 55253). No further details of this extraordinary event were supplied; the communication was essentially a request for a (good) carpenter who could supervise and help in rebuilding the castle. A third typical example is the letter of Queen Beatrix (HNA DL 98454) written in March 1496 in which she asked the salt chamber of Máramaros (Maramureş-Ro) about a large consignment of salt that never arrived. This was a result of the very low water level (‘lack of water’) of the Tisza River in 1494 – a famous drought year that was also described by Antonio Bonfini (Kiss, 2019, 2020; Kiss and Nikolić-Jakus, 2015). Amongst the private or semi-official documentation of the late medieval period, memoirs play a special role: not written for any orders, memoires provide down-to-earth accounts and allow their authors to express their own private views, understanding, and perception of events. They also present ample data on the physical-social environments in which the events described can be understood and interpreted. Written by an eyewitness of Italian origin in 1243, about the First Mongol Invasion (1241–1242), the Carmen miserabile (Szentpétery, 1999) is, without doubt, the most famous high-medieval memoir (or letter) of East Central Europe. The author, Master Rogerius, a clergyman (an archdean) living in (Nagy)Várad (Oradea-Ro), provides a shockingly realistic description of events: in addition to describing the Tatars and their massacres, and his own capture and successful escape, he includes precious information about the unusually cold winter, the deeply frozen Danube, and other weather-related environmental conditions that both helped and hindered the Mongols in their 1241-1242 invasion of the Carpathian Basin. Another, particularly interesting example is the memoire of Helene Kottanner – the wetnurse of the Hungarian king, Ladislaus V (1440-1458) – who provides us with detailed accounts of the weather during her travels in the central and western part of the country in the winter through summer of 1440 (Mollay, 1971). She writes about traveling in snow, moving through the Danube ice (almost disastrously), the rain and then heat, and the alternating dry and muddy roads in spring while crossing the Transdanubia, and presents a vivid description of a huge early-summer torrential downfall near Sopron on the western border of the country. Her daily/weekly observations parallel those of the Pressburg accounts (see Kiss, 2020a). Economic sources and the Pressburg chamberlain accounts (1434-1596) The medieval and early modern estate and manorial accounts, tithe rolls, and income and spending accounts of (mainly royal) towns occasionally contain weather data from the late 14th century. With one exception, until the end of the 15th century the reports tend to be sporadic, occasionally describing the consequences of a one-off rainfall event or period, expenses incurred in ice cutting in estate or town accounts, or a major flood event that resulted in partial tax relief, documented in a tithe account. With the exception of the extensive estate accounts of the Bishop of Eger from the beginning of the 1500s – which contain an unusually high number of weather-related references for certain years, including the drought and dearth years of 1506 and 1507 (E. Kovács, 1992; Kiss, 2020b) – perhaps the most important weather-related economic sources are town chamberlain accounts. 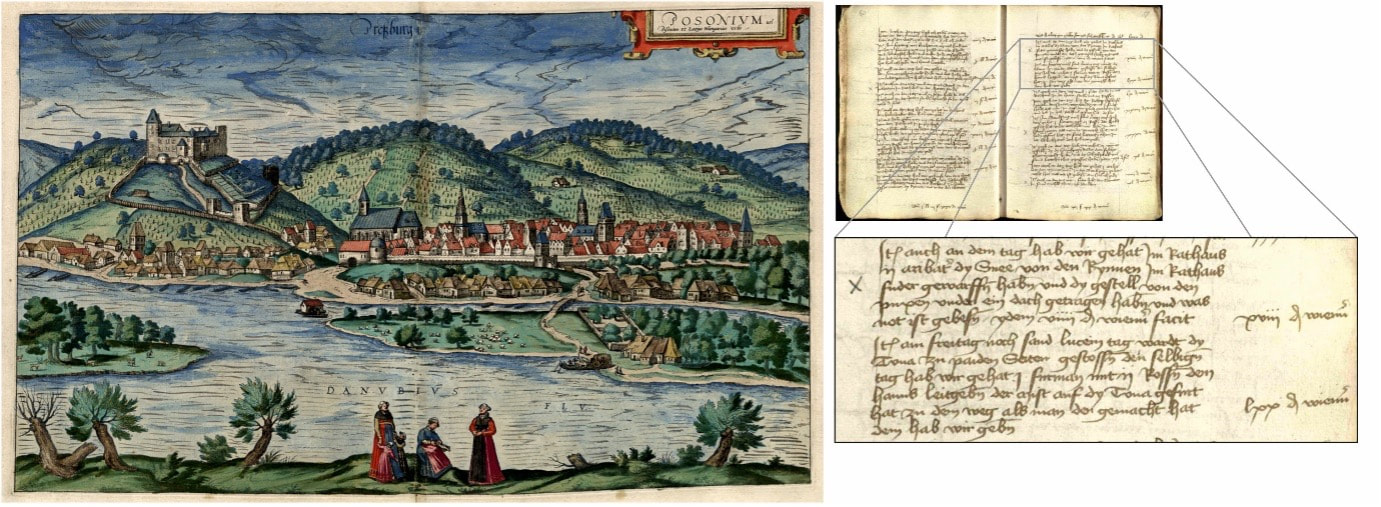 Fig. 4 The view of historical Pozsony/Pressburg (Bratislava-Sk) from the south with the Danube in the forefront (Braun and Hogenberg, 1594), and a sample page (AMB K5, 25) from the chamberlain accounts from 14 (Gregorian calendar: 23) December 1442, with reports on snow-cleaning, the freezing of the Danube and road preparation The present-day capital of Slovakia, Bratislava, historical Pozsony (capital of the Hungarian kingdom after 1541), Pressburg in German – the main language of the population and that of the local administrative documents in the 15th-16th centuries (1434-1596) – has by far the most detailed systematically presented town chamberlain accounts. Weather parameters such as precipitation (e.g., snow and rainfall), temperature (e.g., cold, freezing, various ice phenomena, Danube ice cover), strong winds, extreme weather (e.g., storms, torrential rain and flash floods) and related socio-economic information (e.g., high prices and transportation difficulties) are often mentioned when they have increased the cost of some of the everyday activities paid for by the town (Fig. 4). Because of its riverine position and the many kinds of riverine-related economic, travel, and transportation interests and activities in the Danube floodplain area and on the numerous islands, flooding and low water levels receive particular attention (Fig. 5). 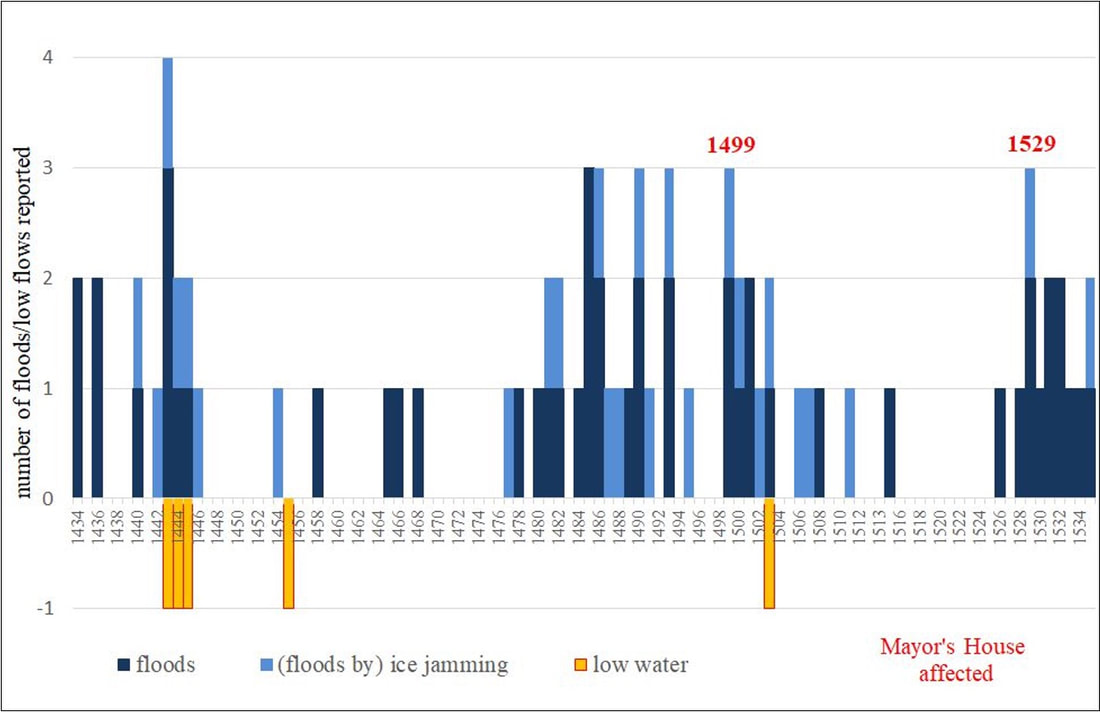 Fig. 5 Example of medieval Danube floods and low flows mainly based on the Pressburg accounts, 1434–1535 (work in progress; source: AMB K1-86; see also Kiss, 2019, 2020a). Note three anomalous periods: the 1430s-early/mid-1440s (with both floods and low flows) marking the early Spörer solar minimum, the late 1470s–early 1500s and a period from the mid-1520s – coinciding with the mid- (and late?) Spörer minimum. Two extraordinary intensity events highlighted; heights of the 1501 ‘deluge’ remain unreported Although in Central Europe one-one flood and grain-harvest-based temperature reconstructions have already used data from town accounts (e.g., Wels, Austria: Rohr, 2006; Basel, Switzerland: Wetter and Pfister, 2011), the present research is novel because it contains not only one-one systematic chapters or phenology-/flood-related data types extracted from individual town accounts, but also a systematic survey of the entire manuscript series containing all direct and indirect information on the weather and extreme weather-related conditions. The accounts are of great importance because they cover almost the entire Spörer Minimum (and beyond), an unusually long period of low solar activity. With only a few (mainly half-half year) gaps, the accounts straddle the late medieval and early modern periods, during which the administrative system and the methods of recording income and expenditure and related information remain mainly the same. Because of the frequency and high-resolution of detail they contain, they are indispensable for pinpointing Danube flood events. Allowing the extension of the annual-/seasonal-resolution flood (frequency, intensity, seasonality) reconstruction of a major European 500-year river flood series with almost a hundred year, it is one of the series of inevitable importance in large-scale multi-centennial flood analyses and reconstructions (see e.g. Blöschl et al., 2020). 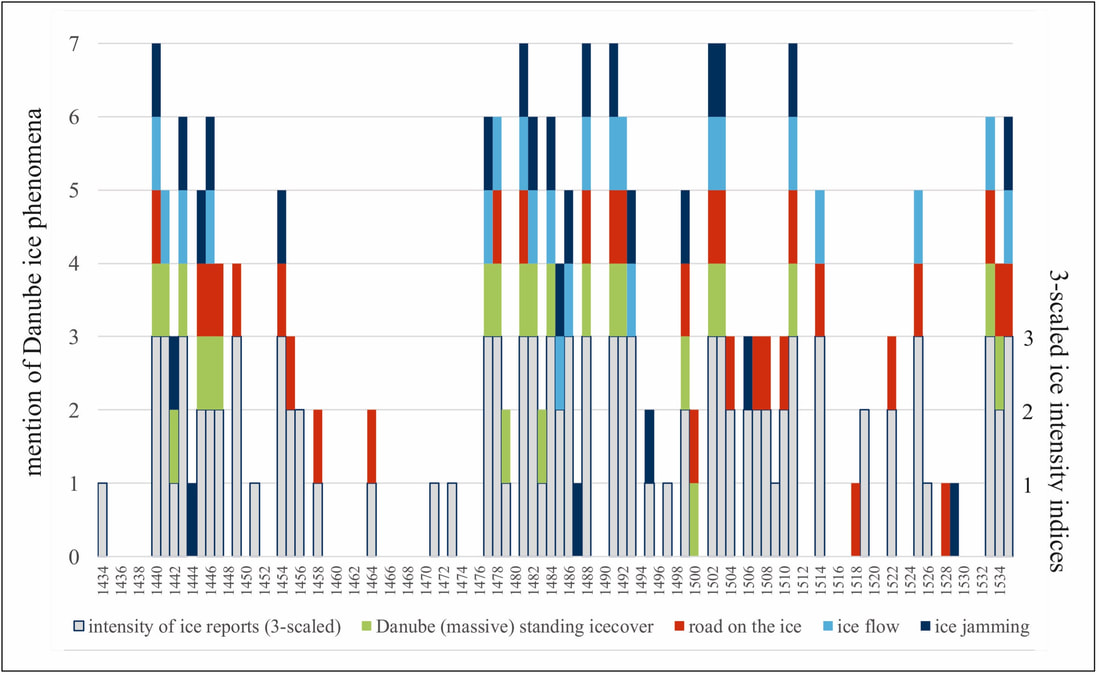 Fig. 6 Example of Danube-ice-related information between 1434 and 1535 in the Pressburg accounts (work in progress; source: AMB K1-86). Colors: systematic mentions of Danube ice-related phenomena and activities. 3-scaled ice intensity indices (mixed accounts): 1=sporadic mention of ice over the winter: 1-3 cases; 2=average mention of ice (ca. 4-6), also in multiple place and time; 3=ice frequently mentioned and in great spatial, temporal (and vertical) extent. Note two anomalous periods around the 1430s-1440s and the 1480s-1510s marking the hard winters of the early and mid-Spörer Minimum, and the cold winters of the (early) 1530s Within the chamberlain accounts almost all chapters contain weather-related information, but perhaps the most important source of information comes from the ferry and bridge accounts, where data is available on daily and weekly basis (bridges existed here over the entire Danube from the early 1430s). Furthermore, in separate chapters, references were regularly made to ice being cut in the town moat, snow-clearing works around the town hall, ships, and bridges, and floods (data included in Figs. 5, 6). The early parts of the accounts also contain a chapter that refers to payments to town messengers who sometimes had to endure harsh weather conditions, flooding, or the dangers associated with crossing the ice-covered Danube to carry messages to other areas of Hungary or Austria. Individual extreme events, sometimes real ‘delicacies’, occasionally are also described: for example, a case of mass soil erosion that occurred in summer 1458 when it appears that the earth on the hillside(s) over and around the town was washed down by torrential rain(s). On that occasion, the town paid to clean the streets and some of the roads of the sediment (maybe also of a Danube flood?; source: AMB K26). Although such expenditure is often listed in separate chapters, weather-related information can be found in all kinds of payments, most especially those of the (longest) category: the miscellaneous expenses (e.g., Kiss, 2019, 2020a). Animated rivers, rainfall-triggered erosion, and the mid-winter blossoming of an almond tree: the brave new trend of humanism The Italian Renaissance spread to and blossomed in Hungary from the second half of the 15th century; referring to real-life extreme weather(-related) events, the perception of nature often appeared in humanist writing. Humanists such as Janus Pannonius (the Bishop of Pécs, who studied in Italy) and the Italian Antonio Bonfini (who was living in Hungary at the time) used weather and weather-related phenomena in their allegories, the details of which help us to date the occurrence of unusual events such the mid-winter blossoming of an almond tree, winter snow-cover, or a great flood. In addition to his descriptions of significant late 15th-century droughts, Bonfini, in the Rerum Ungaricarum Decades (Fógel, 1941), refers to the flood that occurred after the death of King Matthias - which is also mentioned in Austrian sources and the Pressburg accounts (see Fig. 5) – where the Danube appears as a protective, living entity. A real ‘delicacy’ is the poem De inundacione of Janus Pannonius who describes great torrential rainfall and a subsequent flood event involving the largest rivers in the South Carpathian Basin, and connects the event to the arrival of a famous comet (V. Kovács, 1972). His dating of the event to the arrival of a famous comet – reported in Europe and all over the Northern Hemisphere (e.g. Hasegawa and Nakano, 1995; Kak, 2003, Martínez and Marco, 2016; de Carvalho, 2021) in autumn 1468 – has made it possible to identify and connect this reference to a Danube flood reported around the same time in the Pressburg accounts. In this poem, as an allegory of the approaching apocalypse, Janus Pannonius presents a strikingly realistic ‘environmental catastrophe’ domino-model based on the cumulative effects of heavy rainfall, floods, subsequent soil degradation and mass erosion, the aggregation of infertile river sediments, the multiannual destruction of grain and grapevine harvests (and stocks) that result famine (see Kiss, 2019). References
AMB (Archiv hlavneho mesta SR Bratislavy/Archiv der Hauptstadt der SR Bratislava). Magistrát mesta Bratislavy (AMB-A/XXIV.1): Komarna kniha/Kammerbuch: K1–86 (1434–1535) Blöschl, G., Kiss, A., Viglione, A., Barriendos, M., Böhm, O., Brázdil, R., Coeur, D., Demareé, G., Llasat, M.C., Macdonald, N., Retsö, D., Roald, L., Schmocker-Fackel, P., Amorím, I., Bĕlinová, M., Benito, G., Bertolin, C., Camuffo, D., Cornel, D., Doktor, R., Elleder, L., Enzi, S., Garcia, J.C., Glaser, R., Hall, J., Haslinger, K., Hofstätter, M., Komma, J., Limanówka, D., Lun, D., Panin, A., Parajka, J., Petrić, H., Rodrigo, F.S., Rohr, C., Schönbein, J., Schulte, L., Silva, L.P., Toonen, W.H.J., Valent, P., Waser, J. and Wetter, O., “Current European flood-rich period exceptional compared with past 500 years,” Nature, 583, 2020, p. 560–566 Braun, G. and Hogenberg, F., Civitates Orbis Terrarum. Liber Quartus. Cologne, Bertram Buchholtz, 1594, map 44 C. Tóth, N., Lakatos, B. and Mikó, G., Zsigmondkori Oklevéltár. Vol. 14: 1427. A Magyar Nemzeti Levéltár Országos Levéltárának kiadványai 2, Forráskiadványok 59. Budapest, Magyar Nemzeti Levéltár, 2020 de Carvalho, H. A., An Astrologer at Work in Late Medieval France. The Notebooks of S. Belle. Time, Astronomy, and Calendars Vol. 11. Brill, 2021, p. 372–373 E. Kovács, P., Estei Hippolit püspök egri számadáskönyvei 1500-1508. Eger, Heves Megyei Levéltár, 1992 Fógel, J., Iványi, B. and Juhász, L. Antonius de Bonfinis: Rerum Ungaricarum Decades. Vols. 3 and 4. Leipzig–Budapest, B. G. Teubner–Budapest K. M. Egyetemi Nyomda, 1936, 1941 Hasegawa, I., Nakano, S., “Periodic comets found in historical records,” Publications of the Astronomical Society of Japan, 47, 1995, p. 699–710 Hung. Nat. Arch. (HNA) = Hungarian National Archives, Collection of Medieval Documents DL 55253, 57079, 98454 Kak, S., “Three interesting 15th and 16th century comet sightings Kashmiri chronicles”, History and Philosophy of Physics, 2003, physics/0309113 Kiss, A., “Floods and weather in 1342 and 1343 in the Carpathian Basin,” Journal of Environmental Geography, 2/3–4, 2009, p. 37–47 Kiss, A., “Weather and weather-related environmental phenomena including natural hazards in medieval Hungary I: Documentary evidence on the 11th and 12th centuries,” Medium Aevum Quotidianum, 66, 2013, p. 5–37 Kiss, A., “Weather and weather-related natural hazards in medieval Hungary II: Documentary evidence on the 13th century,” Medium Aevum Quotidianum, 68, 2014, p. 5–46 Kiss, A., “Weather and weather-related natural hazards in medieval Hungary III: Documentary evidence on the 14th century,” Medium Aevum Quotidianum, 73, 2016, 5–55 Kiss, A., “Droughts and low water levels in late medieval Hungary II: 1361, 1439, 1443-4, 1455, 1473, 1480, 1482(?) 1502-3, 1506: documentary versus tree-ring (OWDA) evidence,” Journal of Environmental Geography, 10/3–4, 2017, p. 43–56 Kiss, A., Floods and Long-Term Water-Level Changes in Medieval Hungary. Heidelberg–New York, Springer, 2019 Kiss, A., “Weather and weather-related natural hazards in medieval Hungary IV: Documentary evidence from 1401-1450,” Economic and Eco-history, 16, 2020a, p. 9–54 Kiss, A., “The great 1506-1507 drought and its consequences in Hungary in a (Central) European context,” Regional Environmental Change, 20, 2020b, No. 50 Kiss, A. and Nikolić-Jakus, Z., “Droughts, dry spells and low water levels in medieval Hungary (and Croatia) I. The great droughts of 1362, 1474, 1479, 1494 and 1507,” Journal of Environmental Geography, 8/1-2, 2015, p. 11–22 Martínez, M.J. and Marco, F.J., “Fifteenth century comets in non-astronomical Catalan manuscripts,” Journal of Catalan Studies, 2016, p. 51–65 Mollay, K. (ed.), Die Denkwürdigkeiten der Helene Kottannerin (1439-1440), Vol. 2, Vienna, Österreichischer Bundesverlag, 1971 Rohr, C. “Measuring the frequency and intensity of floods of the Traun River (Upper Austria), 1441–1574,” Hydrological Sciences Journal, 51/5, 2006, p. 834–847 Szentpétery, I., Scriptores Rerum Hungaricarum. Tempore ducum regiumque stirpis Arpadianae gestarum, Vol. 2, Budapest, Nap Kiadó, 1999 V. Kovács, S., Janus Pannonius munkái latinul és magyarul. Janus Pannonius élő emlékezetének halálának ötszázadik évfordulója alkalmából/Jani Pannonii opera latine et hungarice. Vivae memoriae Iani Pannonii quingentesimo mortis suae anniversario dedicatum, Budapest, Tankönyvkiadó, 1972, p. 371–381 Wetter, O. and Pfister, C., “Spring-summer temperatures reconstructed for northern Switzerland and southwestern Germany from winter rye harvest dates, 1454–1970,” Climate of the Past, 7, 2011, p. 1307-1326 Dr. Dagomar Degroot, Georgetown University  Temperature anomalies in the last 2,019 years. Ed Hawkins using data from PAGES2k and HadCRUT4.6. Students often ask me: how did climate history – the study of the past impacts of climate change on human affairs – come to be? I usually give the origin story that’s often told in our field: the one that sweeps through the speculation of ancient and early modern philosophers before arriving in the early twentieth century with the emergence of tree ring science and the theories of geographer Ellsworth Huntington. Huntington’s ideas perpetuated a racist “climatic determinism,” I say, but his imprecise evidence for historical climate changes meant that few historians took his claims seriously. Then, in the 1960s and 70s, the likes of Hubert Lamb, Emmanuel Le Roy Ladurie, and Christian Pfister developed new means of interpreting textual evidence for past climate, and used these methods to advance relatively modest claims for the impact of climate change on history. Their care and precision gave rise to climate history as it exists today – though the field did not attain true respectability until recently, when growing concerns about global warming encouraged many historians to reappraise the past. It’s a compelling story, and true in many respects. Yet it has a problem. Crack open Huntington’s publications, and it’s immediately obvious that there’s an uncomfortable similarity between them and many of the most popular publications in climate history today. Like Huntington, most climate historians write single-authored manuscripts. Like Huntington, many learn the jargon and basic concepts of other fields – such as paleoclimatology – before concluding that this knowledge allows them to identify significant anomalies or trends in past climate. Like Huntington, modern climate historians have assumed that societies were homogenous entities, with some more “vulnerable” to climatic disruption than others. They routinely focus on the rise and fall of societies, typically by focusing on the “fatal synergy” of famines, epidemics, and wars. Such narratives have been influential, and the best of them have helped transform how historians understand the causes of historical change. It is under the scrutiny of climate historians – and many other scholars who consider past environments – that the historical agency or “actancy” of the natural world has gradually come to light. Few historians would now argue that humans created their own history, irrespective of natural forces. Climate historians have also shown that the “archives of nature” – materials in the natural world that register past changes – can be as useful for historical scholarship as the texts, ruins, or oral histories that constitute the “archives of society.” And like other scholars of past climate change, historians have offered fresh perspectives on the challenges of the future: perspectives that may reveal what we should most fear on a rapidly warming Earth. Yet precisely because climate history has become an influential and dynamic field within the historical discipline, it is time to consider how it might be improved. Among other avenues for improvement, it is time to imagine how the field might transcend some of Huntington’s assumptions. It is time to consider how it could be better integrated within the broader scholarship of climate change, and thereby how historical perspectives might genuinely contribute to the creation of policies for the future. And it is time to ask whether the stories climate historians have been telling – those narratives of societal disaster – really represent the most accurate or useful way of understanding the past. 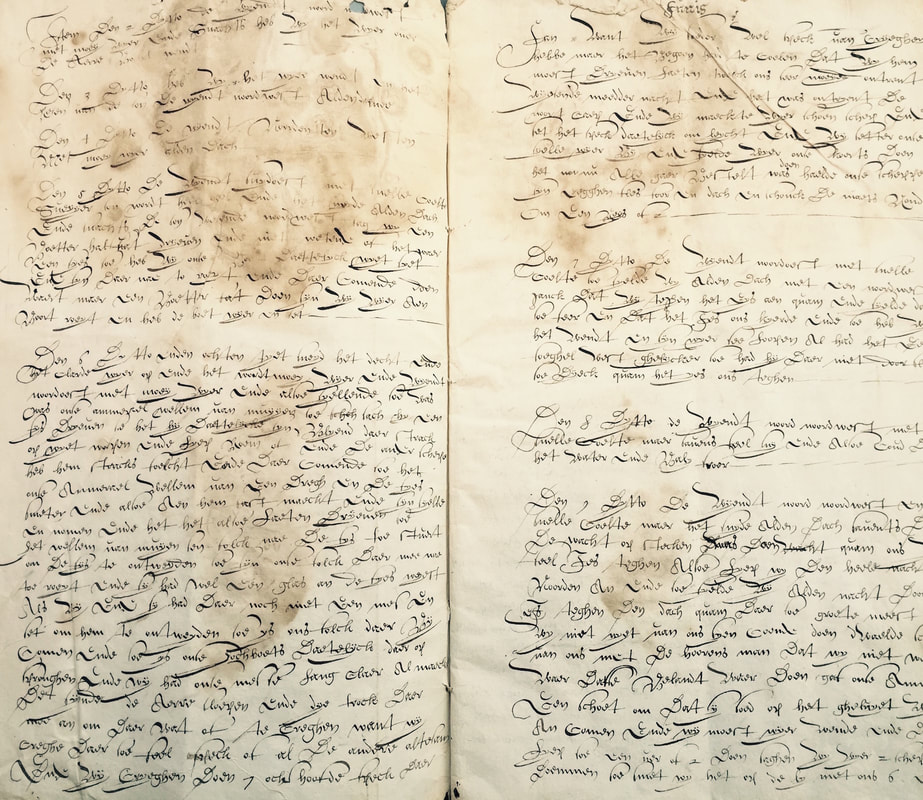 A seventeenth-century ship logbook. “Journaal van een Groenlandvaarder, 1615.” 0120 Oud archief stad Enkhuizen 1353-1815 (1872), Westfries Archief, Hoorn. I started thinking about that question while working on The Frigid Golden Age, a book that grew out of my doctoral dissertation. When I began my PhD at York University, I assumed my dissertation would confirm that the Dutch Republic, the precursor state to the present-day Netherlands, shared in those fatal synergies that climate historians had linked to the Little Ice Age. After a few months under Richard Hoffmann's tutelage, I learned that a group of scholars had digitized logbooks written by sailors aboard Dutch ships. I realized that those logbooks would allow me to start my research before I could travel to the Netherlands. Working with logbooks encouraged me to look beyond the famines and political disasters that had dominated scholarship on the Little Ice Age. Rather than searching for the climatic causes of disasters, I started thinking about the influence of climate change on daily life (aboard ships). It dawned on me that I could no longer rely on existing reconstructions of temperature or precipitation, which have less relevance for marine histories. I needed to learn more about atmospheric and oceanic circulation, which meant that I had to begin to understand the mechanics by which the climate system actually operates. I had to consider how circulation patterns manifested at small scales in time and place, so I had to think carefully about what it meant when one line of evidence (or “proxy”) – my logbooks, for example – contradicted another. Gradually, I learned to abandon my earlier assumptions, and to reimagine modest climate changes – such as those of the Little Ice Age – as subtle and often counterintuitive influences on human affairs. It didn’t surprise me when, shortly before I finished my PhD, a landmark book in climate history lumped the Dutch in among other examples of societies that shared in the crises of the Little Ice Age. By then I was framing the Republic as an “exception” to these crises, a unique case in which the impact of climate change was more ambiguous than it was elsewhere. Now, I started to wonder: was the Republic really as big of an exception as I had thought? Or were the crises of the Little Ice Age less universally felt than historians had assumed? Had climate historians systematically ignored stories of resilience and adaption? It was a question with significant political implications. By the time I arrived at Georgetown University in 2015, “Doomism” – the idea that humanity will inevitably collapse in the face of climate change – was just beginning to take off. In popular articles and books it relies primarily on two things: a misreading of climate science (occasionally with a heathy dose of skepticism for “experts” and the IPCC), and an accurate reading of climate history as a field. Past societies have crumbled with just a little climate change, Doomists conclude – why will we be any different? At around the time I published The Frigid Golden Age in 2018, I noticed that more of my students were beginning to echo Doomist talking points. I worried, because in my view Doomism is not only scientifically inaccurate, but also disempowering. If collapse is inevitable, why take action? It seemed perverse that the idea would gain momentum precisely as young, diverse climate activists were at last raising the profile of climate change as an urgent political issue. It seemed that now was the time to return to the question that had bothered me as a graduate student. So it was that I applied for a little grant from the Georgetown Environment Initiative (GEI), a university-wide initiative that connects and supports faculty working on environmental issues. I asked the GEI for funds to host workshops that would bring together scholars who had begun to study the resilience of past communities to climate change. Through discussions at those workshops, I hoped to draft an article that would highlight many such examples – and perhaps systematically analyze them to find common strategies for adaptation. The goal would be submission to a major scientific journal: precisely the kind of journal that had helped to popularize the idea that societies had repeatedly collapsed in the face of climate change. I soon realized that the workshops would have to connect scholars in many different disciplines, not just history. A striking series of articles was just then beginning to call for “consilience” in climate history: the creation of truly interdisciplinary teams wherein sources and methods would be shared to unlock new, intensely local histories of climate change. My experiences as the token historian on scientific teams that had developed their projects long before asking me to join had by then caused me to doubt the utility of working on research groups. Yet the new concept of consilience - and conversations with my new colleague Timothy Newfield - convinced me that there was much to be gained if scholars in many disciplines worked together to develop a project from the ground up. Eventually I learned that the GEI would award me enough money to host one big workshop at Georgetown. That was exciting! Arrangements were made, and before long Kevin Anchukaitis, Martin Bauch, Katrin Kleemann, Qing Pei, and Elena Xoplaki joined Georgetown historians Jakob Burnham, Kathryn de Luna, Tim Newfield, and me in Washington, DC. After a fruitful day of discussion, my colleagues suggested a change of focus. Why not consider how climate history as a field could be improved by telling more complex stories about the past? It was a compelling idea, but I added a wrinkle. What if those more complex stories were also often stories about resilience? To me, complexity and resilience could be two sides of the same coin.  Clockwise from top left: Kevin Anchukaitis, Kathryn de Luna, Martin Bauch, and Elena Xoplaki present at our GEI-funded Little Ice Age Lessons workshop. We decided to focus our work on periods of climatic cooling in the Common Era – the last two millennia – and accordingly I began to refer to our project as “Little Ice Age Lessons.” Then we settled on a basic work plan. I would draft a long critique of most existing scholarship in our field. Meanwhile, our paleoclimatologists would collaborate on a cutting-edge summary of both the controversial Late Antique Little Ice Age, a period of at least regional cooling that began in the sixth century CE, and the better-known Little Ice Age of (arguably) the fourteenth to nineteenth centuries. It had dawned on me while writing The Frigid Golden Age that many climate historians took climate reconstructions at face value, especially badly dated reconstructions, and used them to advance claims that no paleoclimatologist would feel comfortable making. One recent, popular book, for example, claims that the Little Ice Age cooled global temperatures by about two degrees Celsius; that's off by around an order of magnitude. False claims about climate changes lead to erroneous assumptions about the impact of those changes on history, and dangerous narratives about the risks of present-day warming. With our study, we hoped to model how to use - and not use - paleoclimatic reconstructions. I would work with one paleoclimatologist in particular – Kevin Anchukaitis of the University of Arizona – to reappraise a statistical school of climate history that quantifies social changes in order to find correlation, and therefore causation, between climatic and human histories. By applying superposed epoch analysis – a powerful statistical method that can accommodate lag between stimulus and response – to global commodity databases, we hoped to identify correlations that statistically-minded climate historians had missed, or else interrogate correlations that they had already made. Finally, our historians and archaeologists would contribute qualitative case studies that would each reveal how a population had been resilient or adaptive in the face of climate change. I hoped that these case studies would address my criticisms of our field, partly by relying on the cutting-edge reconstructions our paleoclimatologists would provide. While our initial group would have plenty of case studies to share, I immediately reached out to solicit more and more diverse examples of resilience, primarily from those parts of the world that Little Ice Age historians had most frequently linked to disaster. In the coming months, Fred Carnegy, Jianxin Cui, Heli Huhtamaa, Adam Izdebski, George Hambrecht, and Natale Zappia joined our team. Kevin soon became an indispensable partner. As the months went by, we exchanged countless messages on just about every concern I could come up with, most of which initially dealt with how to identify and interpret regional paleoclimatic reconstructions. After I found and began to interpret commodity price databases from across Europe and Asia, we began our statistical analysis. I was surprisingly unsurprised when we uncovered no decadal correlations between temperature or precipitation trends and the price of key staple crops across China, India, the Holy Roman Empire, France, Italy, or the Dutch Republic. In fact, we found no correlations even between annual temperatures and prices. We did find that precipitation anomalies correlated with price increases, but only during a small number of extreme years. These results, I thought, could be really important. Hundreds, perhaps thousands of publications in climate history all assume a relatively direct link between climatic trends, grain yields, and food prices. In fact, many studies conclude that it is from this basic relationship between climate change and the cost of food that all the economic, social, political, and cultural impacts of climate change follow, past or present. Had we found compelling statistical evidence that connections between climatic and human histories were subtler and more complicated in the Common Era than previously assumed? Maybe not. Kevin worried that we were falling into precisely the tendency that we hoped to criticize in our article: the temptation to reach grand conclusions on the basis of flimsy correlations. Heli Huhtamaa, who authored some of the most important scholarship that links climate change to harvest yields, soon explained that our price data did not necessarily reflect changes in yields - and that our price databases were far from comprehensive. Adam Izdebski consulted economic historian Piotr Guzowski, who pointed out that the gradual process of market integration in the early modern centuries may have blunted the impact of harvest failures (we would later stress this integration as a source of resilience). At the same time, I conferred with climate modeler Naresh Neupane, who asked insightful questions about our statistical methods. I also consulted leading climate historian Sam White for his perspective. He argued that in order to reach persuasive conclusions, we needed to develop or adopt a model for the impact of climate change on agriculture. Only then could we understand what our price series and correlations – or lack thereof – were telling us. I had mixed feelings – shouldn’t our impact model flow from our data, rather than the reverse? – yet I asked Georgetown PhD student Emma Moesswilde to join our team by sorting through just about every model ever developed by climate historians. As I suspected she would, Emma concluded that most assumed a relatively direct link between temperature, precipitation, harvest yields, and staple crop prices. Meanwhile, our case studies were beginning to flow in. I had established a hands-on workflow, with a constant pace of reminder emails and shared Google folders and files. I was incredibly fortunate to work with brilliant and motivated colleagues who collectively met our deadlines, despite many other commitments and pressures. By the summer of 2019, I had nearly every case study that would enter our article. Now it was a process of shortening each case study from several pages to about a paragraph each . . . then finding connections between them, organizing them according to those connections, and interrogating them using our cutting-edge climate reconstructions. The weeks dragged by. I hazily remember working long hours late into the night or in the wee hours of the morning, while my newborn son refused to sleep.  Kafue floodplain near Basanga, Central Province, Zambia. One of our case studies explores whether precipitation influenced migration in south-central Africa. Photo credit: Jeffrey Fleisher. If integrating our case studies was difficult, I found it surprisingly easy to criticize our field. Climate historians, I argued, had often misused climate reconstructions, and many uncritically followed methods that ended up perpetuating a series of cognitive biases. While climate history was multidisciplinary, it was not yet sufficiently interdisciplinary, meaning that it was still unusual for scholars in a truly diverse range of disciplines to work together. The upshot was that many publications were unconvincing either because they misjudged evidence, ignored causal mechanics, did not attempt to bridge different scales of analysis, or did not pay sufficient attention to uncertainty. By the fall, it was clear to me that something exciting might be taking shape. When Kevin joined us at Georgetown for a few days, he suggested that we might consider submitting to Nature, the world’s most influential journal. I found the idea tremendously exciting, if daunting. While still a young child I’d dreamed of publishing in Nature, inspired perhaps by tales told by a much-older brother who was then pursuing a doctorate in neuroscience. Now I thought of the influence our publication could have if Nature would publish it – and of career-altering ramifications for our graduate student co-authors in particular. I also thought about what it might do not only for the field of climate history (and relatedly, environmental history) but also more broadly for the transdisciplinary reach and prestige of qualitative, social science and humanistic scholarship. When fall turned to winter, I submitted a synopsis of our article to Nature, and early in the next year I was delighted (and frankly surprised) to receive an encouraging response. Our editor, Michael White, suggested that he would be interested in a complete article – but only if we considered including a research framework that would allow climate historians to address our criticisms. It was a crucial intervention. Kevin and I had worried that the part of our article that dealt with reconstructions and criticisms was becoming increasingly distinct from our statistical and qualitative interpretations of history. Yet a framework could allow us to convincingly bridge these halves. Michael asked whether we wished to submit a Nature Review, a format that would give us a bit more space and much more latitude to adopt our own structure. Yet space was still at a premium, and with our article so packed for content we decided that our statistical analysis had to go. This was a painful choice for me. While several co-authors remained skeptical, I considered it to be important, if incomplete, and I wonder whether to pursue its early conclusions in a future publication. Commodity prices do not tell us directly how climate anomalies influenced agriculture, yet to me the lack of statistically significant correlations between those anomalies and prices could still reveal something important about the impact of (modest) climate change on human history. By the spring, COVID-19 had reached all of our institutions, and we all grappled with a depressing new reality. As we transitioned to online teaching and those of us with children struggled with the absence of school or daycare, the pace of work slowed. It slowed, too, because I found the work more challenging than ever before. A key part of our process now involved interrogating our case studies more rigorously than before, and we soon found that many of those studies – including my own – suffered from precisely the problems we were attempting to identify and criticize. At first, this really troubled me. I sent question after annoying question to our co-authors, each of which, I’m sure, required extraordinary effort to answer. Not for the last time was I grateful for selecting such a remarkable team. While some scholars might have been affronted by my questions, all the answers I received were thoughtful and constructive. After a while, it dawned on me that this process of revision and interrogation could be an important part of the new research framework we hoped to advance – and a critical advantage of a consilient approach to climate history. We decided to be entirely upfront about the process, and in turn about how we were able to overcome the shortcomings that are all but inevitable in single-authored scholarship. We hoped that this expression of humility, as we saw it, would encourage other scholars to pursue the same approach.  The Great Wall in Beijing. One of our case studies explores the creation of the Qing Dynasty in China. Photo credit: Qing Pei. By early summer we had a complete draft. We now collaboratively undertook rounds of painstaking revisions to a Google Doc. As the weeks went by, we sharpened our arguments, excised unnecessary diversions, and crafted case studies that, we thought, convincingly considered causation and uncertainties. Everyone took part, and by the fall we were ready to submit. It was only when we received our peer reviews and Michael’s comments that I began to really believe that we might actually be able to publish in Nature. Still, our reviews did raise some criticisms that we needed to address. Using Lucidchart I created detailed tables, for example, that allowed us to visualize how we had interrogated each of our case studies, and a recent environmental history PhD and cartographer, Geoffrey Wallace, designed a crystal clear map to help readers interpret those tables. One big issue occupied me for nearly a week. A reviewer pointed out that we did not have a detailed definition of resilience, and wondered whether we even needed that term. Indeed “resilience” has become a loaded word in climate scholarship and discourse - and this requires a short digression. In 1973, ecologist Crawford Stanley Holling first imagined resilience as a capacity for ecosystems to “absorb change and disturbance” while maintaining the same essential characteristics. In a matter of years, scholars of natural hazards and climate change impacts appropriated and then modified the concept for their own purposes. Today, it is ubiquitous in the study of present and projected relationships between climate change and human affairs. Yet what it means exactly has not always been clear. Older definitions of the concept in climate-related fields privileged “bouncing back” in the wake of disaster, and were eventually criticized for assuming that all social change should be viewed negatively. Newer definitions can encompass change of such magnitude that all possible human responses to environmental disturbance could be classified as resilient – including collapse. The concept of resilience is also controversial for political reasons. Critics argue that a focus on resilience can carry with it the assumption that disasters are inevitable, and that it therefore normalizes and naturalizes the sources of vulnerability in populations. It can serve neoliberal ends, critics point out, by displacing the responsibility for avoiding disaster from governments to individuals. Since vulnerability is often the creation of unjust political and economic structures, the concept of resilience can obscure and thus support problematic power relations. Critics point out that normative uses of the concept can be used to denounce and “other” supposedly inferior – and typically non-western – ways of coping with disaster. Still, we decided that resilience was a term worth using. Only it and “adaptation” are terms that provide immediately recognizable and therefore accessible means of conceptualizing interactions between human communities and climate change that are different from, and often more complex than, those that can be characterized as disastrous. We decided that recent scholarship had moved beyond using the concept narrowly; in fact the IPCC now incorporates active adaptation within its understanding of resilience. We concluded that if we were careful to precisely define how we were using the term, and if we emphasized how resilience for some had come at the expense of others, then our use of resilience could allow us to more directly communicate to the general public – and to the policymaking community. In revisions it also became clear to us that many scholars who are not historians remain unfamiliar with the term “Climate History,” and associate it narrowly with the historical discipline. What we needed was a new term that, in the wake of our article, would unite scholars in every discipline that considered the social impacts of past climate change – and thereby encourage precisely the kind of consilient collaboration we call for. The term would need to communicate that this field was not another genre of the historical discipline - like environmental history - and it would need to stress our shared focus on the impacts of climate change on society. After we’d bounced around a number of options that seemed to privilege one discipline over another, Adam suggested “History of Climate and Society,” or HCS. We all agreed: this was a term that could work. Our article improved dramatically owing to the constructive suggestions of our editor and reviewers. Soon after we submitted our revisions, we learned to our delight that we’d been accepted for publication. Thanks to Adam, and with the support of press offices at Georgetown and the Max Planck Institute for the Science of Human History, we immediately started to plan a major effort to communicate our findings to the press, in at least five different languages.  Ruins of late antique villages in the Limestone Massif in Syria. One of our case studies considers the expansion of rural settlements in the Roman and Sassanian Near East during the Late Antique Little Ice Age. Photo credit: Artur Rodziewicz. To some extent, this article is part of that effort, and I hope it expresses some of the key findings of an article that, we hope, will also be accessible to the general public. Yet climate historians – or rather, HCS scholars – are the most important audience for this piece. I hope it illuminates, first, what it's actually like to work in consilient teams that aim to publish in major scientific journals. Working in such teams will be foreign to many historians in particular, and it reminded me a great deal of what it's been like to establish, then direct, both this resource and the Climate History Network. It is a managerial task not so different from running a small company or NGO, and it exposed for me how, in interdisciplinary scholarship, the service and research components of academic life easily blend together. Most importantly, I hope this article communicates some of the benefits of working on a thoroughly interdisciplinary, consilient team. On many occasions my co-authors raised a point I wouldn’t have considered, corrected an argument I had intended to make, or warned me against using data that would have led us astray. Through discussions with our brilliant team, I learned far more while developing this project than I have while crafting any single-authored article. Teamwork was not always easy, and it was extraordinarily time consuming. Not all academic departments in every discipline will fully recognize its value. Yet I’m convinced that it is usually the best way to approach HCS projects. And now it gives me a tremendous feeling of satisfaction to know what our team accomplished together. Beyond these questions of process and method, it’s worth asking where HCS studies stand today. Certainly our article did not disprove that climate changes have had disastrous impacts on past societies – let alone that global warming has had, and will have, calamitous consequences for us. Archaeologists moreover have long considered the resilience of past populations, and some of our conclusions will not surprise many of them. Yet we hope that HCS scholars in all disciplines will now pay more attention to the diversity of past responses to climate change, including but no longer limited to those that were catastrophic. We also hope that our article will both discourage Doomist fears and inspire renewed urgency for present-day efforts at climate change adaptation. According to the Fourth National Climate Assessment, in the United States “few [adaptation] measures have been implemented and, those that have, appear to be incremental changes.” The story is similar elsewhere. Our study shows that the societies that survived and thrived amid the climatic pressures of the past were able to adapt to new environmental realities. Yet we also find that adaptation for some social groups could exacerbate the vulnerability of other groups to climate change. Our study therefore provides a wakeup call for policymakers. Not only is it critical for policymakers to quickly implement ambitious adaptation programs, but a key element of adaptation has to be reducing socioeconomic inequality. Adaptation, in other words, has to include efforts at environmental and social justice. That is, perhaps, the most important Little Ice Age lesson of all. Dagomar Degroot, Kevin Anchukaitis, Martin Bauch, Jakob Burnham, Fred Carnegy, Jianxin Cui, Kathryn de Luna, Piotr Guzowski, George Hambrecht, Heli Huhtamaa, Adam Izdebski, Katrin Kleemann, Emma Moesswilde, Naresh Neupane, Timothy Newfield, Qing Pei, Elena Xoplaki, Natale Zappia. “Towards a Rigorous Understanding of Societal Responses to Climate Change.” Nature (March, 2021). DOI: https://doi.org/10.1038/s41586-021-03190-2.
Dr. Heli Huhtamaa, University of Bern  Many of these recent books on the history of climate deal with the Little Ice Age. But what was it, exactly? The Little Ice Age (LIA), a climatic phase that overlapped with the late-medieval and early modern periods, increasingly interests historians - academic and popular alike. Recently, they have tied the LIA to the outbreak of wars, famines, economic depressions and overall troublesome times. Not only a handful of climate historians are using the term anymore. These days, perhaps due to the overall increasing climate awareness, the period pops up in history-related print media, teaching, online blogs, and – of course – in academic research, among other places. As the LIA is the last distinctive climatic regime before the contemporary anthropogenic climate change, it can provide important analogues to better understand climate-society relationships on various temporal scales – from the direct consequences of short-term extreme events to multi-centennial dynamics of climate resilience. The term "Little Ice Age" was presumably introduced by François E. Matthes in 1939 when he chronicled the advance and retreat of glacier over the past 4000 years across the present-day United States [1]. Since the late 20th century, hundreds (if not thousands) of paleoclimate reconstructions and models have shed further light on the LIA, and the term has been widely accepted to indicate multi-centennial cooler phase occurring in the Northern Hemisphere during the second millennium CE. However, there the agreement over the universal characteristics of the LIA ends. Even a brief reading of the scientific literature on the topic reveals that there are remarkably differing views on the magnitude of the temperature depression, the spatial extent, as well as the onset and termination of the LIA. Within the discipline of history, economic historians Morgan Kelly and Cormac Ó Gráda authored perhaps the best-known publication that highlights the uncertainties related to the magnitude and dating of the event [2]. They have also used change-point analysis to argue that there is no evidence for any statistically significant change in the mean or variance of European temperatures that could be associated with an onset of the LIA [3]. Furthermore, a recent scientific study demonstrated that is it impossible to assign globally coherent dates for the coldest phases of the LIA [4]. Considering the uncertainties related to its periodization, is it appropriate for historians to keep on using the term LIA? In this article, I will argue that it is. However, this requires us to have some basic knowledge about the materials and methods used to detect past climate variability, as well as an understanding of the dynamical drivers of the LIA. My aim here is not to analyse systematically all available climate reconstruction data in relation to the LIA. Instead, I will explain what requirements reconstructions must meet to detect climatic change with statistical analysis, and then present a couple relevant examples. Neither will I revisit earlier criticisms of the LIA concept [2], as these have been addressed elsewhere by historians and scientists [5, 6]. Above all, I hope to reveal why the science of the LIA gives us such a complex image of the period and why this is – in fact – not at all a serious problem for historians. Detecting the onset of the LIA Scientists started to measure weather with instruments only in the 18th and 19th centuries. For periods further back in time, we can reconstruct past climate variability from climate proxies. Proxies are indirect climate data, materials which have been influenced by climate of the time when they were laid or written down, formed, or grown. Proxies are found either in the “archives of nature,” like in tree rings, ice layers or sediment varves, or in the “archives of societies.” For example, administrative sources, chronicles and private diaries may contain descriptions of weather and records of climate-sensitive activities, like harvest onset or river ice break-up dates. The later archive type, the written documents, holds climatic and meteorological information particularly relevant to human history [7]. The PAGES (Past Global Changes, an international association that bridges paleoclimatologists across the globe) 2k Consortium reconstructions indicate that mean temperatures in the Arctic, Europe and Asia were colder in the 13th and 14th centuries CE than in the previous centuries [8]. These multidecadal cooler anomalies may mark the possible onset period of the LIA (Figure 1a). Likewise, numerous individual climate proxy records show in increasing numbers signs of cooling temperatures from the 1300s and 1400s onwards across the Northern Hemisphere (Figure 1b). Thus, if we aim to identify LIA cooling statistically in individual temperature reconstruction data, our time-series should reach beyond the 13th century. This wide temporal scale, however, poses a challenge: where can we find data that goes back so far? 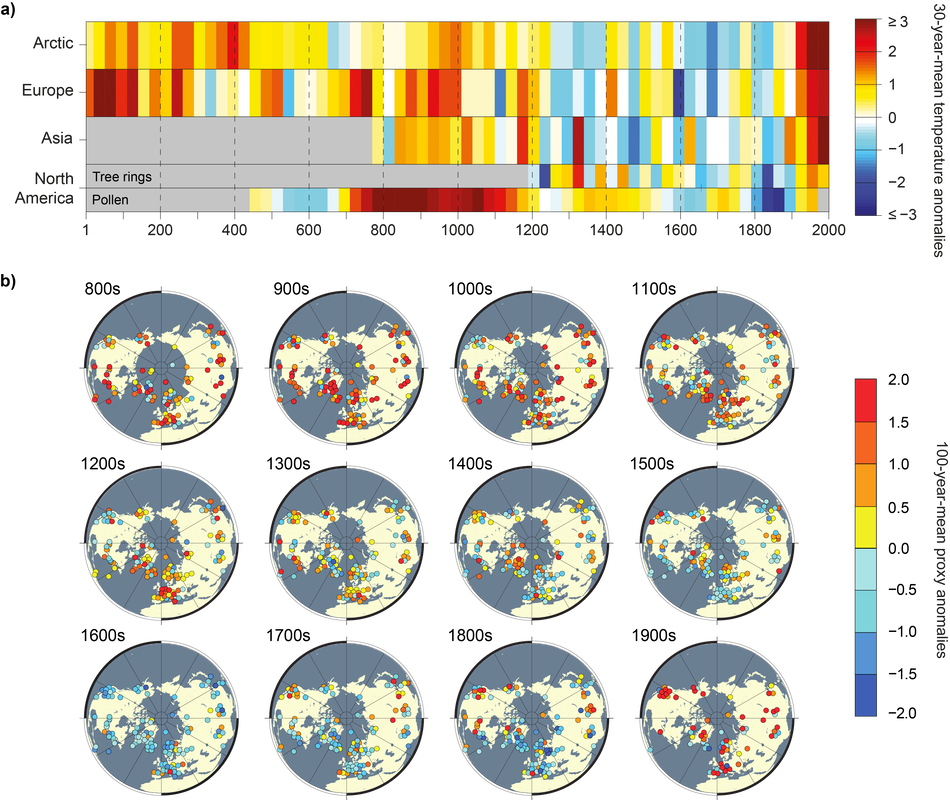 FIGURE 1. a) 30-year-mean standardized (1190–1970) temperatures for the four Northern Hemisphere PAGES 2k regions [8]. b) Northern Hemisphere standardized (1000–1900) centennial temperature proxy anomalies from various type of data material (ice-cores, lake and ocean sediments, speleothems, tree-rings and written documents) [9]. From written sources, climate variability is commonly reconstructed with one of the two standard methods: with the calibration-verification procedure or with the index approach [10, 11]. Calibration-verification procedure first translates time-series of climate-sensitive information (like harvest dates from written sources) into meteorological units (such as degrees Celsius) by calibrating the historical data to overlapping period of measured meteorological data. This statistical relationship is then verified with an independent period of overlapping meteorological data [10]. The index approach, on the other hand, first analyses historical climatic information qualitatively and then gives an ordinal-scale value for each datapoint, e.g. from -3 indicating extremely cold to +3 extremely warm [10]. The former method is better suited to detect so-called low-frequency variability (slow and gradual changes like the LIA), whereas the latter identifies primarily year-to-year variability (see Figure 2). For Europe, for example, there is no documentary-based temperature series which would cover the whole last millennium and which would be reconstructed with the calibration-verification procedure. This is because the climate data from European antique and medieval sources are too diverse and inconsistent to use this method to transform the materials into reconstructions [10]. Therefore, the reconstructions that extend prior 1500 CE are usually compiled with the index method. Unfortunately, climate reconstructions made from documentary data with this method are not well-suited to detect the LIA change, as these are known to poorly indicate low-frequency variability [10]. At first sight, one exception to the absence of calibration-verification reconstructions extending further back in time appears to be the Netherlands winter and summer temperature reconstruction by A. F. V. van Engelen and others [12]. However, these reconstructions also pose a challenge if we wish to statistically identify change happening over the 13th or 14th centuries because even visual inspection of the series reveal that the early section of the reconstruction appears to be based on ordinal indices. For example, the summer temperature series vary between only seven values before the 14th century (Figure 2). Even these reconstructions are therefore not well-suited to reveal the onset of the LIA, as there is a danger that change detectable with statistical analysis would indicate the change in the reconstruction materials and methods used, not the change in temperatures. 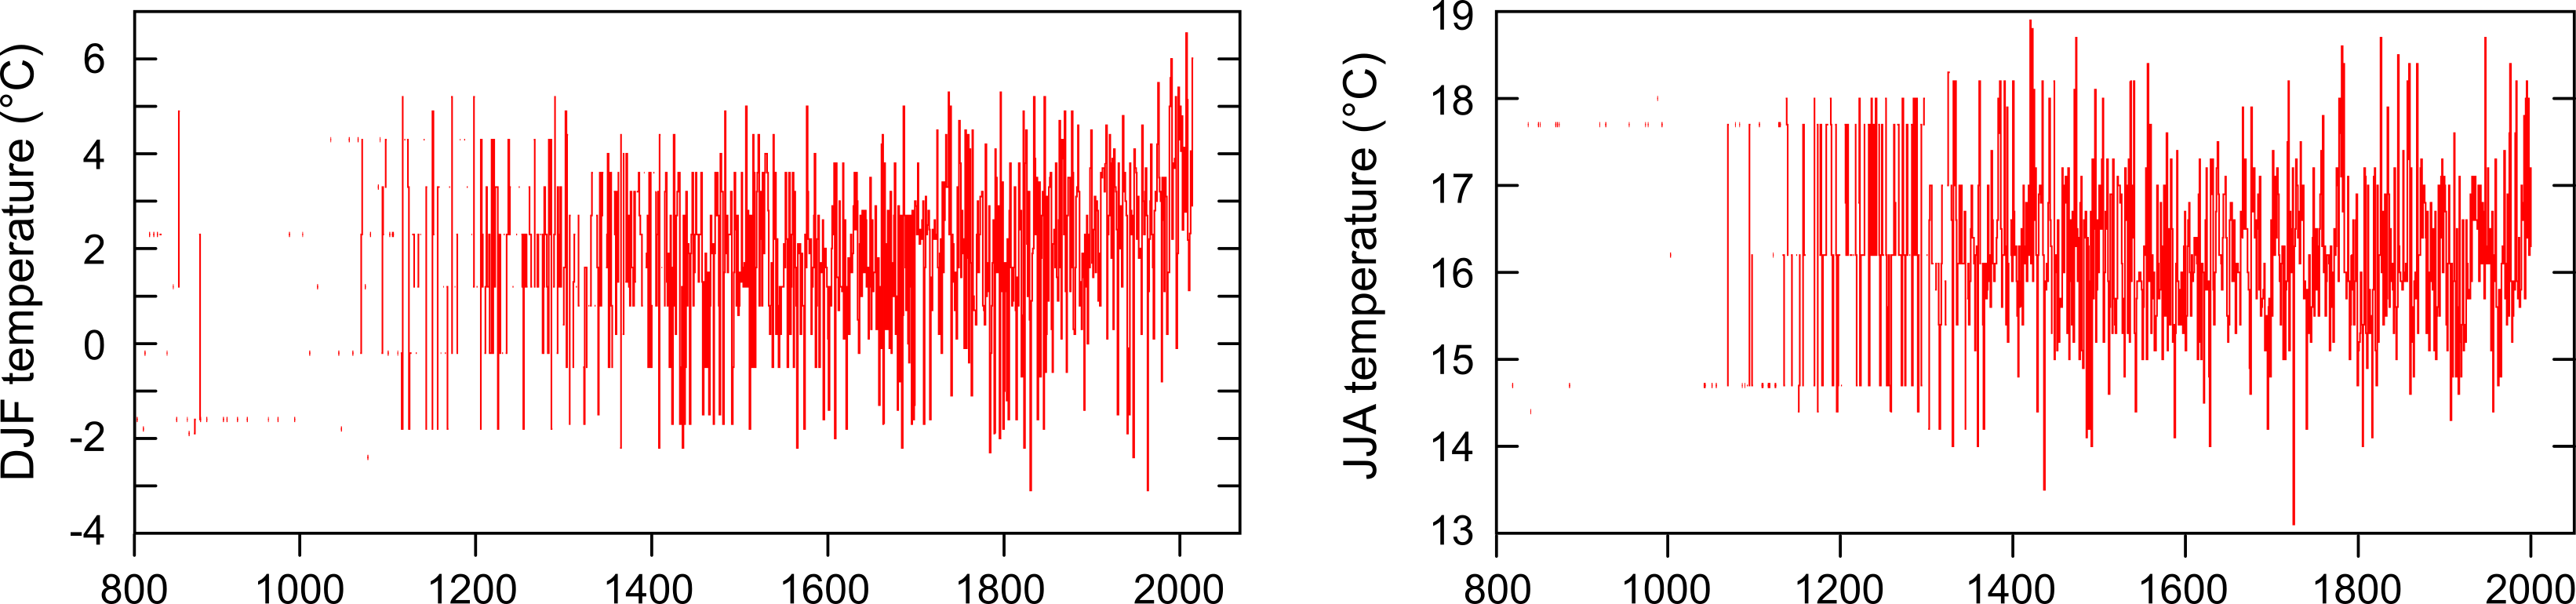 FIGURE 2. Netherlands December–February (left) and June–August (right) temperature reconstructions [12]. Note the change in the reconstructed values taking place over c. 14th century. The earlier part of the reconstruction resembles visually an index-based reconstruction and the latter calibration-verification one. Because of the lack of adequate document-based climate reconstructions covering the whole past millennium, the onset of the LIA needs to be detected from reconstructions compiled using natural proxy data. Yet, these reconstructions give markedly varying periodisation for the LIA. This is partly because different climate proxies, such as tree-ring width or isotopic concentrations in ice-core data, have different “response windows.” This means that different data from different locations are sensitive to different meteorological parameters (such as temperature or precipitation) over different timescales (from months to decades). Raw proxy data therefore portray a rather heterogeneous image of temperature variability over the past 1000 years (Figure 1b). Furthermore, non-climatic factors also influence the measured proxies, and sometimes it is difficult to distinguish heterogeneity that registers climate and weather from heterogeneity that simply reflects noise. Because proxy data are sensitive to past climate variability only in certain locations over certain seasons, and with imperfect accuracy, we have just a partial view of what has happened to climate prior to systematic meteorological measurements began. However, the differing response windows of different proxy data do not entirely explain our heterogeneous image of the LIA, as reconstructions made from same material type can be in interannual to multidecadal disagreement over past temperature variability. For example, when detecting change from mean warm season temperatures in northern Eurasia, three tree-ring density-based reconstructions suggest different dates for the onset of the LIA (Figure 3). 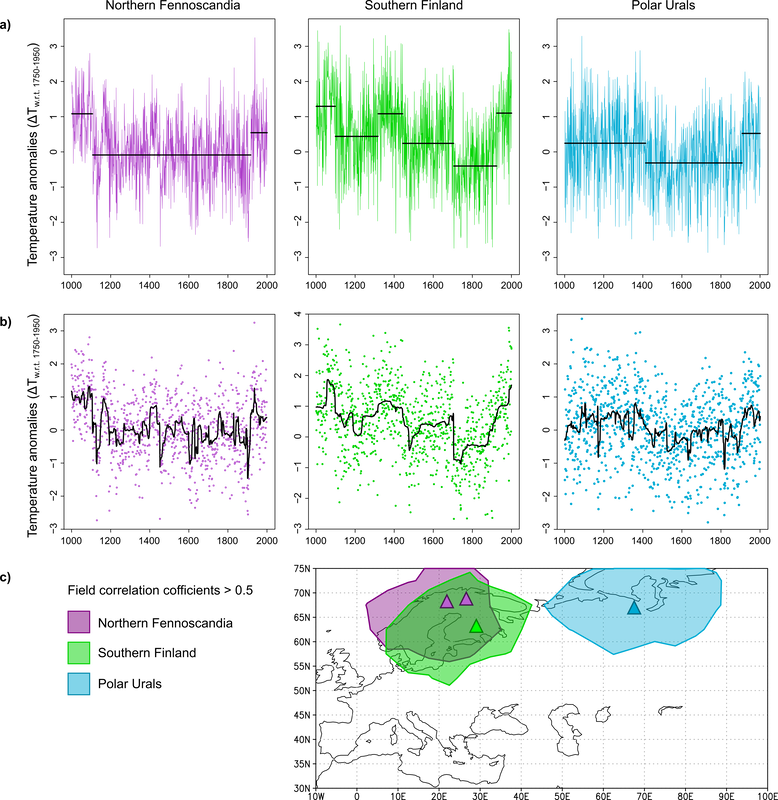 FIGURE 3. Changepoint analysis for three northern Eurasian tree-ring density-based warm season temperature reconstructions [13]. a) Changepoints in mean for three warm season temperature reconstructions in 1000-2000 CE detected with a Binary Segmentation method with a minimum segment length of 30 years [14]. b) The same trends are detectable in the posterior means (black lines) when the data are analysed with Bayesian changepoint procedure [15]. c) The reconstructions’ approximate sampling sites (triangles) and spatial domains (shading – the areas where the correlation coefficients (Pearson’s r) between the reconstructions and measured warm season temperatures are > 0.5 over the period 1850–2000) [16]. Still, most temperature reconstructions from the Northern Hemisphere identify a significant change to cooler mean temperatures, as in the examples presented in Figure 3. All indicate that the change to cooler climate took place well before the 1500s. Thus, the lack of detectable LIA change in previous analyses [3] may simply reflect the relative brevity of the time-series used. The main trigger of the LIA? The heterogenous spatiotemporal characteristics of the LIA can be primarily explained by the probable trigger of the climatic phase: volcanic aerosol forcing [17]. Large volcanic eruptions can inject sulphur compounds far into the stratosphere, where they are oxidized and become aerosols that absorb and scatter incoming solar radiation. The stratosphere warms but less radiation reaches the ground, cooling Earth’s surface. Many paleoscientists attribute multi-decadal temperature variability prior to anthropogenic warming – including the onset of the coldest phases of the LIA - to volcanic aerosol forcing [17, 18]. One common criticism of the LIA as a concept is that current climate change is not comparable to the LIA. Indeed, the LIA and anthropogenic warming are not comparable climatic phases in terms of the extent or magnitude of the change, partly due to the different drivers of these changes. Whereas the LIA was to a great degree triggered by volcanic forcing, the current climatic change is caused by rising atmospheric greenhouse gas concentrations (Figure 4). The climatic impact of these two forcing mechanisms differs considerably, so that while the onset of the LIA varies between reconstructions, the shift to a warmer climate is identifiable in a rather small temporal window (1900s–1920s, see Figure 3a) [19]. Furthermore, whereas long-term variations in temperature differ considerably prior to industrialization, all climate reconstructions presented here indicate similar long-term trends over the past 150 years (Figure 4). 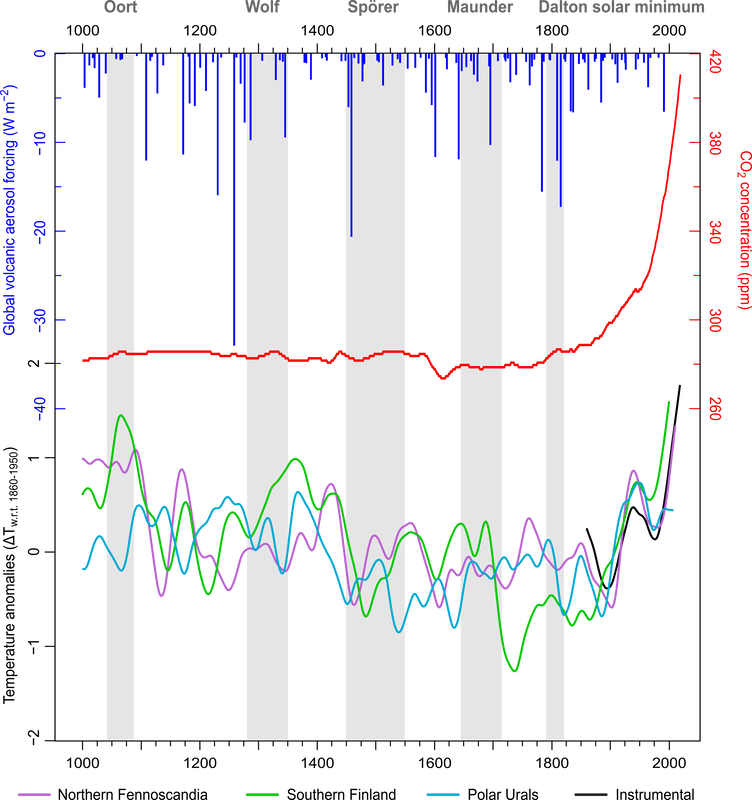 FIGURE 4. Global volcanic aerosol forcing [20], mean of global marine CO2 concentrations [21] and long-term (smoothed using 50-year spline) warm season temperature variability from the reconstructions presented in Figure 3 [13] and instrumental temperature measurements between 1860–2018 [22]. Moreover, volcanic aerosol forcing has both direct and indirect impacts on Earth’s climate. Its direct impacts refer to the mechanisms described above. Its indirect impacts are still not fully understood, but these likely contribute to the spatiotemporal heterogeneity of its climatic impacts. First, the eruption-related cooling is not globally uniform as, for example, oceans cool slower than land. Second, feedback mechanisms can prolong and intensify eruption-related cooling in some areas.
One such feedback mechanism is called ice-albedo feedback. Whereas open waters and dark forests absorb a lot of solar radiation and so warm Earth’s surface, white ice and snow reflect far more incoming solar radiation back into space, cooling the surface. During periods of increased volcanic forcing, the extent and duration of Earth's ice and snow area likely enlarged and prolonged because the cooler conditions, which further lowered temperatures. These feedbacks probably sustained locally and regionally cool surface temperatures long after the impact of volcanic aerosol forcing during the LIA [17]. Third, volcanic forcing alters stratospheric circulation as the direct radiative impacts enhance the Earth’s north-south temperature gradient. This can, for example, strengthen westerly winds. Consequently, northernmost Europe can experience winter warming following strong tropical volcanic eruptions, as westerly winds bring temperate and moist marine air masses to the area [23]. Lastly, some of the indirect effects might influence the main modes of climate variability, such as the summer monsoon circulation, El Niño-Southern Oscillation or the Atlantic Multidecadal Oscillation, which can further increase the spatiotemporal differences of the climate effects of volcanic aerosol forcing [24]. In summary, because the climate effects of volcanic forcing are spatially and temporally variable, the onset and the coldest phases of the LIA do not have a readily discernible global pattern. Furthermore, because of its indirect dynamical effects volcanic aerosol forcing can differently influence summer and winter season temperatures. This explains why reconstructions which have varying response windows and sensitivity to climate variability might identify the LIA period rather differently. Due to heterogeneity of the LIA, there was no “typical” LIA climate. Historians should therefore study climate during the period using regional reconstructions relevant to their study area and research questions. In some regions, the LIA was characterised by cool temperatures, in other places by increased year-to-year weather variability. However, climate is, by definition, the long-term average of weather. Commonly, the reference period is at least 30 years. Thus, calculating multidecadal central tendencies from reconstruction data (as well as paying attention to variance and minimum and maximum values) is necessary when defining past climatic regimes. Extreme years cannot be excluded from these calculations. Consequently, drawing attention to possible outliers (i.e. extraordinary cold years) does not lead us to exaggerate the coldness of average LIA conditions, although this has been suggested by some historians. Short-term climate anomalies are part of the prevailing climate. The LIA without Periodization This article argues that it is impossible to define universal dates for the onset, termination, characteristics, or coldest phases of the LIA. Instead, these seem to vary depending the region and season in question. But is this a problem for us historians? All historians are familiar with troublesome definitions for historical “periods” – with problematic “periodizations.” For instance, it is impossible to set a common date for the onset of the early modern period. Yet the term is widely accepted and used. Historians are comfortable defining the period depending on the region in question: for some regions a dynastic change marks the onset, whereas the Protestant Reformation or the discovery of Americas might be more appropriate for others. Moreover, the main characteristics of the early modern period vary. In some places the period is marked with a decline of serfdom, for example, whereas in others with an increase. We should accept that, similarly, the periodization and characteristics of the LIA varied from region to region. The climate variability of the Earth over the past millennium is still an unsolved puzzle. Paleoclimate research resembles other fields that investigate the past, such as the discipline of history. The science of the LIA is not – nor never will be – “done”. Just as each new historical study widens our understanding on the human past, each new reconstruction, simulation and paleoclimate research paper widens our understanding of past climatic changes. There are still many open questions considering the role of volcanic forcing in triggering and sustaining the LIA. Moreover, the possible effects of solar forcing need to be further explored. Therefore, it is essential that historians who are interested in past climates follow the progress of paleoclimatology [25]. The LIA sets certain boundaries in late medieval or early modern history. Needless to say, weather events (which usually are the triggers of human calamities) may or may not be typical for prevailing climatic conditions. For example, in the case of famines in LIA Europe, LIA conditions shortened the length and cooled down the temperatures of the growing season. This made the agricultural production and related food systems more vulnerable to disturbances than they were during warmer climatic phases, especially on the northern margins of agriculture. These disturbances can include weather events like frosts destroying the harvest, violent conflicts damaging grain yields, or entitlement failures due to hoarding of food stuff. Thus, the LIA, or any past period in history, cannot be imagined as the sole cause of past events, like famines. Instead, it gives an environmental context to these events in history. Of course, the term “Little Ice Age” is not perfect. It is, for example, not correct in a geophysical sense, as it took place during an interglacial period. However, the term is short, handy, and already widely used. It is practical in science communication, such as interdisciplinary research, teaching, and public outreach. As long as we remember the heterogenous characteristics of the period, by acknowledging the Little Ice Age and exploring its possible entanglements with the human past, we might get further insights into complex climate-society relationships. These can provide perspectives on both sides of the relationship: the agency of climate in human history and the agency of humans in adapting to changing climate and coping with extreme events. Such insights have arguably never been more important than at present, in the context of ongoing anthropogenic climate change and its rising toll on our societies. References and notes: [1] Matthes, F. E. (1939). Report of committee on glaciers, April 1939. Eos, Transactions American Geophysical Union, 20(4), 518-523. [2] Kelly, M., & Ó Gráda, C. (2013). The waning of the Little Ice Age: climate change in early modern Europe. Journal of Interdisciplinary History, 44(3), 301-325. [3] Kelly, M., & Gráda, C. Ó. (2014). Change points and temporal dependence in reconstructions of annual temperature: did Europe experience a little Ice Age? The Annals of Applied Statistics, 8(3), 1372-1394. [4] Neukom, R., Steiger, N., Gómez-Navarro, J. J., Wang, J., & Werner, J. P. (2019). No evidence for globally coherent warm and cold periods over the preindustrial Common Era. Nature, 571(7766), 550-554. [5] White, S. (2013). The real little ice age. Journal of Interdisciplinary History, 44(3), 327-352. [6] Büntgen, U., & Hellmann, L. (2013). The Little Ice Age in scientific perspective: cold spells and caveats. Journal of Interdisciplinary History, 44(3), 353-368. [7] Brönnimann, S., Pfister, C. & White, S. (2018). Archives of Nature and Archives of Societies. In White, S., Pfister, C., & Mauelshagen, F. (eds.), The Palgrave Handbook of Climate History. Palgrave Macmillan, London, 27-36. [8] The PAGES (Past Global Changes) Consortium (2013). Continental-scale temperature variability during the past two millennia. Nature Geoscience, 6(5), 339-346. [9] Charpentier Ljungqvist, F., Krusic, P. J., Brattström, G., & Sundqvist, H. S. (2012). Northern Hemisphere temperature patterns in the last 12 centuries. Climate of the Past, 8, 227-249. Note that some of the data locations on the map has been moved slightly to illustrate all the proxy material, also the overlapping ones. [10] Pfister, C., Camenisch, C., & Dobrovolný, P. (2018). Analysis and Interpretation: Temperature and Precipitation Indices. In White, S., Pfister, C., & Mauelshagen, F. (eds.), The Palgrave Handbook of Climate History. Palgrave Macmillan, London, 115-129. [11] Dobrovolný, P. (2018). Analysis and Interpretation: Calibration-Verification. In White, S., Pfister, C., & Mauelshagen, F. (eds.), The Palgrave Handbook of Climate History. Palgrave Macmillan, London, 107-113. [12] Van Engelen, A. F., Buisman, J., & IJnsen, F. (2001). A millennium of weather, winds and water in the low countries. In History and Climate. Springer, Boston, MA, 101-124. The time-series downloaded from the KNLM Climate Explorer. [13] Matskovsky, V. V., & Helama, S. (2014). Testing long-term summer temperature reconstruction based on maximum density chronologies obtained by reanalysis of tree-ring data sets from northernmost Sweden and Finland. Climate of the Past, 10(4), 1473-1487; Helama, S., Vartiainen, M., Holopainen, J., Mäkelä, H. M., Kolström, T., & Meriläinen, J. (2014). A palaeotemperature record for the Finnish Lakeland based on microdensitometric variations in tree rings. Geochronometria, 41(3), 265-277; Schneider, L., Smerdon, J. E., Büntgen, U., Wilson, R. J., Myglan, V. S., Kirdyanov, A. V., & Esper, J. (2015). Revising midlatitude summer temperatures back to AD 600 based on a wood density network. Geophysical Research Letters, 42(11), 4556-4562. The Polar Urals reconstruction data has been downloaded from a dataset provided by Wilson, R., Anchukaitis, K., Briffa, K. R., Büntgen, U., Cook, E., D'arrigo, R., ... & Hegerl, G. (2016). Last millennium northern hemisphere summer temperatures from tree rings: Part I: The long term context. Quaternary Science Reviews, 134, 1-18. [14] Analysis was performed with the R changepoint package (2.2.2) as implemented by Killick, R., & Eckley, I. (2014). changepoint: An R package for changepoint analysis. Journal of Statistical Software, 58(3), 1-19. [15] Analysis was performed with the R bcp package (4.0.3) as implemented by Erdman, C., & Emerson, J. W. (2007). bcp: an R package for performing a Bayesian analysis of change point problems. Journal of Statistical Software, 23(3), 1-13. [16] Warm season: June–August for the Northern Fennoscandia and Polar Urals, and April–September for the South Finland reconstructions. Correlation analysis performed with the Climate Explorer using the HadCRUT4/HadSST4 filled-in T2m/SST field data (Cowtan, K., & Way, R. G. (2014). Coverage bias in the HadCRUT4 temperature series and its impact on recent temperature trends. Quarterly Journal of the Royal Meteorological Society, 140(683), 1935-1944). [17] Miller, G. H., Geirsdóttir, Á., Zhong, Y., Larsen, D. J., Otto‐Bliesner, B. L., Holland, M. M., ... & Anderson, C. (2012). Abrupt onset of the Little Ice Age triggered by volcanism and sustained by sea‐ice/ocean feedbacks. Geophysical Research Letters, 39(2). [18] Neukom, R., Barboza, L. A., Erb, M. P., Shi, F., Emile-Geay, J., Evans, M. N., ... & Schurer, A. (2019). Consistent multi-decadal variability in global temperature reconstructions and simulations over the Common Era. Nature geoscience, 12(8), 643-649. [19] In addition, perhaps the early (pre-1950s) warming might be attributable also to some degree to the lack of volcanic aerosol forcing. Note also that depending on the reconstruction materials and methods, plausibly also better proxy sample replication or overlapping instrumental data may contribute to the similarity of temperature trends over the past 150 years. [20] Sigl, M., Winstrup, M., McConnell, J. R., Welten, K. C., Plunkett, G., Ludlow, F., ... & Fischer, H. (2015). Timing and climate forcing of volcanic eruptions for the past 2,500 years. Nature, 523(7562), 543. [21] Ballantyne, A. P., Alden, C. B., Miller, J. B., Tans, P. P., & White, J. W. C. (2012). Increase in observed net carbon dioxide uptake by land and oceans during the past 50 years. Nature, 488(7409), 70. Time-series downloaded from the KNLM Climate Explorer. [22] CRUTEM (4.6) T2m anomalies averaged over 20-70E and 60-70N, https://www.metoffice.gov.uk/hadobs/crutem4/; Time-series downloaded from the KNLM Climate Explorer. [23] Fischer, E. M., Luterbacher, J., Zorita, E., Tett, S. F. B., Casty, C., & Wanner, H. (2007). European climate response to tropical volcanic eruptions over the last half millennium. Geophysical research letters, 34(5). [24] Good summary of the climatic effects of volcanic aerosol forcing can be found, for example, in Brönnimann, S. (2015). Climatic changes since 1700, Springer, Cham (especially pp. 123–135). [25] Consequently, it is noteworthy to mention that although the LIA cooling is currently attributed to volcanic forcing, our understanding for the drivers of the period may advance in the future. Likewise, the Southern Hemispheric extent of the cool period may improve with new proxy data available. Special thanks to Dagomar Degroot and Fredrik Charpentier Ljungqvist for the inspiring discussions and comments which helped shape this text. Prof. Lisa Benjamin, Lewis & Clark College of Law  State parties (light purple), signatories (yellow), and parties covered by EU ratification (dark purple) in the Paris Agreement. L.tak, Wikipedia. As we enter the 2020s, the backdrop of the climate crisis remains grim. Recent scientific reports tell us that global greenhouse gas emissions are increasing, not declining as they need to. Emissions increased by 1.5% in 2017, 2% in 2018 and are anticipated to increase by 0.6% in 2019.[i] While emissions are decreasing too slowly in industrialized countries, they are increasing all too quickly in large developing countries. Despite this increase, per capita emissions in the United States and Europe remain 5-20-fold higher than in China and India,[ii] and a significant number of emissions in developing countries are attributable to the manufacture and production of goods consumed in developed countries. The window to achieve the Paris Agreement’s goals of limiting mean global temperature increases to well below 2°C above pre-industrial averages, and the aspirational goal of a 1.5°C limited increase, is closing quickly. Scientists are increasingly warning of the catastrophic threats of climate change.[iii] Lack of progress by the world’s governments places vulnerable countries such as small island developing states, as well as vulnerable communities within developing and developed countries, at increased risk.[iv] As the United States recently submitted its official notice to withdraw from the Paris Agreement, questions have been raised about the structural integrity of the agreement, and whether it can withstand these countervailing pressures.  Historical carbon emissions per capita. Map by Vinny Burgoo, data from World Resources Institute. The Paris Agreement is an internationally legally binding treaty, but its provisions contain sophisticated and varying levels of ‘bindingness’. In terms of emissions reductions, parties have legally binding procedural obligations to submit nationally determined contributions (or NDCs) every five years, but the level of emissions contained within those NDCs are “nationally determined” – i.e. up to each party to individually decide based on their national circumstances. In this sense, the Paris Agreement contains binding obligations of conduct, but not of result. The treaty was intentionally structured with this type of “bottom up”, flexible architecture as a result of the previous history of climate treaties. The UNFCCC, agreed to in 1992, has almost universal participation (including, for now, the United States). As a framework, umbrella treaty it has few specific binding provisions. The ultimate objective of the Treaty (and any related agreements, which would include the Paris Agreement) is to achieve stabilization of greenhouse gas concentrations at a level that would avoid dangerous anthropogenic interference with the climate system.[v] The definition of ‘dangerous interference’ was never fully articulated, and so the global temperature goals in the Paris Agreement of well below 2°C and 1.5°C flesh out this provision. The objectives of the UNFCCC were to be achieved on the basis of equity, in accordance with common but differentiated responsibilities, and the respective capabilities of the parties. Developed country parties were to take the lead in combating climate change.[vi] These principles were based upon the historical responsibility of developed countries for greenhouse gas emissions, and the acknowledgement that developing countries had fewer financial, technological, and human resources to tackle climate change, as well as high levels of poverty. With these principles in mind, in 1997 the Parties to the UNFCCC agreed the Kyoto Protocol in order to provide for more specific, binding emission reduction targets. Only developed country parties took on binding emissions reduction targets, which were housed in Annex I of the Protocol. They became known as ‘Annex I parties’ as a result. The Protocol had automatically applicable consequences for breach of the targets, with a robust compliance mechanism. The United States never ratified the Protocol, and a number of parties such as Japan and Canada either left the Protocol or have not ratified its second commitment period for a number of reasons. As emissions from developing countries rose significantly over the years, and existing parties such as Canada were not on target to reach their Protocol commitments, it was clear that a replacement to the Protocol was needed. The Paris Agreement’s flexible approach to NDCs was considered to be the most politically feasible global solution – it would attract almost universal participation from states (including developing states) and provide for cycles by which parties could increase the ambition of their emissions reductions over time. Nationally determined contributions are submitted every five years. The initial NDCs were submitted in 2015 and the next round of NDCs are due in 2020. In 2015, it was understood that cumulatively these initial NDCs would not be sufficient to achieve the temperature goals of the Paris Agreement, which is why a system of progressive and cyclical submissions was anticipated. Current NDCs submitted by parties have both conditional and non-conditional targets. For example, a number of developing countries made their emission reduction targets in their NDCs conditional upon receiving adequate levels of climate finance and technical and capacity building. Assuming all initial NDCs were fully implemented, Carbon Action Tracker estimated that global temperature increases would lie between 2.7-3.5°C – far beyond what the Paris Agreement aims for. There are a number of provisions in the Paris Agreement that anticipate increased ambition in countries’ activities. Article 4 states that NDCs should represent progress over time, and should represent its highest possible ambition. Parties can also adjust their NDC to enhance their level of ambition. Together, these provisions create a strong normative expectation that parties would violate the spirit of the Paris Agreement if they downgraded the ambition in their NDCs.[vii] But as there are no binding obligations of result in the Paris Agreement (only of conduct), the compliance mechanism in Article 15 has a very narrow mandate – it is designed to be facilitative, transparent, non-punitive, and non-adversarial. The mechanism does not focus on individual country results unless significant and persistent inconsistencies of information are found, and then only with the consent of the party concerned.[viii] The mechanism does have a systemic review function, and provides for consequences such as engaging in a dialogue with parties, providing them with assistance or recommending an action plan. There are other procedural provisions in the Paris Agreement to keep parties on track, such as an enhanced transparency mechanism to ensure that parties’ processes and targets are transparent.[ix] The transparency provisions are closely associated with the NDCs. For example, under the transparency provisions each party must identify indicators it has selected to track progress towards the implementation and achievement of its NDC.[x] A Global Stocktake also takes place every five years, interspersed between the NDC cycles. The first Global Stocktake will take place in 2023, and will assess the 2020 NDC cycle. The 2028 Global Stocktake will assess the 2025 NDC cycle, and so on. The 24th COP in Katowice provided more detailed rules on what the Global Stocktake will look like. In the future, it will be a combination of a series of synthesis reports, and a number of high-level technical dialogues examining the output of these reports. The second round of NDCs are due in 2020, but countries are already falling behind their existing NDC targets. The activities of some countries, such as Russia, Saudi Arabia and the United States, are ‘critically insufficient’, meaning they would lead to a 4°C+ world.[xi] Activities of the UK, EU, Canada, China and Australia are ‘insufficient’, leading to a 3°C+ world. A few parties such as Costa Rica, India, Ethiopia and The Philippines are on track, with 2°C compatible emissions trajectories. Due to increasing global emissions, emissions reductions will have to be steep in order to stay within the Paris Agreement’s global temperature goals. It is anticipated that emissions reductions of approximately 8% per year are required by every country until the end of the century. According to the withdrawal provisions of the Paris Agreement, the withdrawal of the United States will take effect on 4th November 2020, one day after the US Presidential elections. Should the government change, the United States could re-enter the Paris Agreement easily and relatively quickly. If it does not, the lack of global leadership on climate change by the US could become a drag on other parties’ climate actions and ambitions in the next decade. The 2020s will be a testing time for the Paris Agreement, and as Noah Sachs states, may lead to the Agreement’s breakdown (parties fall short of their commitments) or worse, its breakup as parties withdraw and the agreement collapsing.[1] The Paris Agreement was designed as a flexible yet durable global agreement for the coming decades, so it has no specified end date. It allows for and incentivizes increased ambition by its parties, yet does not legally require ambition as there was no political will at the time for such an agreement. The provisions of the Paris Agreement remain relevant, but always relied on domestic political will to be effective. As climate protests around the world gain pace, and extreme weather events continue to escalate in frequency and severity in the developed and developing world, the significant question remains whether that political will be forthcoming in a sufficient and timely enough fashion to avoid catastrophic climate change. Lisa Benjamin is an Assistant Professor at Lewis & Clark College of Law and a member of the UNFCCC Compliance Committee (Facilitative Branch). Her views do not necessarily reflect those of the UNFCCC Compliance Committee. [1] Noah Sachs, “The Paris Agreement in the 2020s: Breakdown or Breakup?” forthcoming, Environmental Law Quarterly 46(1) (2019).
[i] RB Jackson et al., “Persistent fossil fuel growth threatens the Paris Agreement and Planetary Health,” Environmental Research Letters , Vol 14(12) (2019): 1-7. [ii] Ibid. [iii] William J. Ripple et al., “World Scientists Warning of a Climate Emergency” BioScience, (2019): 1-5. [iv] Lisa Benjamin, Sara Seck and Meinhard Doelle, “Climate Change, Poverty and Human Rights: An Emergency Without Precedent” The Conversation (4th September 2019) https://theconversation.com/climate-change-poverty-and-human-rights-an-emergency-without-precedent-120396. [v] Article 2, UNFCCC, UNTS 1771. [vi] Ibid, Article 3(1). [vii] Lavanya Rajamani and Jutta Brunnée, “The Legality of Downgrading Nationally Determined Contributions under the Paris Agreement: Lessons from the US Disengagement” Journal of Environmental Law Vol 29 (2017): 537-551. [viii] FCCC/PA/CMA/2018/3/Add.2, Decision 20/CMA.1, paras 2 and 22(b). [ix] Paris Agreement, Article 13. [x] FCCC/CP/2018/L.23 para 65. [xi] See Carbon Action Tracker at https://climateactiontracker.org/countries/. Harriet Mercer, University of Oxford 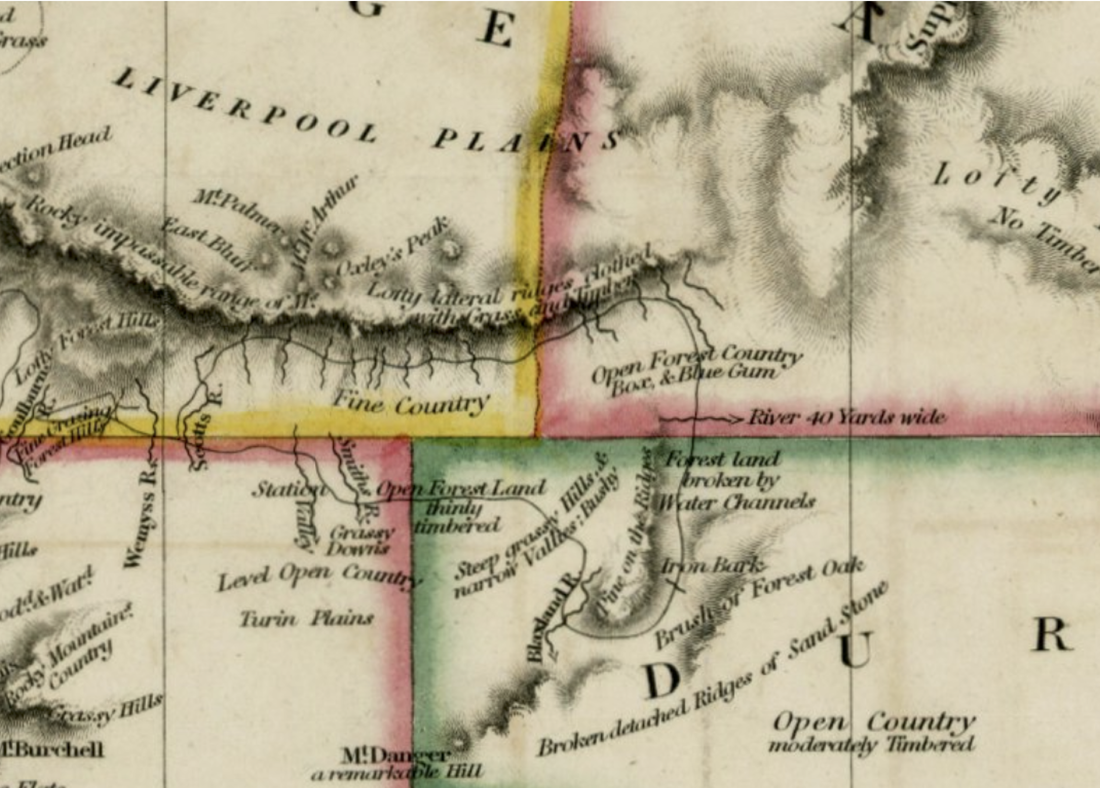 A section of a map of New South Wales based off the work of Oxley and King and showing how vegetation marks were written on to the maps. Joseph Cross, "Map of New South Wales, Embellished with Views of the Harbour of Port Jackson" (London: J. Cross, 1826) from the collections of the State Library of New South Wales. In early nineteenth century Australia, surveyors were given a near impossible task by colonial authorities. They were asked to use their expeditions to ascertain "the general nature of the climate, as to heat, cold, moisture, winds, rains, periodical seasons." [1] Meeting this directive was difficult because most surveyors did not spend more than a few days or weeks in a location that was otherwise unfamiliar to them. In these situations, precision instruments such as thermometers and barometers were of limited utility as they could only offer a reading at the time of visitation and not for any other time of year or for any other year when atmospheric conditions might be quite different. Plants provided one solution to the dilemma. In the opening decades of the nineteenth century, Aboriginal Australians helped surveyors to decipher some of the relationships between plants and atmosphere in Australia. This article shows how surveyors were taught that the distribution of certain tree species could help them understand the way rainfall patterns varied over space. It also shows how surveyors learnt to use the watermarks on trees and debris lodged in branches as indications of the way rainfall patterns varied over time. With the help of Aboriginal Australians, surveyors were practicing a sort of historical climatology. They were attempting to understand past atmospheric changes in a given area using indirect sources. Can the evidence contained in surveyors’ journals and maps help the historical climatologists and climate scientists of today? This article argues that they can. When Thomas Mitchell, the surveyor-general of New South Wales, was tasked with charting the two major inland river systems of Australia’s south east, his Wiradjuri guides helped him understand the association of particular plants with particular atmospheric and hydraulic conditions. Mitchell was taught that the yarra tree (known today as the river red-gum or eucalyptus camaldulensis) indicated the presence of a river or lake. Mitchell scanned the horizon for these tall trees when he wanted to locate a place of permanent waters: The yarra is certainly a pleasing object in various respects; its shining bark and lofty height inform the traveller of a distant probability of water […] and being visible over all other trees it usually marks the course of riverd so well that, in travelling along the Darling and Lachlan [rivers], I could with ease trace the general course of the river without approaching its banks. [2] Mitchell’s Wiradjuri guides showed him that the presence of goborro trees, by contrast, indicated a place of transient waters. Mitchell learnt that the goborro tree (most likely the plant known today as black box or Eucalyptus largiflorens) flourished on plains subject to temporary inundations rather than on the banks of more permanent waters. “These peculiarities,” Mitchell wrote, “we ascertained only after examining many a hopeless hollow where the goborro grew by itself; nor [sic] until I had found my sable guides eagerly scanning the yarra from afar when in search of water, and condemning any distant view of goborro trees as hopeless during that dry season.” [3] But the presence of particular trees did more than give surveyors an indication of how rain fell and flowed over space in inland Australia. Flood marks on trees such as the yarra also gave surveyors an indication of how much rainfall an area had received in the past. Some of Mitchell’s travels around Australia’s inland river systems were during the drier than average year of 1835, which meant that he did not see how the country looked when it was well-watered. [4] But Mitchell often used the water stains on river red gums and other trees to make judgements about the rainfall variability of an area. Near the inland Lachlan River, for example, he noticed “a tract extending southward from the river for about three miles, on which grew yarra trees bearing the marks of occasional floods to the height of a foot above the common surface.” [5] 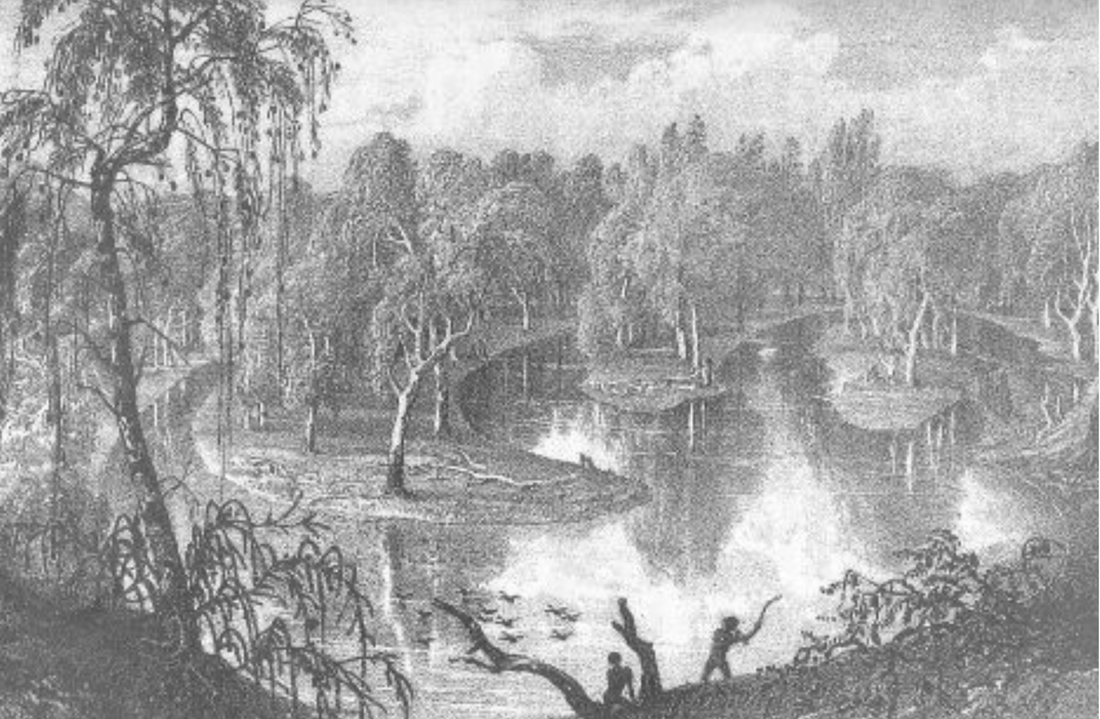 An illustration from Mitchell’s account of his 1836 expedition showing a ‘flood-branch of the Murray, with the scenery common on its bank’ including the yarra or river red gum tree. Thomas Mitchell, "Three Expeditions into the Interior of Eastern Australia; with descriptions of the recently explored region of Australia Felix, and of the present colony of New South Wales, Volume 2." Other surveyors working in Australia such as John Oxley and Charles Sturt also used the flood marks left on trees to understand the rainfall variability that a region could experience. Travelling through inland New South Wales northwest of Sydney in 1818, Oxley did not think that the Castlereagh River had been flooded for a long period because there were “no marks of wreck or rubbish on the trees or banks” of the river. [6] Cedar trees along the Hastings River further east, by contrast, bore “marks of flood exceeding twenty feet, but confined to the bed of the river.” [7] Travelling southwest of Sydney about ten years later, Charles Sturt reported “marks of recent flood on the trees, to the height of seven feet.” [8] Surveyors’ atmospheric observations were not, moreover, confined to their journals. They were also written on their maps of Australia. Sometimes, this data was indirectly transcribed and would only be decipherable when read together with the surveyors’ written accounts. Take the example of an 1826 map of New South Wales, which was based on the work of two surveyors. In addition to the names of settlements, rivers and mountains, the map had descriptions of prevailing plant life written on to its surface. [9] The presence of plants such as “box” (or goborro as Mitchell called it) on the map indicated that an area was subject to flood as this was the plant that liked to wet its feet in temporary inundations. More often, the atmospheric information plants provided was directly recorded on to surveyors’ maps. In 1822, for instance, Oxley produced a map which included the Lachlan River, a waterway he had visited five years earlier in 1817. By the sides of the River, Oxley wrote over the map “Low Marshy Country devoid of Hills and occasionally overflowed, perhaps to the extent of 30 miles on each side of the River.” Near other rivers on the map, Oxley also added earth-atmosphere descriptions such as “marks of the flood 30 feet above the present surface of the River’ and ‘Marks of the rise of the flood about 16 feet.” [10] Surveyors’ maps were, then, not just topographical representations of the country – they were also atmospheric representations. The atmospheric information contained in these maps and journals has been overlooked by historians and historical climatologists. This is in part because the maps and journals were created in a period when the use of precision instruments such as thermometers was becoming increasingly widespread and when methods for observing these instruments were being standardised. But as this article (and my doctorate research) shows, instruments were not always the preferred newcomer method for accessing information about the atmosphere. Whereas instruments offered surveyors isolated snapshots of the atmosphere, plants revealed annual and interannual trends. Like historical climatologists and paleoclimatologists today, nineteenth century surveyors yearned to know the atmospheric history of a place. This Australian case study suggests that there are at least three reasons why survey maps and journals deserve the attention of contemporary climate scientists. First, these sources could help historical climatologists overcome the bias toward reconstructing past temperatures over other atmospheric variables. “Most of the climate reconstructions over say the last 1000 years,” Brázdil et al. argued in 2005, "focus on temperature." [11] More recently, the editors of the 2018 Palgrave Handbook of Climate History have argued that precipitation is a "field of research calling for more effort by climate historians." [12] One of the reasons that past precipitation patterns have received less attention than past temperature patterns is because the latter tend to be better represented in the sources. Survey journals and maps can help address this bias in the sources. Second, these sources not only offer information on an under-represented atmospheric variable. They also offer information on under-represented regions. Often, when nineteenth century rain-gauge measurements were taken, they were recorded in urban centers and port cities. This is a problem because precipitation rates and patterns are “highly localized” phenomena. [13] The amount of rainfall one area received could be different for an area just a few kilometers away. Attaining more geographically dispersed precipitation information is therefore crucial to producing more accurate and geographically diverse reconstructions. Surveyors’ records offer information about precipitation patterns for areas where no rain-gauge records were kept in nineteenth-century Australia. 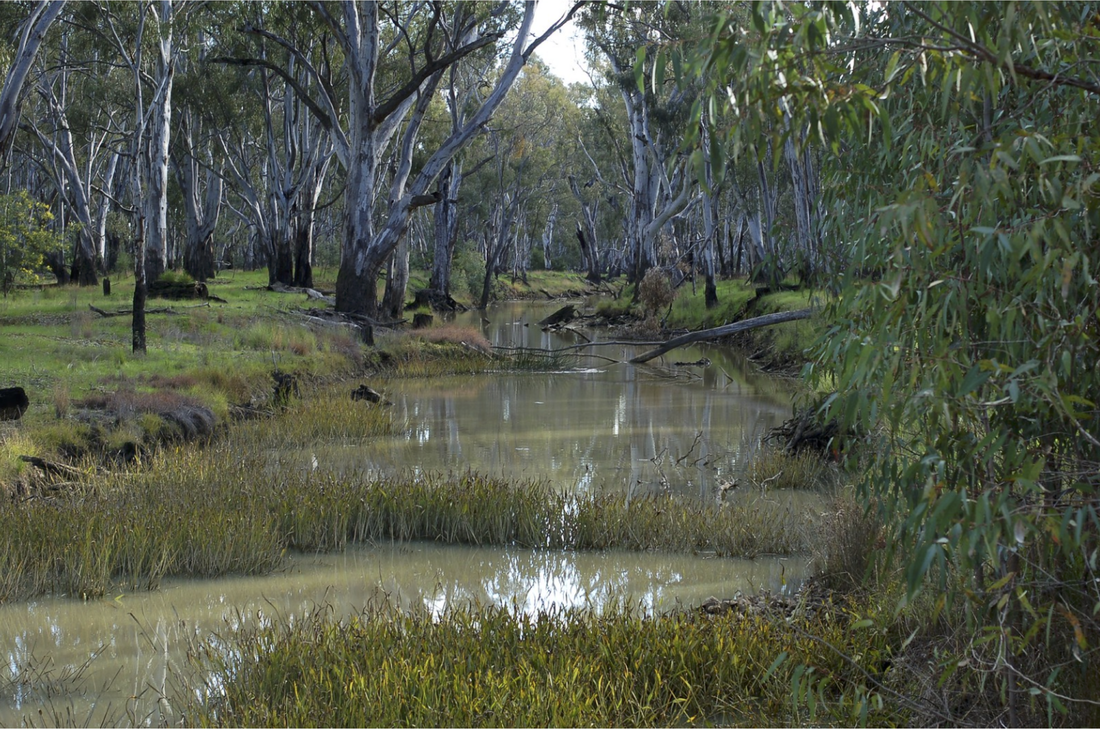 River red gums growing by the Murray River. Elizabeth Donoghue/Flickr, CC BY-NC-SA. Finally, survey maps and journals could provide scientists with information about how particular plants are responding to the earth’s changing atmosphere. The river red gums that are frequently mentioned in Mitchell’s journals have been the subject of recent research into the water needs of flood-plain trees. These trees, researchers have shown, are crucial to the health of flood-plain eco-systems: ‘Everything relies on the red gum to maintain health’. [14] Yet while it is well known that river red gums have adapted strategies for surviving long periods of drought, exactly how long these trees can go without water is less certain. Dr. Tanya Doody’s research, for example, indicates that in conditions of below average rainfall, the trees should not go more than seven years without being flooded. [15] The records of surveyors could offer an additional source of data for such important research projects. In the case of Australia, survey maps and journals are accessible sources. The journals referred to in this article are all digitized and available online without the need for payment or institutional affiliation. Public institutions such as the National Library of Australia and the State Library of New South Wales have also digitized numerous survey maps in high resolution, which allows researchers to zoom in on the atmospheric details that surveyors marked on their charts. Recognizing the valuable atmospheric data contained in these historical sources could prompt other institutions to digitize more survey journals and maps. Such a project promises to help climate scientists in their quest to reconstruct past climates in order to better understand future atmospheric changes and the effects of those changes on plant life and river systems. It also promises to illuminate the way past efforts to understand the atmospheric patterns in Australia were sometimes joint newcomer-Indigenous endeavors. Harriet Mercer is a PhD candidate in the Centre for Global History at the University of Oxford. She is writing a history of climate knowledge production in Australia in the nineteenth century, and exploring how the Anthropocene is changing the way historians write and research history. [1] See for example John Oxley, Journals of two expeditions into the interior of New South Wales undertaken by order of the British Government in the years 1817 – 1818, http://setis.library.usyd.edu.au/ozlit/pdf/p00066.pdf; Phillip Parker King, Narrative of a Survey of the Intertropical and Western Coasts of Australia Performed Between the Years 1818 and 1822, Volume 1, http://gutenberg.net.au/ebooks/e00027.html; Charles Sturt, Two Expeditions into the Interior of Southern Australia, during the years 1828, 1829, 1830, and 1831, http://www.gutenberg.org/files/4330/4330-h/4330-h.htm-
[2] Thomas Mitchell, Three Expeditions into the Interior of Eastern Australia; with descriptions of the recently explored region of Australia Felix, and of the present colony of New South Wales, Volume 2, http://gutenberg.net.au/ebooks/e00036.html. [3] Mitchell, Three Expeditions, Volume 2, http://gutenberg.net.au/ebooks/e00036.html. [4] Linden Ashcroft, Joëlle Gergis and David John Karoly, “A historical climate dataset for southeastern Australia, 1788 – 1859,” Geoscience Data vol. 1, no. 2 (2014) p. 172. [5] Mitchell, Three Expeditions, Volume 2, http://gutenberg.net.au/ebooks/e00036.html. [6] Oxley, Journals of two expeditions, http://setis.library.usyd.edu.au/ozlit/pdf/p00066.pdf. [7] Oxley, Journals of two expeditions, http://setis.library.usyd.edu.au/ozlit/pdf/p00066.pdf. [8] Sturt, Two Expeditions, http://www.gutenberg.org/files/4330/4330-h/4330-h.htm. [9] Joseph Cross, Map of New South Wales, Embellished with View of the Harbour of Port Jackson (London: J. Cross, 1826). [10] John Oxley, A Chart of the Interior of New South Wales (London: A. Arrowsmith, 1822). [11] Rudolf Bradzil et al. “Historical Climatology in Europe the State of the Art,” Climate Change vol. 3 (2012), pp. 386 – 387. [12] Christian Pfister et al. “General Introduction: Weather, Climate, and Human History,” in The Palgrave Handbook of Climate History eds. Christian Pfister, Sam White and Franz Mauelshagen (London: Palgrave Macmillan, 2018), p. 12. [13] Pfister et al. “General Introduction: Weather, Climate, and Human History,” p. 12. [14] Mary O’Callaghan, “The water needs of floodplain trees – the inside view,” ECOS, 9 April 2018, https://ecos.csiro.au/flood-plain-river-red-gums. [15] O’Callaghan, “The water needs of floodplain trees”. Remembering Disaster: How Qing Dynasty Records Reveal Connections Between Memory and Environment8/4/2019
Meghan Michel, Georgetown University 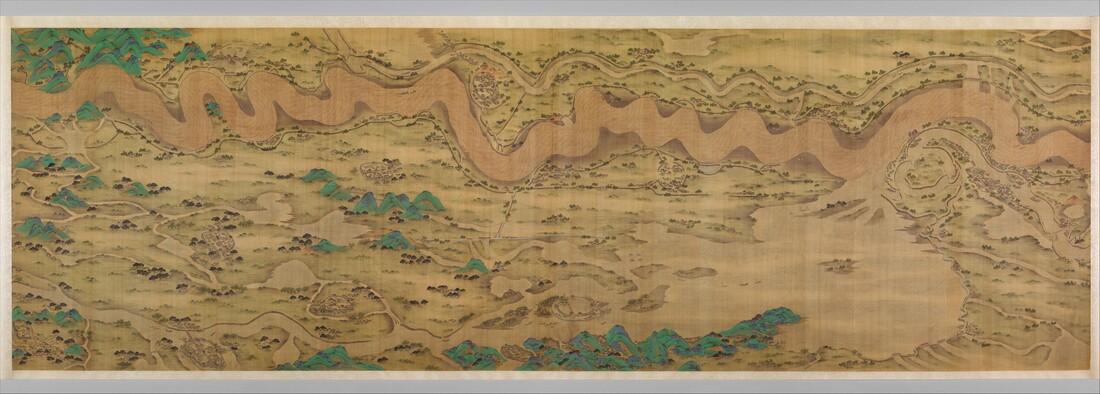 “Ten Thousand Miles Along the Yellow River,” Unidentified Chinese artist, datable to 1690-1722. Memory is one of the most powerful parts of the human psyche. It can help us make sense of the world around us, but it can also cloud our vision. Over long timeframes, memory can actually become embedded into a culture in ways that are difficult to comprehend. One of the complex effects of this sort of cultural memory may be the development of a culture of resilience in the face of extreme climatic events. Long-term environmental memories might help a community respond to otherwise destructive climate changes in a way that allows them to survive, recover, and sometimes even thrive. Given the increasing impact of extreme weather events due to anthropogenic climate change, it is uniquely important right now to understand how memory can contribute to creating a more resilient culture. In order to make sense of the connections between memory, culture, and climate, this article considers how memory might have played a role in the interpretation of extreme weather events in Qing dynasty China (1644–1912). A look at Qing dynasty records suggests that long-term environmental memory could indeed help cultivate a culture of resiliency, while at the same time skewing how accurate the perception of a disaster is. More than anything, this look into the potential roles of memory provides a new perspective with which to think about our current interpretation of environmental changes and cultural capacity for adaptation. Researchers generally agree that we actively use our memory when processing our surroundings, including weather.[1] Imagine you live in a town that has faced extreme flooding in recent years. When you experience a heavy rain, you will probably remember the floods. However, the exact way that we use memory to interpret the environment may not be so simple as providing the background with which we think about weather or climate change. In her work on biological control programs, scholar Karen Middleton describes a feedback loop by which present events reshape how the past is remembered at the same time as the interpretation of past events shapes the understanding of present conditions.[2] So just as memories of a disastrous flood would affect how villagers interpret a heavy rain in their present, if they are not currently experiencing flooding it could influence their memories of that past disaster. In our hypothetical water-logged village, perhaps the current rains are locally just as strong as the rains during a past flood. Yet because those rains are not accompanied by a flood, villagers might mistakenly remember the first flood as having more extreme rains. There is also some evidence that memory can contribute to long-term integration of climate awareness into human societies. Archaeologist Toby Pillat has offered the idea that daily interactions with weather can create cultural norms that dictate how future people might interact with their climate.[3] The cultural norms that Pillat refers to may even develop into a culture of resiliency, as described by environmental historian Adam Sundberg in his work on the infamous Christmas Flood of 1717. Sundberg describes a process of “disaster-induced learning,” in which repeated incidents of disaster lead to long-term “cultures of coping,” a gradualist theory that he reports as currently trending in the field of disaster history.[4] Occasionally, this sort of cultural learning about climate may take the form of a clearer understanding of weather events over time. For example, environmental historian Dagomar Degroot found that “the human consequences of the Little Ice Age…prompted Dutch citizens to think comparatively and accurately about weather across long timeframes.”[5] Yet long-term environmental learning may also lead to a skewed perception of climatic events due to increased societal preparedness. In his study of lower Austrian floods in 1572-3, scholar Christian Rohr makes the argument that “due to the preparedness of the population, most of the floods were not perceived as disasters.”[6] While in some cases, memory might lead to more accurate interpretations of climate, in others its concrete effects in establishing adaptive cultures may have the opposite impact – which in turn could influence the long-term understanding of climate in a society.  The North China Plain includes the lower Yellow River and its tributaries. Alanmak Alan Mak, Wikipedia. So how might memory have played a role in Qing dynasty cultural understandings of, and responses to, climate change? To answer this question, we will look at the North China Plain (NCP). The NCP is defined here as the modern-day provinces of Beijing, Tianjin, Hebei, Shandong, Henan, Anhui, and Jiangsu. Such a wide definition of the area is useful in that it allows for more data, and therefore clearer identification of patterns; it is reasonable, in that precipitation extremes across the NCP are fairly standard. The Qing dynasty was not only a time of distinct dynastic change in China, but it was also a part of an era of occasionally global climate change that is often termed the Little Ice Age (LIA). The LIA is generally understood to be a period of cooling that in many places reached its coldest phase between the fifteenth and eighteenth centuries.[7] While there was a broad global trend of cooling, the LIA had different effects across different areas over variable time scales. In China, the LIA can be split into three stages: a cool, dry early period, a warm, dry middle period, and a wet, cold late period.[8] These changes are thought to be related to changes in both East Asian Summer Monsoons (EASM), and the El Niño-Southern Oscillation (ENSO) cycle. [9] The NCP in particular experiences highly variable precipitation patterns due to the strong effect of the EASM in the region. [10] Across the Qing dynasty, the region suffered many environmental disasters, including extreme floods and droughts. During the Qing dynasty, gazetteers called fangzhi 方志 were systematically written every day. Official chronicles were mandated by the government; many more local gazetteers were kept by various scholars or officials, and organized by government historians over the course of the Qing dynasty. These primary source texts contain detailed information about the weather. Because they were written systematically, whether or not a chronicle mentions a disaster, like the floods and droughts we will examine here, is more likely to be a result of the recorder’s interpretation of the weather than, for example, the recorder’s desire or freedom to write. Therefore, a comparison of how often a disaster was documented with the actual occurrence of extreme events can be used as a way to guess at the role of memory and culture in the interpretation of weather. The recently published Reconstructed East Asian Climate Historical Encoded Series (REACHES) database uses the fangzhi to create data points that represent weather events, allowing us to build a timeline for how often a drought or flood disaster was recorded throughout the Qing dynasty. In order to create a timeline for when droughts and floods actually occurred during the Qing dynasty in the NCP, we can look at the reconstruction of extreme weather events from the work of a team of Chinese geographers led by Zheng Jingyun. Zheng and his co-authors have used a wide range of primary text sources, then verified the information in them with weather measurements compiled using scientific instruments. They also used statistical analysis to account for the fact that the number of textual sources increases over time, due to the higher likelihood that more recent records could be preserved. While it would be ideal to have more scientific data to create our timeline, such as information from tree rings or pollen records, the reality is that most climate history for this region and time relies on historic archives, probably due to the abundance of primary source texts from China. The methods used by Zheng and his team make their results some of the best currently available, and most useful for this comparison. They look specifically at extreme droughts and floods, which they define as periods lasting more than three years that have an amount of rain more than one and half times greater or lower than about the average precipitation level. The fact that they look at both severity and time scale means that when they note the occurrence of disaster, there should theoretically be fangzhi records for that disaster from across the NCP. Building these parallel timelines of documentation and occurrence for both droughts and floods reveals curious correlations and discrepancies. First, the highest numbers of fangzhi records of flood and drought do not always correlate with the frequency and severity of disasters. For example, two of the most extreme events identified by Zheng and his co-authors in the NCP were a decade-long drought that took place from 1634 to 1644, and another calamitous drought from 1719 to 1723.[11] Yet there are several points in our timeline of documentation where the amount of drought records is higher than in those years of especially extreme drought. While the frequency of fangzhi flood documentation lines up a little bit better with the occurrence of extreme floods, there are still moments where we see a higher amount of flood records in years when extreme flooding did not occur. Disaster records therefore often did not grow more common during, or even immediately after, many of the worst disasters. Usually the quantity of fangzhi records only surged over a decade after a disaster. In fact, years immediately following extreme weather events generally had fewer records of disaster. These patterns may suggest that when a disaster was ongoing, it was harder to keep records like local fangzhi as people struggled to survive and rebuild. They could also indicate that in the short term, the memory of a disaster helped give a more realistic sense of what constituted that sort of event, and led to more accurate reporting. However, over time, this accuracy of memory may have faded, and instead cultural memory could have encouraged a heightened sensitivity towards recording disaster. Left: Reconstruction of frequency of fangzhi drought records frequency from 1645-1795, overlaid in orange with extreme drought events from Zheng et al. in 1634 – 1644 and 1719 – 1723. Right: Reconstruction of frequency of fangzhi flood records from 1646-1806, overlaid in orange with extreme flood events from Zheng et al. in 1650-60, 1730, and 1750-60. Looking more broadly, it seems that there is overall more documentation of disaster earlier in Qing history. For both droughts and floods, moving forward in time there is a moderate trend from more to fewer fangzhi records of either type of extreme event. Moreover, the amount of variation in disaster documentation frequency from year to year appears to be higher earlier in history. There also seems to be a slight trend over time towards more stability in the amount of records of both floods and droughts. These wide patterns of decreasing records and increasing stability of documentation frequency may suggest more or less long-term accuracy in memory of disaster severity, depending on whether you emphasize periods of extreme events or of non-disaster. This might also point to the development of a culture of resiliency. If the people of the NCP were better equipped to deal with these types of events over time, they might not be so inclined to interpret the weather as a disaster, even in cases when it was as extreme as in previous decades. It is clear that there is no simple relationship between memory and environmental disasters. It should also be noted that these potential patterns and connections are based on a simple visual comparison of timelines. However, the lack of precision here speaks to the fact that this area holds much potential for future research. In particular, Chinese climate history scholarship thus far has often focused on using statistical significance testing to propose correlative relationships between environmental changes and societal reactions. [12] This sort of quantitative research is an ideal starting point for exploring more nuanced aspects of environmental history. It allows for engagement with unique scholarship, like the ideas about memory explored here, and in this case, offers diverse new perspectives on the possible links between culture and environmental extremes. This study reveals that memory could be a powerful part of how we respond to environmental changes. At the same time as memory may help develop an adaptive culture, accurate judgement of the seriousness of a disaster might be clouded. As we enter an era of increased extreme weather events, it is important to consider whether our interpretations of disaster are accurate. Moreover, while long-term memory has potentially contributed to climate change resilience in our cultures, our current adaptations may not be enough to deal with the disasters of the future. We might also examine how the gradual nature of the current rise in disaster severity may influence both our cultural adaptations and misunderstandings of memory. As the consequences of anthropogenic climate change become more pronounced, it is crucial that we look to the past for new ideas about the relationship between culture and environment, including the complex effects of memory. [1] See Toby Pillatt, “Experiencing Climate: Finding Weather in Eighteenth Century Cumbria,” Journal of Archaeological Method and Theory 19:4 (December 2012): 564–81; A. Hall, and G. Endfield, 2016: “Snow Scenes: Exploring the Role of Memory and Place in Commemorating Extreme Winters,” Wea. Climate Soc., 8:5–19; or Dagomar Degroot, The Frigid Golden Age: Climate Change, the Little Ice Age, and the Dutch Republic, 1560–1720 (New York: Cambridge University Press, 2018), 262. [2] Karen Middleton, "Renarrating a Biological Invasion: Historical Memory, Local Communities and Ecologists," Environment and History 18:1 (2012): 61-95. [3] Pillatt, “Experiencing Climate.” [4] Adam Sundberg, “Claiming the Past: History, Memory, and Innovation Following the Christmas Flood of 1717,” Environmental History 20:2 (April 2015): 238–61. [5] Degroot, The Frigid Golden Age, 262. [6] Christian Rohr, "Floods of the Upper Danube River and Its Tributaries and Their Impact on Urban Economies (c. 1350-1600): The Examples of the Towns of Krems/Stein and Wels (Austria)," Environment and History 19:2 (2013): 148. [7] Dagomar Degroot, “Climate Change and Society from the Fifteenth Through the Eighteenth Centuries,” WIREs Climate Change Advanced Review, 2018, doi:10.1002/wcc.518, 1. [8] Anning Cui, Chunmei Ma, Lin Zhao, Lingyu Tang, and Yulian Jia, Pollen Records of the Little Ice Age Humidity Flip in the Middle Yangtze River Catchment, Vol. 193 2018, doi://doi.org/10.1016/j.quascirev.2018.06.015. [9] Cui et al., Pollen Records. [10] J. Zheng, W. C. Wang, Q. Ge, Z. Man, and P. Zhang, Precipitation variability and extreme events in eastern China during the past 1500 years Terr. Atmos. Ocean. Sci., 17, 2006, 580. [11] Zheng et al., Precipitation variability and extreme events, 588. [12] This understanding of the broader field is mostly informed by Dr. Dagomar Degroot. For a good example of this sort of statistical correlative work, see David Zhang, David D., Harry F. Lee, Cong Wang, Baosheng Li, Qing Pei, Jane Zhang, and Yulun An. “The causality analysis of climate change and large-scale human crisis.” Proceedings of the National Academy of Sciences (2011): 201104268. Works Cited:
Andrew Salvador Mathews. "Suppressing Fire and Memory: Environmental Degradation and Political Restoration in the Sierra Juárez of Oaxaca, 1887-2001." Environmental History 8:1 (2003): 77-108. Brook, Timothy. The Troubled Empire: China in the Yuan and Ming Dynasties. Cambridge, USA: Harvard University Press, 2010. Cui, Anning, Chunmei Ma, Lin Zhao, Lingyu Tang, and Yulian Jia. "Pollen Records of the Little Ice Age Humidity Flip in the Middle Yangtze River Catchment." Quaternary Science Reviews 193 (2018): 43-53. Degroot, Dagomar. “Climate Change and Society from the Fifteenth Through the Eighteenth Centuries.” WIREs Climate Change Advanced Review, 2018. Degroot, Dagomar. The Frigid Golden Age: Climate Change, the Little Ice Age, and the Dutch Republic, 1560–1720. New York: Cambridge University Press, 2018. Fang, XiuQi, Xiao, LingBo, and Wei, ZhuDeng. “Social Impacts of the Climatic Shift Around the Turn of the 19th Century on the North China Plain.” Science China Earth Sciences 56:6 (2013): 1044–58. Forgas, Joseph P., Liz Goldenberg, and Christian Unkelbach. 2009. Can Bad Weather Improve Your Memory? an Unobtrusive Field Study of Natural Mood Effects on Real-Life Memory. Vol. 45. Guy, R. Kent. Qing Governors and Their Provinces: the Evolution of Territorial Administration in China, 1644-1796. Seattle: University of Washington Press, 2010. Hall, A. and G. Endfield, “Snow Scenes”: Exploring the Role of Memory and Place in Commemorating Extreme Winters. Wea. Climate Soc. 8 (2016): 5–19. Hao, Zhixin, Yingzhuo Yu, Quansheng Ge, and Jingyun Zheng. “Reconstruction of High resolution Climate Data over China from Rainfall and Snowfall Records in the Qing Dynasty.” WIREs: Climate Change 9 (3) (2018): e517. Koselleck, Reinhart. Futures Past: On the Semantics of Historical Time. Cambridge, Mass: MIT Press, 1985. Kwiatkowski, Teresa, and Alan Holland. "Dark Is the World to Thee: A Historical Perspective on Environmental Forewarnings." Environment and History 16:4 (2010): 455-82. Li, S., He, F. & Zhang, X., "A spatially explicit reconstruction of cropland cover in China from 1661 to 1996." Reg Environ Change 16:2 (2016): 417-428. Middleton, Karen. "Renarrating a Biological Invasion: Historical Memory, Local Communities and Ecologists." Environment and History 18:1 (2012): 61-95. Pillatt, Toby. “Experiencing Climate: Finding Weather in Eighteenth Century Cumbria.” Journal of Archaeological Method and Theory 19:4 (December 2012): 564–81. Rohr, Christian. "Floods of the Upper Danube River and Its Tributaries and Their Impact on Urban Economies (c. 1350-1600): The Examples of the Towns of Krems/Stein and Wels (Austria)." Environment and History 19:2 (2013): 133-48. Rohr, Christian. "Man and Natural Disaster in the Late Middle Ages: The Earthquake in Carinthia and Northern Italy on 25 January 1348 and Its Perception." Environment and History 9:2 (2003): 127-49. Shuoben Bi, Shengjie Bi, Changchun Chen, Athanase Nkunzimana, Yanping Li, and Weiting Wu. “Spatial Characteristics Analysis of Drought Disasters in North China during the Ming and Qing Dynasties.” Natural Hazards & Earth System Sciences Discussions 2016, 1–13. Sundberg, Adam. “Claiming the Past: History, Memory, and Innovation Following the Christmas Flood of 1717.” Environmental History 20:2 (April 2015): 238–61. Wang, P. K. et al. Construction of the REACHES climate database based on historical documents of China. Sci. Data. 5:180288. Zheng, J., W. C. Wang, Q. Ge, Z. Man, and P. Zhang, 2006: Precipitation variability and extreme events in eastern China during the past 1500 years. Terr. Atmos. Ocean. Sci., 17, 579- 592. Prof. Anya Zilberstein, Concordia University.  "Swarm of birds" by Per Gosche, licensed under CC BY 2.0. On May 11, birders in 130 countries took part in World Migratory Bird Day (WMBD). This citizen science and conservation project enrolls professional and amateur ornithologists twice a year—in May and October—to record sightings of hundreds of species during their spring and fall passages through continental and hemispheric regions, or so-called flyways, across Africa, Europe, Asia, the Americas, and Australasia. WMBD was first organized in 2006 only in part as a way to recruit people to collect more data points. Its purpose is also to convey the urgency of the climate crisis for migratory animals by publicizing how profoundly avian populations, the geography of their flyways, and the timing of their movements have been affected by a host of modern ecological pressures resulting from human activity, including climate change. (Every year WMBD focuses on a different threat, which, for the second annual event in 2007, was “Migratory Birds in a Changing Climate.”) [1] What’s sometimes lost in such initiatives, however, is their considerable history. As I’m discovering in one of my current research projects called “Flight Paths for Birds and other Migrants,” which focuses on theories of migration developed in the 17th and 18th centuries, many of the questions that inform activities like WMBD—even questions about anthropogenic forces—emerged much, much earlier than is usually acknowledged. Participants in WMBD continue a very long line of bird observers who have generated crowd-sourced data to learn more about the behavior of migratory species. Collectively, this constitutes a global, however uneven, record of avian, insect, and other animal movements amassed over centuries. The ancient reliance on birds for a variety of cultural, spiritual, and utilitarian purposes all over the world, informed indigenous knowledge about where and when some itinerant species would normally arrive in a particular place. The earliest avowedly scientific attempts to grasp the geographical and temporal scale of these cyclical movements—including the possible effect of weather and climate on them—date to at least the late 17th century, when individuals increasingly began to keep records of arrival and departure dates. Most historians of ornithology as an empirical science focus on the Victorian period after the development of evolutionary biology, but pre-Darwinian ideas about avian migration recognized, albeit implicitly and without the statistical precision, that 60% of species are migratory (and that many or most other birds may have been migratory millennia ago). Early naturalists, from Cotton Mather to Gilbert White and John James Audubon, were fascinated by what they called ‘birds of passage,’ especially the capacity to dwell in a range of aquatic, aerial, and terrestrial environments and to regularly relocate between different hemispheres in groups. And their attention to these peculiar traits also spurred them to speculate about migratory birds’ susceptibility to change, including changes in their seasonal habitats caused by human societies, such as colonization, the expansion of farmland, and the growth of towns. Their early documents could provide both temporal depth and unique insights into the natural history of climate and migration, particularly for conservationists interested in adaptations to environmental changes in the 20th and 21st centuries. This is especially so because many aspects of migratory patterns—their origins, geography, seasonality, and changes over time—have remained mysterious to scientists, even now.  The Arctic Tern, a migratory species from John James Audubon, Birds of America. When the biologist Frederick Lincoln coined the term flyway in 1935, he meant it to describe migratory birds’ “ancestral routes”—what were then thought to be the typical extent of the vast ranges and diverse environments they inhabited during different times of the year. Specifying the geography of these migratory corridors would, in turn, assist in ambitious banding projects and the creation of wildlife refuges. [2] Since then, increasingly sophisticated surveillance technologies have been developed to understand how much the boundaries of flyways and periodicity of biannual movements may have actually shifted over time, both in the deep evolutionary past as well as in the present. Yet if it’s clear that rising temperatures, coastal erosion, light and air pollution, urbanization, deforestation, and predation affect migratory bird populations, like much else about our knowledge of their biology, it remains unclear exactly how or how permanently ongoing climate change might shift particular species’ range boundaries, breeding or feeding grounds, and arrival or departure dates. To take just one of numerous examples, in 2010 ecologists in the Netherlands relying on 20 years of trend data gathered by “many thousands of volunteer birdwatchers across Europe” found strong evidence predicting that the continuation of earlier spring thaws and a longer season of heat waves on the continent will likely make climate change an underlying cause of population decline among long-distance migrants like pied flycatchers. Yet five years later, another study with similar parameters and common co-authors concluded that such predictions were less reliable than they’d hoped. “Contrary to expectations,” the patterns they observed between 2004 and 2014 were inconsistent with those from the 1984-2004, leading to equivocal results. [3] It’s not only that as research proceeds some findings about the relationship between climate change and avian migration appear contradictory; it is also that, especially as the current climate crisis grows, the dynamic differs significantly by species, region, and time frame. The history of ornithology can’t help to absolutely resolve these variances: the science of animal migration—like all scientific knowledge—will necessarily be susceptible to revision. But studying historical sources could encourage conservationists to recognize that anthropogenic climate change is only the most recent, if perhaps the most drastic, example of how the lives of non-human animals have long been observed and shaped, for better or worse, by people. Anya Zilberstein is associate professor of history at Concordia University. She is the author of A Temperate Empire: Making Climate Change in Early America (Oxford University Press, 2016), and she is currently working on a new project, "Fodder for Empire: Feeding People Like Other Animals," which examines the history of experiments in producing and distributing non-perishable, high-calorie, low-cost food for animals and people in the British Empire. Special thanks to Jesse Coady for research assistance. [1] <http://www.worldmigratorybirdday.org/about/wmbd-themes-since-2006 >
[2] Frederick C. Lincoln, The Waterfowl Flyways of North America (Washington, DC: US Department of Agriculture, 1935), 3. [3] Christiaan Both, Sandra Bouwhuis, C. M. Lessells, and Marcel E. Visser, “Climate change and population declines in a long-distance migratory bird,” Nature 441, no. 7089 (2006): 81; Christiaan Both, Chris AM Van Turnhout, Rob G. Bijlsma, Henk Siepel, Arco J. Van Strien, and Ruud PB Foppen, “Avian population consequences of climate change are most severe for long-distance migrants in seasonal habitats,” Proceedings of the Royal Society B: Biological Sciences 277, no. 1685 (2010): 1259-1266; Marcel E. Visser, Phillip Gienapp, Arild Husby, Michael Morrisey, Iván de la Hera, Francisco Pulido, Christiaan Both, “Effects of Spring Temperatures on the Strength of Selection on Timing of Reproduction in a Long-Distance Migratory Bird,” PLOS Biology 13, no. 4 (2015), e1002120; https://doi.org/10.1371/journal.pbio.1002120. |
Archives
March 2022
Categories
All
|
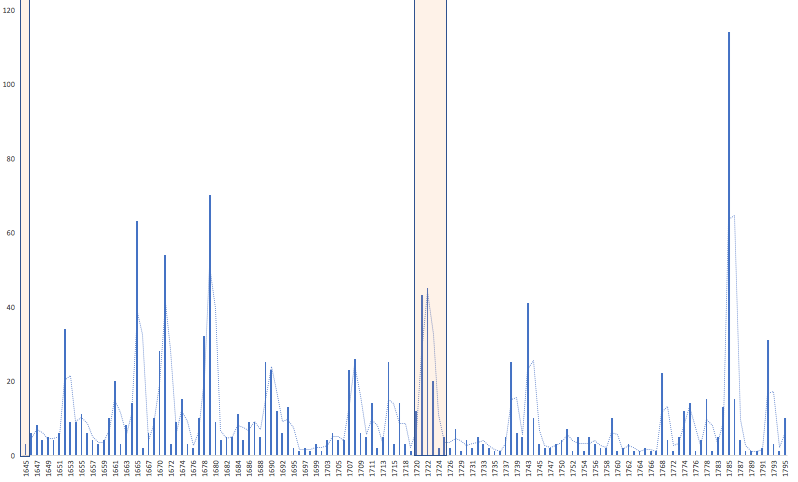
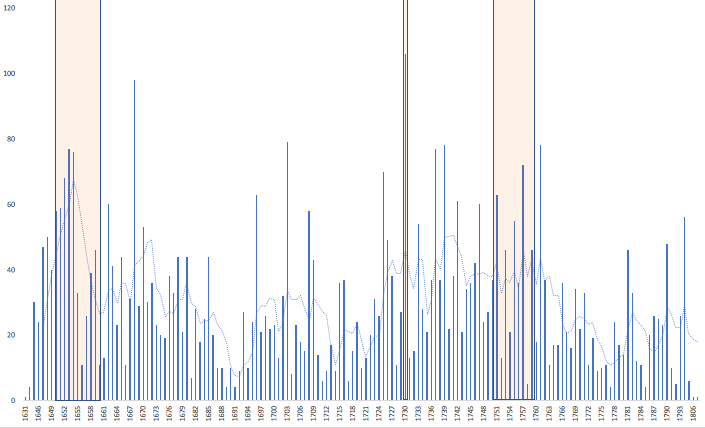
 RSS Feed