|
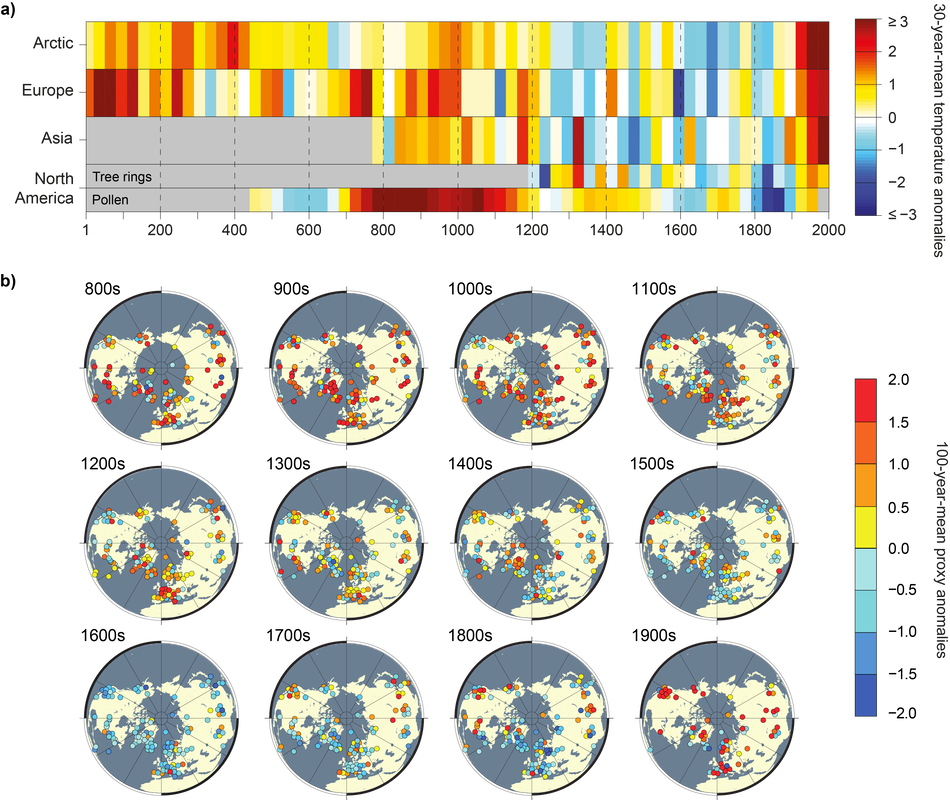
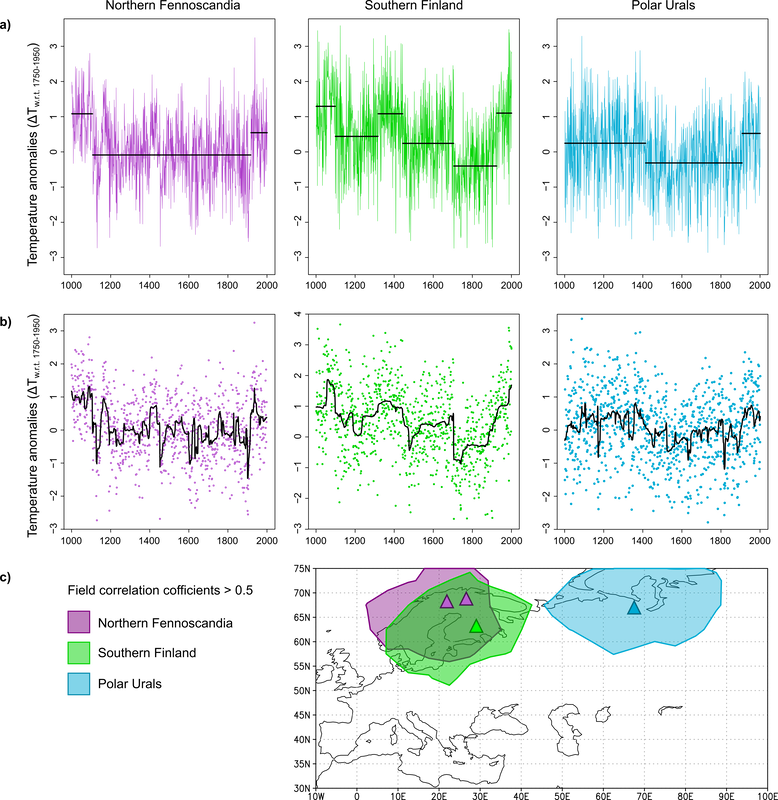
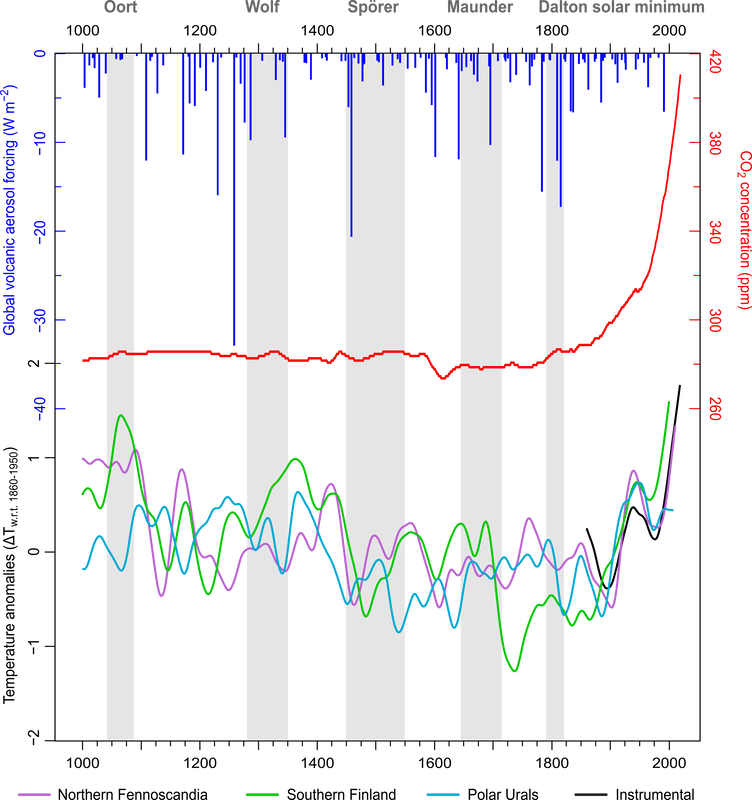
Dr. Heli Huhtamaa, University of Bern The Little Ice Age (LIA), a climatic phase that overlapped with the late-medieval and early modern periods, increasingly interests historians - academic and popular alike. Recently, they have tied the LIA to the outbreak of wars, famines, economic depressions and overall troublesome times. Not only a handful of climate historians are using the term anymore. These days, perhaps due to the overall increasing climate awareness, the period pops up in history-related print media, teaching, online blogs, and – of course – in academic research, among other places. As the LIA is the last distinctive climatic regime before the contemporary anthropogenic climate change, it can provide important analogues to better understand climate-society relationships on various temporal scales – from the direct consequences of short-term extreme events to multi-centennial dynamics of climate resilience. The term "Little Ice Age" was presumably introduced by François E. Matthes in 1939 when he chronicled the advance and retreat of glacier over the past 4000 years across the present-day United States [1]. Since the late 20th century, hundreds (if not thousands) of paleoclimate reconstructions and models have shed further light on the LIA, and the term has been widely accepted to indicate multi-centennial cooler phase occurring in the Northern Hemisphere during the second millennium CE. However, there the agreement over the universal characteristics of the LIA ends. Even a brief reading of the scientific literature on the topic reveals that there are remarkably differing views on the magnitude of the temperature depression, the spatial extent, as well as the onset and termination of the LIA. Within the discipline of history, economic historians Morgan Kelly and Cormac Ó Gráda authored perhaps the best-known publication that highlights the uncertainties related to the magnitude and dating of the event [2]. They have also used change-point analysis to argue that there is no evidence for any statistically significant change in the mean or variance of European temperatures that could be associated with an onset of the LIA [3]. Furthermore, a recent scientific study demonstrated that is it impossible to assign globally coherent dates for the coldest phases of the LIA [4]. Considering the uncertainties related to its periodization, is it appropriate for historians to keep on using the term LIA? In this article, I will argue that it is. However, this requires us to have some basic knowledge about the materials and methods used to detect past climate variability, as well as an understanding of the dynamical drivers of the LIA. My aim here is not to analyse systematically all available climate reconstruction data in relation to the LIA. Instead, I will explain what requirements reconstructions must meet to detect climatic change with statistical analysis, and then present a couple relevant examples. Neither will I revisit earlier criticisms of the LIA concept [2], as these have been addressed elsewhere by historians and scientists [5, 6]. Above all, I hope to reveal why the science of the LIA gives us such a complex image of the period and why this is – in fact – not at all a serious problem for historians. Detecting the onset of the LIA Scientists started to measure weather with instruments only in the 18th and 19th centuries. For periods further back in time, we can reconstruct past climate variability from climate proxies. Proxies are indirect climate data, materials which have been influenced by climate of the time when they were laid or written down, formed, or grown. Proxies are found either in the “archives of nature,” like in tree rings, ice layers or sediment varves, or in the “archives of societies.” For example, administrative sources, chronicles and private diaries may contain descriptions of weather and records of climate-sensitive activities, like harvest onset or river ice break-up dates. The later archive type, the written documents, holds climatic and meteorological information particularly relevant to human history [7]. The PAGES (Past Global Changes, an international association that bridges paleoclimatologists across the globe) 2k Consortium reconstructions indicate that mean temperatures in the Arctic, Europe and Asia were colder in the 13th and 14th centuries CE than in the previous centuries [8]. These multidecadal cooler anomalies may mark the possible onset period of the LIA (Figure 1a). Likewise, numerous individual climate proxy records show in increasing numbers signs of cooling temperatures from the 1300s and 1400s onwards across the Northern Hemisphere (Figure 1b). Thus, if we aim to identify LIA cooling statistically in individual temperature reconstruction data, our time-series should reach beyond the 13th century. This wide temporal scale, however, poses a challenge: where can we find data that goes back so far?  FIGURE 1. a) 30-year-mean standardized (1190–1970) temperatures for the four Northern Hemisphere PAGES 2k regions [8]. b) Northern Hemisphere standardized (1000–1900) centennial temperature proxy anomalies from various type of data material (ice-cores, lake and ocean sediments, speleothems, tree-rings and written documents) [9]. From written sources, climate variability is commonly reconstructed with one of the two standard methods: with the calibration-verification procedure or with the index approach [10, 11]. Calibration-verification procedure first translates time-series of climate-sensitive information (like harvest dates from written sources) into meteorological units (such as degrees Celsius) by calibrating the historical data to overlapping period of measured meteorological data. This statistical relationship is then verified with an independent period of overlapping meteorological data [10]. The index approach, on the other hand, first analyses historical climatic information qualitatively and then gives an ordinal-scale value for each datapoint, e.g. from -3 indicating extremely cold to +3 extremely warm [10]. The former method is better suited to detect so-called low-frequency variability (slow and gradual changes like the LIA), whereas the latter identifies primarily year-to-year variability (see Figure 2). For Europe, for example, there is no documentary-based temperature series which would cover the whole last millennium and which would be reconstructed with the calibration-verification procedure. This is because the climate data from European antique and medieval sources are too diverse and inconsistent to use this method to transform the materials into reconstructions [10]. Therefore, the reconstructions that extend prior 1500 CE are usually compiled with the index method. Unfortunately, climate reconstructions made from documentary data with this method are not well-suited to detect the LIA change, as these are known to poorly indicate low-frequency variability [10]. At first sight, one exception to the absence of calibration-verification reconstructions extending further back in time appears to be the Netherlands winter and summer temperature reconstruction by A. F. V. van Engelen and others [12]. However, these reconstructions also pose a challenge if we wish to statistically identify change happening over the 13th or 14th centuries because even visual inspection of the series reveal that the early section of the reconstruction appears to be based on ordinal indices. For example, the summer temperature series vary between only seven values before the 14th century (Figure 2). Even these reconstructions are therefore not well-suited to reveal the onset of the LIA, as there is a danger that change detectable with statistical analysis would indicate the change in the reconstruction materials and methods used, not the change in temperatures.  FIGURE 2. Netherlands December–February (left) and June–August (right) temperature reconstructions [12]. Note the change in the reconstructed values taking place over c. 14th century. The earlier part of the reconstruction resembles visually an index-based reconstruction and the latter calibration-verification one. Because of the lack of adequate document-based climate reconstructions covering the whole past millennium, the onset of the LIA needs to be detected from reconstructions compiled using natural proxy data. Yet, these reconstructions give markedly varying periodisation for the LIA. This is partly because different climate proxies, such as tree-ring width or isotopic concentrations in ice-core data, have different “response windows.” This means that different data from different locations are sensitive to different meteorological parameters (such as temperature or precipitation) over different timescales (from months to decades). Raw proxy data therefore portray a rather heterogeneous image of temperature variability over the past 1000 years (Figure 1b). Furthermore, non-climatic factors also influence the measured proxies, and sometimes it is difficult to distinguish heterogeneity that registers climate and weather from heterogeneity that simply reflects noise. Because proxy data are sensitive to past climate variability only in certain locations over certain seasons, and with imperfect accuracy, we have just a partial view of what has happened to climate prior to systematic meteorological measurements began. However, the differing response windows of different proxy data do not entirely explain our heterogeneous image of the LIA, as reconstructions made from same material type can be in interannual to multidecadal disagreement over past temperature variability. For example, when detecting change from mean warm season temperatures in northern Eurasia, three tree-ring density-based reconstructions suggest different dates for the onset of the LIA (Figure 3).  FIGURE 3. Changepoint analysis for three northern Eurasian tree-ring density-based warm season temperature reconstructions [13]. a) Changepoints in mean for three warm season temperature reconstructions in 1000-2000 CE detected with a Binary Segmentation method with a minimum segment length of 30 years [14]. b) The same trends are detectable in the posterior means (black lines) when the data are analysed with Bayesian changepoint procedure [15]. c) The reconstructions’ approximate sampling sites (triangles) and spatial domains (shading – the areas where the correlation coefficients (Pearson’s r) between the reconstructions and measured warm season temperatures are > 0.5 over the period 1850–2000) [16]. Still, most temperature reconstructions from the Northern Hemisphere identify a significant change to cooler mean temperatures, as in the examples presented in Figure 3. All indicate that the change to cooler climate took place well before the 1500s. Thus, the lack of detectable LIA change in previous analyses [3] may simply reflect the relative brevity of the time-series used. The main trigger of the LIA? The heterogenous spatiotemporal characteristics of the LIA can be primarily explained by the probable trigger of the climatic phase: volcanic aerosol forcing [17]. Large volcanic eruptions can inject sulphur compounds far into the stratosphere, where they are oxidized and become aerosols that absorb and scatter incoming solar radiation. The stratosphere warms but less radiation reaches the ground, cooling Earth’s surface. Many paleoscientists attribute multi-decadal temperature variability prior to anthropogenic warming – including the onset of the coldest phases of the LIA - to volcanic aerosol forcing [17, 18]. One common criticism of the LIA as a concept is that current climate change is not comparable to the LIA. Indeed, the LIA and anthropogenic warming are not comparable climatic phases in terms of the extent or magnitude of the change, partly due to the different drivers of these changes. Whereas the LIA was to a great degree triggered by volcanic forcing, the current climatic change is caused by rising atmospheric greenhouse gas concentrations (Figure 4). The climatic impact of these two forcing mechanisms differs considerably, so that while the onset of the LIA varies between reconstructions, the shift to a warmer climate is identifiable in a rather small temporal window (1900s–1920s, see Figure 3a) [19]. Furthermore, whereas long-term variations in temperature differ considerably prior to industrialization, all climate reconstructions presented here indicate similar long-term trends over the past 150 years (Figure 4). Moreover, volcanic aerosol forcing has both direct and indirect impacts on Earth’s climate. Its direct impacts refer to the mechanisms described above. Its indirect impacts are still not fully understood, but these likely contribute to the spatiotemporal heterogeneity of its climatic impacts. First, the eruption-related cooling is not globally uniform as, for example, oceans cool slower than land. Second, feedback mechanisms can prolong and intensify eruption-related cooling in some areas.
One such feedback mechanism is called ice-albedo feedback. Whereas open waters and dark forests absorb a lot of solar radiation and so warm Earth’s surface, white ice and snow reflect far more incoming solar radiation back into space, cooling the surface. During periods of increased volcanic forcing, the extent and duration of Earth's ice and snow area likely enlarged and prolonged because the cooler conditions, which further lowered temperatures. These feedbacks probably sustained locally and regionally cool surface temperatures long after the impact of volcanic aerosol forcing during the LIA [17]. Third, volcanic forcing alters stratospheric circulation as the direct radiative impacts enhance the Earth’s north-south temperature gradient. This can, for example, strengthen westerly winds. Consequently, northernmost Europe can experience winter warming following strong tropical volcanic eruptions, as westerly winds bring temperate and moist marine air masses to the area [23]. Lastly, some of the indirect effects might influence the main modes of climate variability, such as the summer monsoon circulation, El Niño-Southern Oscillation or the Atlantic Multidecadal Oscillation, which can further increase the spatiotemporal differences of the climate effects of volcanic aerosol forcing [24]. In summary, because the climate effects of volcanic forcing are spatially and temporally variable, the onset and the coldest phases of the LIA do not have a readily discernible global pattern. Furthermore, because of its indirect dynamical effects volcanic aerosol forcing can differently influence summer and winter season temperatures. This explains why reconstructions which have varying response windows and sensitivity to climate variability might identify the LIA period rather differently. Due to heterogeneity of the LIA, there was no “typical” LIA climate. Historians should therefore study climate during the period using regional reconstructions relevant to their study area and research questions. In some regions, the LIA was characterised by cool temperatures, in other places by increased year-to-year weather variability. However, climate is, by definition, the long-term average of weather. Commonly, the reference period is at least 30 years. Thus, calculating multidecadal central tendencies from reconstruction data (as well as paying attention to variance and minimum and maximum values) is necessary when defining past climatic regimes. Extreme years cannot be excluded from these calculations. Consequently, drawing attention to possible outliers (i.e. extraordinary cold years) does not lead us to exaggerate the coldness of average LIA conditions, although this has been suggested by some historians. Short-term climate anomalies are part of the prevailing climate. The LIA without Periodization This article argues that it is impossible to define universal dates for the onset, termination, characteristics, or coldest phases of the LIA. Instead, these seem to vary depending the region and season in question. But is this a problem for us historians? All historians are familiar with troublesome definitions for historical “periods” – with problematic “periodizations.” For instance, it is impossible to set a common date for the onset of the early modern period. Yet the term is widely accepted and used. Historians are comfortable defining the period depending on the region in question: for some regions a dynastic change marks the onset, whereas the Protestant Reformation or the discovery of Americas might be more appropriate for others. Moreover, the main characteristics of the early modern period vary. In some places the period is marked with a decline of serfdom, for example, whereas in others with an increase. We should accept that, similarly, the periodization and characteristics of the LIA varied from region to region. The climate variability of the Earth over the past millennium is still an unsolved puzzle. Paleoclimate research resembles other fields that investigate the past, such as the discipline of history. The science of the LIA is not – nor never will be – “done”. Just as each new historical study widens our understanding on the human past, each new reconstruction, simulation and paleoclimate research paper widens our understanding of past climatic changes. There are still many open questions considering the role of volcanic forcing in triggering and sustaining the LIA. Moreover, the possible effects of solar forcing need to be further explored. Therefore, it is essential that historians who are interested in past climates follow the progress of paleoclimatology [25]. The LIA sets certain boundaries in late medieval or early modern history. Needless to say, weather events (which usually are the triggers of human calamities) may or may not be typical for prevailing climatic conditions. For example, in the case of famines in LIA Europe, LIA conditions shortened the length and cooled down the temperatures of the growing season. This made the agricultural production and related food systems more vulnerable to disturbances than they were during warmer climatic phases, especially on the northern margins of agriculture. These disturbances can include weather events like frosts destroying the harvest, violent conflicts damaging grain yields, or entitlement failures due to hoarding of food stuff. Thus, the LIA, or any past period in history, cannot be imagined as the sole cause of past events, like famines. Instead, it gives an environmental context to these events in history. Of course, the term “Little Ice Age” is not perfect. It is, for example, not correct in a geophysical sense, as it took place during an interglacial period. However, the term is short, handy, and already widely used. It is practical in science communication, such as interdisciplinary research, teaching, and public outreach. As long as we remember the heterogenous characteristics of the period, by acknowledging the Little Ice Age and exploring its possible entanglements with the human past, we might get further insights into complex climate-society relationships. These can provide perspectives on both sides of the relationship: the agency of climate in human history and the agency of humans in adapting to changing climate and coping with extreme events. Such insights have arguably never been more important than at present, in the context of ongoing anthropogenic climate change and its rising toll on our societies. References and notes: [1] Matthes, F. E. (1939). Report of committee on glaciers, April 1939. Eos, Transactions American Geophysical Union, 20(4), 518-523. [2] Kelly, M., & Ó Gráda, C. (2013). The waning of the Little Ice Age: climate change in early modern Europe. Journal of Interdisciplinary History, 44(3), 301-325. [3] Kelly, M., & Gráda, C. Ó. (2014). Change points and temporal dependence in reconstructions of annual temperature: did Europe experience a little Ice Age? The Annals of Applied Statistics, 8(3), 1372-1394. [4] Neukom, R., Steiger, N., Gómez-Navarro, J. J., Wang, J., & Werner, J. P. (2019). No evidence for globally coherent warm and cold periods over the preindustrial Common Era. Nature, 571(7766), 550-554. [5] White, S. (2013). The real little ice age. Journal of Interdisciplinary History, 44(3), 327-352. [6] Büntgen, U., & Hellmann, L. (2013). The Little Ice Age in scientific perspective: cold spells and caveats. Journal of Interdisciplinary History, 44(3), 353-368. [7] Brönnimann, S., Pfister, C. & White, S. (2018). Archives of Nature and Archives of Societies. In White, S., Pfister, C., & Mauelshagen, F. (eds.), The Palgrave Handbook of Climate History. Palgrave Macmillan, London, 27-36. [8] The PAGES (Past Global Changes) Consortium (2013). Continental-scale temperature variability during the past two millennia. Nature Geoscience, 6(5), 339-346. [9] Charpentier Ljungqvist, F., Krusic, P. J., Brattström, G., & Sundqvist, H. S. (2012). Northern Hemisphere temperature patterns in the last 12 centuries. Climate of the Past, 8, 227-249. Note that some of the data locations on the map has been moved slightly to illustrate all the proxy material, also the overlapping ones. [10] Pfister, C., Camenisch, C., & Dobrovolný, P. (2018). Analysis and Interpretation: Temperature and Precipitation Indices. In White, S., Pfister, C., & Mauelshagen, F. (eds.), The Palgrave Handbook of Climate History. Palgrave Macmillan, London, 115-129. [11] Dobrovolný, P. (2018). Analysis and Interpretation: Calibration-Verification. In White, S., Pfister, C., & Mauelshagen, F. (eds.), The Palgrave Handbook of Climate History. Palgrave Macmillan, London, 107-113. [12] Van Engelen, A. F., Buisman, J., & IJnsen, F. (2001). A millennium of weather, winds and water in the low countries. In History and Climate. Springer, Boston, MA, 101-124. The time-series downloaded from the KNLM Climate Explorer. [13] Matskovsky, V. V., & Helama, S. (2014). Testing long-term summer temperature reconstruction based on maximum density chronologies obtained by reanalysis of tree-ring data sets from northernmost Sweden and Finland. Climate of the Past, 10(4), 1473-1487; Helama, S., Vartiainen, M., Holopainen, J., Mäkelä, H. M., Kolström, T., & Meriläinen, J. (2014). A palaeotemperature record for the Finnish Lakeland based on microdensitometric variations in tree rings. Geochronometria, 41(3), 265-277; Schneider, L., Smerdon, J. E., Büntgen, U., Wilson, R. J., Myglan, V. S., Kirdyanov, A. V., & Esper, J. (2015). Revising midlatitude summer temperatures back to AD 600 based on a wood density network. Geophysical Research Letters, 42(11), 4556-4562. The Polar Urals reconstruction data has been downloaded from a dataset provided by Wilson, R., Anchukaitis, K., Briffa, K. R., Büntgen, U., Cook, E., D'arrigo, R., ... & Hegerl, G. (2016). Last millennium northern hemisphere summer temperatures from tree rings: Part I: The long term context. Quaternary Science Reviews, 134, 1-18. [14] Analysis was performed with the R changepoint package (2.2.2) as implemented by Killick, R., & Eckley, I. (2014). changepoint: An R package for changepoint analysis. Journal of Statistical Software, 58(3), 1-19. [15] Analysis was performed with the R bcp package (4.0.3) as implemented by Erdman, C., & Emerson, J. W. (2007). bcp: an R package for performing a Bayesian analysis of change point problems. Journal of Statistical Software, 23(3), 1-13. [16] Warm season: June–August for the Northern Fennoscandia and Polar Urals, and April–September for the South Finland reconstructions. Correlation analysis performed with the Climate Explorer using the HadCRUT4/HadSST4 filled-in T2m/SST field data (Cowtan, K., & Way, R. G. (2014). Coverage bias in the HadCRUT4 temperature series and its impact on recent temperature trends. Quarterly Journal of the Royal Meteorological Society, 140(683), 1935-1944). [17] Miller, G. H., Geirsdóttir, Á., Zhong, Y., Larsen, D. J., Otto‐Bliesner, B. L., Holland, M. M., ... & Anderson, C. (2012). Abrupt onset of the Little Ice Age triggered by volcanism and sustained by sea‐ice/ocean feedbacks. Geophysical Research Letters, 39(2). [18] Neukom, R., Barboza, L. A., Erb, M. P., Shi, F., Emile-Geay, J., Evans, M. N., ... & Schurer, A. (2019). Consistent multi-decadal variability in global temperature reconstructions and simulations over the Common Era. Nature geoscience, 12(8), 643-649. [19] In addition, perhaps the early (pre-1950s) warming might be attributable also to some degree to the lack of volcanic aerosol forcing. Note also that depending on the reconstruction materials and methods, plausibly also better proxy sample replication or overlapping instrumental data may contribute to the similarity of temperature trends over the past 150 years. [20] Sigl, M., Winstrup, M., McConnell, J. R., Welten, K. C., Plunkett, G., Ludlow, F., ... & Fischer, H. (2015). Timing and climate forcing of volcanic eruptions for the past 2,500 years. Nature, 523(7562), 543. [21] Ballantyne, A. P., Alden, C. B., Miller, J. B., Tans, P. P., & White, J. W. C. (2012). Increase in observed net carbon dioxide uptake by land and oceans during the past 50 years. Nature, 488(7409), 70. Time-series downloaded from the KNLM Climate Explorer. [22] CRUTEM (4.6) T2m anomalies averaged over 20-70E and 60-70N, https://www.metoffice.gov.uk/hadobs/crutem4/; Time-series downloaded from the KNLM Climate Explorer. [23] Fischer, E. M., Luterbacher, J., Zorita, E., Tett, S. F. B., Casty, C., & Wanner, H. (2007). European climate response to tropical volcanic eruptions over the last half millennium. Geophysical research letters, 34(5). [24] Good summary of the climatic effects of volcanic aerosol forcing can be found, for example, in Brönnimann, S. (2015). Climatic changes since 1700, Springer, Cham (especially pp. 123–135). [25] Consequently, it is noteworthy to mention that although the LIA cooling is currently attributed to volcanic forcing, our understanding for the drivers of the period may advance in the future. Likewise, the Southern Hemispheric extent of the cool period may improve with new proxy data available. Special thanks to Dagomar Degroot and Fredrik Charpentier Ljungqvist for the inspiring discussions and comments which helped shape this text. |
Archives
March 2022
Categories
All
|


 RSS Feed