|
Dr. Heli Huhtamaa, University of Bern  Many of these recent books on the history of climate deal with the Little Ice Age. But what was it, exactly? The Little Ice Age (LIA), a climatic phase that overlapped with the late-medieval and early modern periods, increasingly interests historians - academic and popular alike. Recently, they have tied the LIA to the outbreak of wars, famines, economic depressions and overall troublesome times. Not only a handful of climate historians are using the term anymore. These days, perhaps due to the overall increasing climate awareness, the period pops up in history-related print media, teaching, online blogs, and – of course – in academic research, among other places. As the LIA is the last distinctive climatic regime before the contemporary anthropogenic climate change, it can provide important analogues to better understand climate-society relationships on various temporal scales – from the direct consequences of short-term extreme events to multi-centennial dynamics of climate resilience. The term "Little Ice Age" was presumably introduced by François E. Matthes in 1939 when he chronicled the advance and retreat of glacier over the past 4000 years across the present-day United States [1]. Since the late 20th century, hundreds (if not thousands) of paleoclimate reconstructions and models have shed further light on the LIA, and the term has been widely accepted to indicate multi-centennial cooler phase occurring in the Northern Hemisphere during the second millennium CE. However, there the agreement over the universal characteristics of the LIA ends. Even a brief reading of the scientific literature on the topic reveals that there are remarkably differing views on the magnitude of the temperature depression, the spatial extent, as well as the onset and termination of the LIA. Within the discipline of history, economic historians Morgan Kelly and Cormac Ó Gráda authored perhaps the best-known publication that highlights the uncertainties related to the magnitude and dating of the event [2]. They have also used change-point analysis to argue that there is no evidence for any statistically significant change in the mean or variance of European temperatures that could be associated with an onset of the LIA [3]. Furthermore, a recent scientific study demonstrated that is it impossible to assign globally coherent dates for the coldest phases of the LIA [4]. Considering the uncertainties related to its periodization, is it appropriate for historians to keep on using the term LIA? In this article, I will argue that it is. However, this requires us to have some basic knowledge about the materials and methods used to detect past climate variability, as well as an understanding of the dynamical drivers of the LIA. My aim here is not to analyse systematically all available climate reconstruction data in relation to the LIA. Instead, I will explain what requirements reconstructions must meet to detect climatic change with statistical analysis, and then present a couple relevant examples. Neither will I revisit earlier criticisms of the LIA concept [2], as these have been addressed elsewhere by historians and scientists [5, 6]. Above all, I hope to reveal why the science of the LIA gives us such a complex image of the period and why this is – in fact – not at all a serious problem for historians. Detecting the onset of the LIA Scientists started to measure weather with instruments only in the 18th and 19th centuries. For periods further back in time, we can reconstruct past climate variability from climate proxies. Proxies are indirect climate data, materials which have been influenced by climate of the time when they were laid or written down, formed, or grown. Proxies are found either in the “archives of nature,” like in tree rings, ice layers or sediment varves, or in the “archives of societies.” For example, administrative sources, chronicles and private diaries may contain descriptions of weather and records of climate-sensitive activities, like harvest onset or river ice break-up dates. The later archive type, the written documents, holds climatic and meteorological information particularly relevant to human history [7]. The PAGES (Past Global Changes, an international association that bridges paleoclimatologists across the globe) 2k Consortium reconstructions indicate that mean temperatures in the Arctic, Europe and Asia were colder in the 13th and 14th centuries CE than in the previous centuries [8]. These multidecadal cooler anomalies may mark the possible onset period of the LIA (Figure 1a). Likewise, numerous individual climate proxy records show in increasing numbers signs of cooling temperatures from the 1300s and 1400s onwards across the Northern Hemisphere (Figure 1b). Thus, if we aim to identify LIA cooling statistically in individual temperature reconstruction data, our time-series should reach beyond the 13th century. This wide temporal scale, however, poses a challenge: where can we find data that goes back so far? 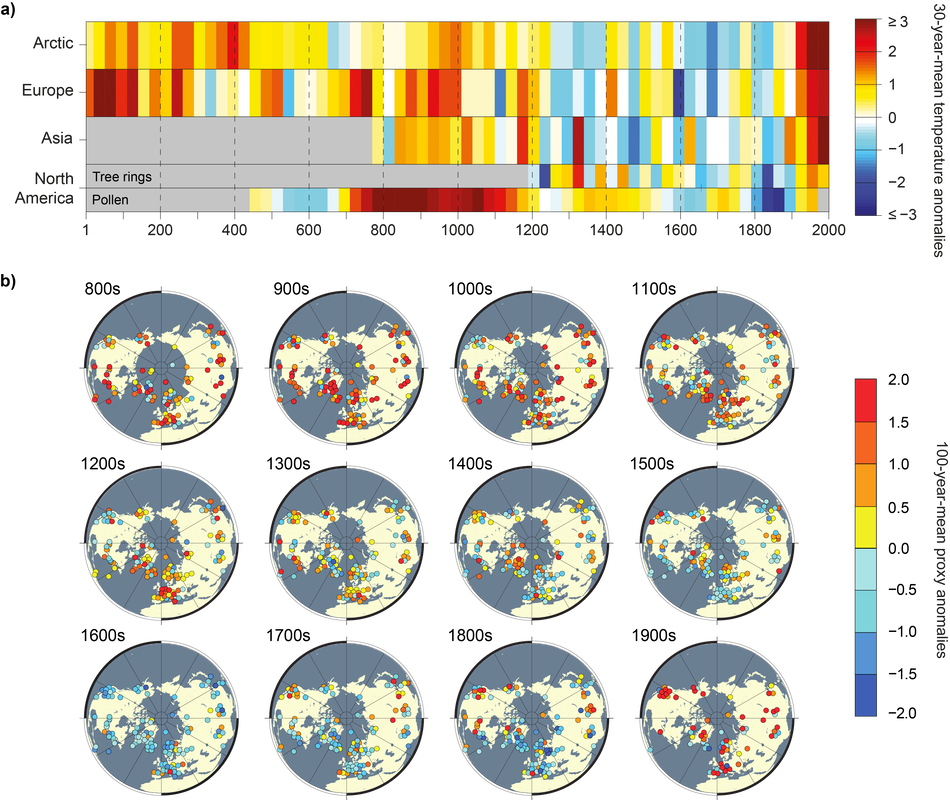 FIGURE 1. a) 30-year-mean standardized (1190–1970) temperatures for the four Northern Hemisphere PAGES 2k regions [8]. b) Northern Hemisphere standardized (1000–1900) centennial temperature proxy anomalies from various type of data material (ice-cores, lake and ocean sediments, speleothems, tree-rings and written documents) [9]. From written sources, climate variability is commonly reconstructed with one of the two standard methods: with the calibration-verification procedure or with the index approach [10, 11]. Calibration-verification procedure first translates time-series of climate-sensitive information (like harvest dates from written sources) into meteorological units (such as degrees Celsius) by calibrating the historical data to overlapping period of measured meteorological data. This statistical relationship is then verified with an independent period of overlapping meteorological data [10]. The index approach, on the other hand, first analyses historical climatic information qualitatively and then gives an ordinal-scale value for each datapoint, e.g. from -3 indicating extremely cold to +3 extremely warm [10]. The former method is better suited to detect so-called low-frequency variability (slow and gradual changes like the LIA), whereas the latter identifies primarily year-to-year variability (see Figure 2). For Europe, for example, there is no documentary-based temperature series which would cover the whole last millennium and which would be reconstructed with the calibration-verification procedure. This is because the climate data from European antique and medieval sources are too diverse and inconsistent to use this method to transform the materials into reconstructions [10]. Therefore, the reconstructions that extend prior 1500 CE are usually compiled with the index method. Unfortunately, climate reconstructions made from documentary data with this method are not well-suited to detect the LIA change, as these are known to poorly indicate low-frequency variability [10]. At first sight, one exception to the absence of calibration-verification reconstructions extending further back in time appears to be the Netherlands winter and summer temperature reconstruction by A. F. V. van Engelen and others [12]. However, these reconstructions also pose a challenge if we wish to statistically identify change happening over the 13th or 14th centuries because even visual inspection of the series reveal that the early section of the reconstruction appears to be based on ordinal indices. For example, the summer temperature series vary between only seven values before the 14th century (Figure 2). Even these reconstructions are therefore not well-suited to reveal the onset of the LIA, as there is a danger that change detectable with statistical analysis would indicate the change in the reconstruction materials and methods used, not the change in temperatures. 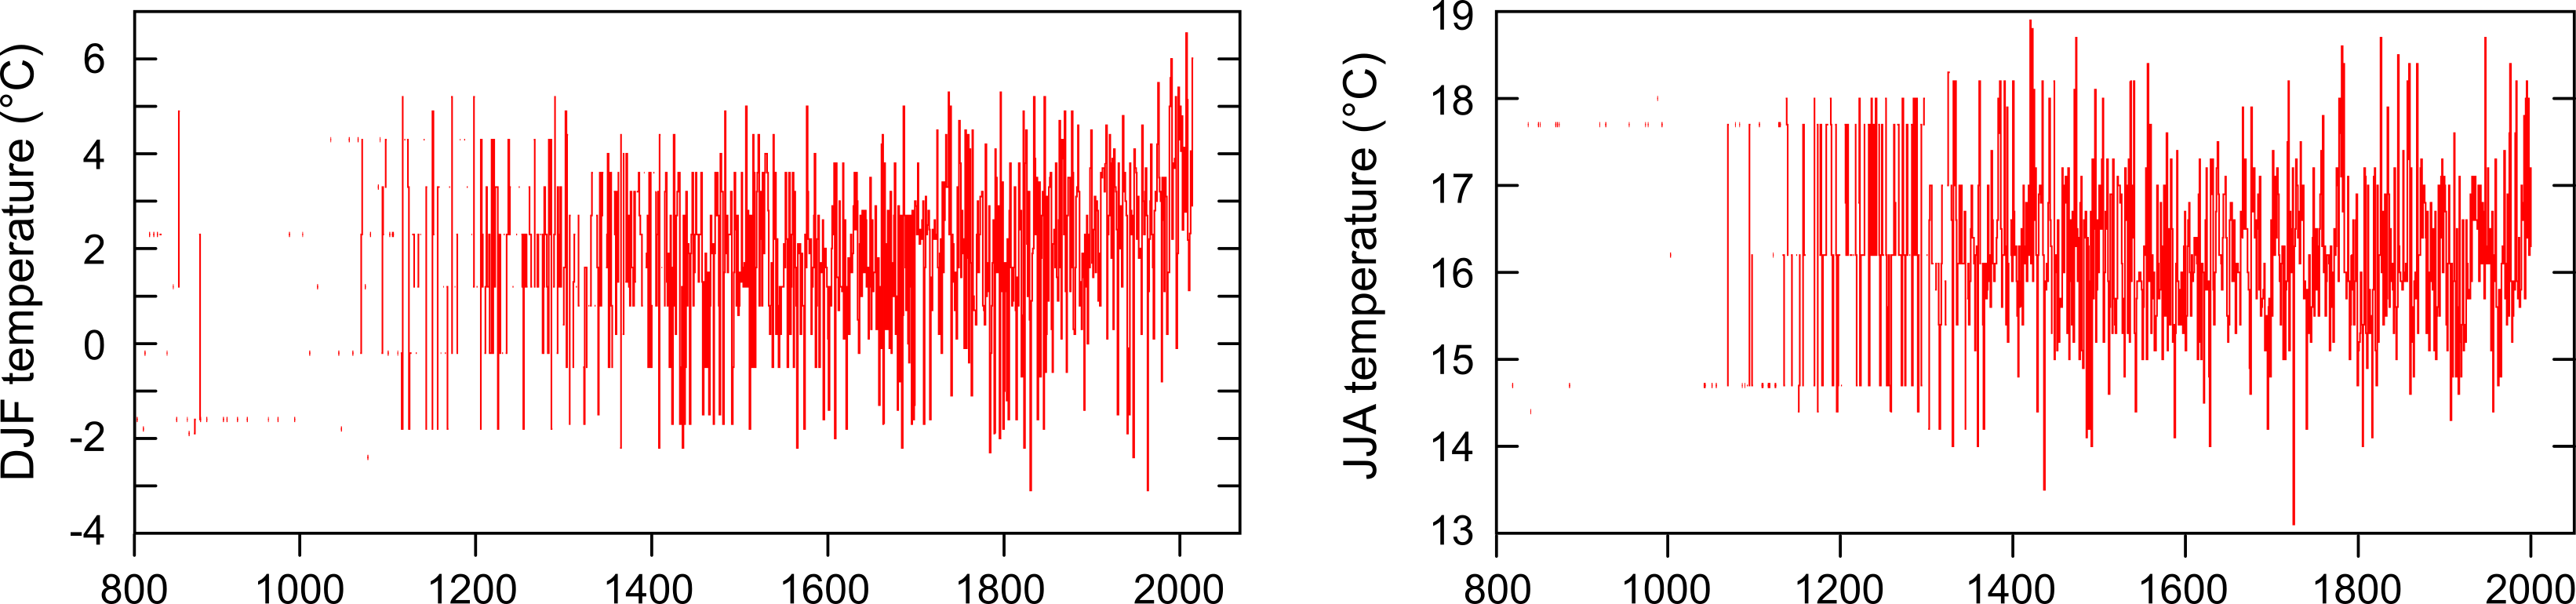 FIGURE 2. Netherlands December–February (left) and June–August (right) temperature reconstructions [12]. Note the change in the reconstructed values taking place over c. 14th century. The earlier part of the reconstruction resembles visually an index-based reconstruction and the latter calibration-verification one. Because of the lack of adequate document-based climate reconstructions covering the whole past millennium, the onset of the LIA needs to be detected from reconstructions compiled using natural proxy data. Yet, these reconstructions give markedly varying periodisation for the LIA. This is partly because different climate proxies, such as tree-ring width or isotopic concentrations in ice-core data, have different “response windows.” This means that different data from different locations are sensitive to different meteorological parameters (such as temperature or precipitation) over different timescales (from months to decades). Raw proxy data therefore portray a rather heterogeneous image of temperature variability over the past 1000 years (Figure 1b). Furthermore, non-climatic factors also influence the measured proxies, and sometimes it is difficult to distinguish heterogeneity that registers climate and weather from heterogeneity that simply reflects noise. Because proxy data are sensitive to past climate variability only in certain locations over certain seasons, and with imperfect accuracy, we have just a partial view of what has happened to climate prior to systematic meteorological measurements began. However, the differing response windows of different proxy data do not entirely explain our heterogeneous image of the LIA, as reconstructions made from same material type can be in interannual to multidecadal disagreement over past temperature variability. For example, when detecting change from mean warm season temperatures in northern Eurasia, three tree-ring density-based reconstructions suggest different dates for the onset of the LIA (Figure 3). 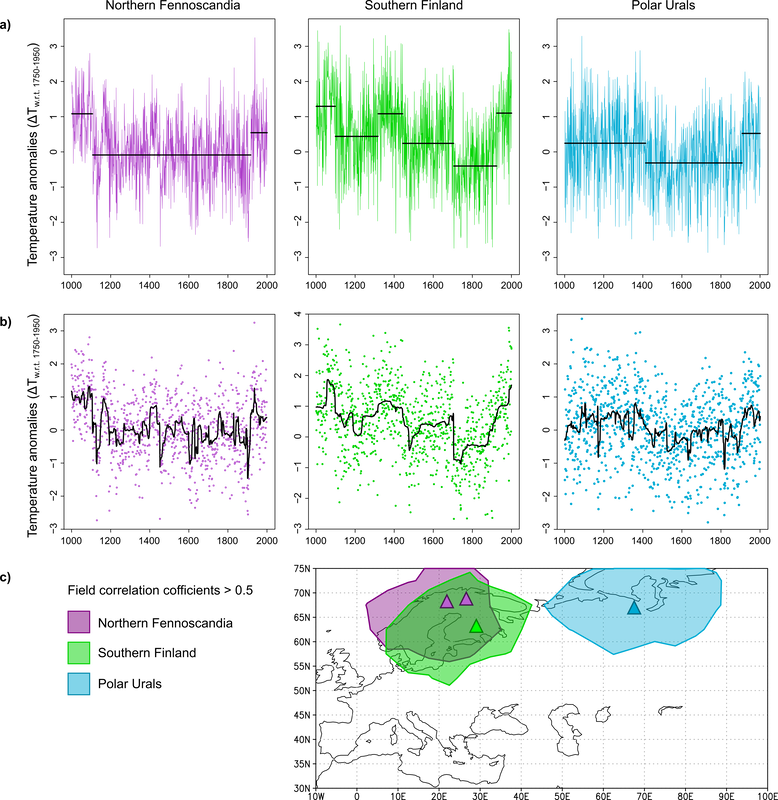 FIGURE 3. Changepoint analysis for three northern Eurasian tree-ring density-based warm season temperature reconstructions [13]. a) Changepoints in mean for three warm season temperature reconstructions in 1000-2000 CE detected with a Binary Segmentation method with a minimum segment length of 30 years [14]. b) The same trends are detectable in the posterior means (black lines) when the data are analysed with Bayesian changepoint procedure [15]. c) The reconstructions’ approximate sampling sites (triangles) and spatial domains (shading – the areas where the correlation coefficients (Pearson’s r) between the reconstructions and measured warm season temperatures are > 0.5 over the period 1850–2000) [16]. Still, most temperature reconstructions from the Northern Hemisphere identify a significant change to cooler mean temperatures, as in the examples presented in Figure 3. All indicate that the change to cooler climate took place well before the 1500s. Thus, the lack of detectable LIA change in previous analyses [3] may simply reflect the relative brevity of the time-series used. The main trigger of the LIA? The heterogenous spatiotemporal characteristics of the LIA can be primarily explained by the probable trigger of the climatic phase: volcanic aerosol forcing [17]. Large volcanic eruptions can inject sulphur compounds far into the stratosphere, where they are oxidized and become aerosols that absorb and scatter incoming solar radiation. The stratosphere warms but less radiation reaches the ground, cooling Earth’s surface. Many paleoscientists attribute multi-decadal temperature variability prior to anthropogenic warming – including the onset of the coldest phases of the LIA - to volcanic aerosol forcing [17, 18]. One common criticism of the LIA as a concept is that current climate change is not comparable to the LIA. Indeed, the LIA and anthropogenic warming are not comparable climatic phases in terms of the extent or magnitude of the change, partly due to the different drivers of these changes. Whereas the LIA was to a great degree triggered by volcanic forcing, the current climatic change is caused by rising atmospheric greenhouse gas concentrations (Figure 4). The climatic impact of these two forcing mechanisms differs considerably, so that while the onset of the LIA varies between reconstructions, the shift to a warmer climate is identifiable in a rather small temporal window (1900s–1920s, see Figure 3a) [19]. Furthermore, whereas long-term variations in temperature differ considerably prior to industrialization, all climate reconstructions presented here indicate similar long-term trends over the past 150 years (Figure 4). 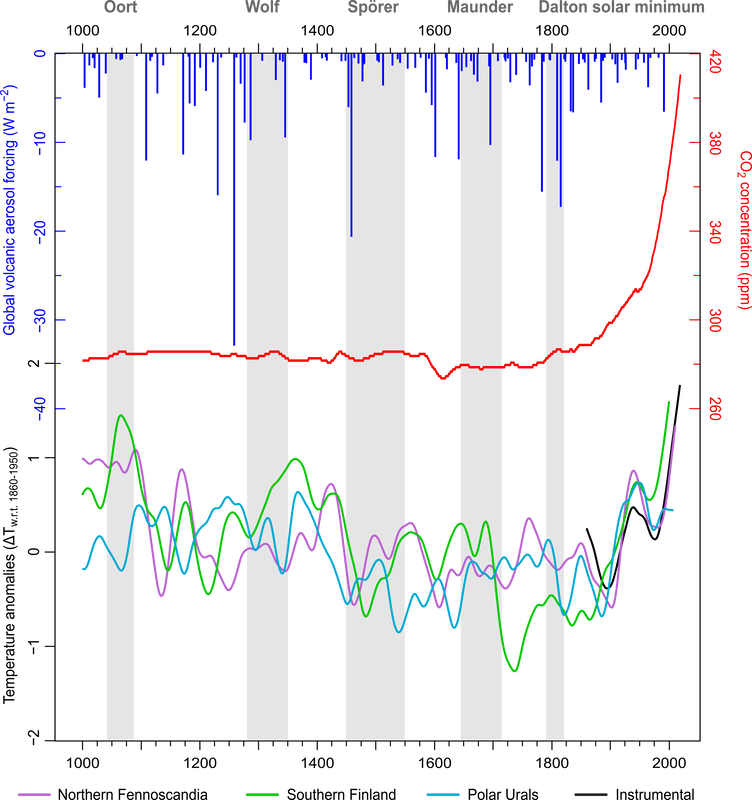 FIGURE 4. Global volcanic aerosol forcing [20], mean of global marine CO2 concentrations [21] and long-term (smoothed using 50-year spline) warm season temperature variability from the reconstructions presented in Figure 3 [13] and instrumental temperature measurements between 1860–2018 [22]. Moreover, volcanic aerosol forcing has both direct and indirect impacts on Earth’s climate. Its direct impacts refer to the mechanisms described above. Its indirect impacts are still not fully understood, but these likely contribute to the spatiotemporal heterogeneity of its climatic impacts. First, the eruption-related cooling is not globally uniform as, for example, oceans cool slower than land. Second, feedback mechanisms can prolong and intensify eruption-related cooling in some areas.
One such feedback mechanism is called ice-albedo feedback. Whereas open waters and dark forests absorb a lot of solar radiation and so warm Earth’s surface, white ice and snow reflect far more incoming solar radiation back into space, cooling the surface. During periods of increased volcanic forcing, the extent and duration of Earth's ice and snow area likely enlarged and prolonged because the cooler conditions, which further lowered temperatures. These feedbacks probably sustained locally and regionally cool surface temperatures long after the impact of volcanic aerosol forcing during the LIA [17]. Third, volcanic forcing alters stratospheric circulation as the direct radiative impacts enhance the Earth’s north-south temperature gradient. This can, for example, strengthen westerly winds. Consequently, northernmost Europe can experience winter warming following strong tropical volcanic eruptions, as westerly winds bring temperate and moist marine air masses to the area [23]. Lastly, some of the indirect effects might influence the main modes of climate variability, such as the summer monsoon circulation, El Niño-Southern Oscillation or the Atlantic Multidecadal Oscillation, which can further increase the spatiotemporal differences of the climate effects of volcanic aerosol forcing [24]. In summary, because the climate effects of volcanic forcing are spatially and temporally variable, the onset and the coldest phases of the LIA do not have a readily discernible global pattern. Furthermore, because of its indirect dynamical effects volcanic aerosol forcing can differently influence summer and winter season temperatures. This explains why reconstructions which have varying response windows and sensitivity to climate variability might identify the LIA period rather differently. Due to heterogeneity of the LIA, there was no “typical” LIA climate. Historians should therefore study climate during the period using regional reconstructions relevant to their study area and research questions. In some regions, the LIA was characterised by cool temperatures, in other places by increased year-to-year weather variability. However, climate is, by definition, the long-term average of weather. Commonly, the reference period is at least 30 years. Thus, calculating multidecadal central tendencies from reconstruction data (as well as paying attention to variance and minimum and maximum values) is necessary when defining past climatic regimes. Extreme years cannot be excluded from these calculations. Consequently, drawing attention to possible outliers (i.e. extraordinary cold years) does not lead us to exaggerate the coldness of average LIA conditions, although this has been suggested by some historians. Short-term climate anomalies are part of the prevailing climate. The LIA without Periodization This article argues that it is impossible to define universal dates for the onset, termination, characteristics, or coldest phases of the LIA. Instead, these seem to vary depending the region and season in question. But is this a problem for us historians? All historians are familiar with troublesome definitions for historical “periods” – with problematic “periodizations.” For instance, it is impossible to set a common date for the onset of the early modern period. Yet the term is widely accepted and used. Historians are comfortable defining the period depending on the region in question: for some regions a dynastic change marks the onset, whereas the Protestant Reformation or the discovery of Americas might be more appropriate for others. Moreover, the main characteristics of the early modern period vary. In some places the period is marked with a decline of serfdom, for example, whereas in others with an increase. We should accept that, similarly, the periodization and characteristics of the LIA varied from region to region. The climate variability of the Earth over the past millennium is still an unsolved puzzle. Paleoclimate research resembles other fields that investigate the past, such as the discipline of history. The science of the LIA is not – nor never will be – “done”. Just as each new historical study widens our understanding on the human past, each new reconstruction, simulation and paleoclimate research paper widens our understanding of past climatic changes. There are still many open questions considering the role of volcanic forcing in triggering and sustaining the LIA. Moreover, the possible effects of solar forcing need to be further explored. Therefore, it is essential that historians who are interested in past climates follow the progress of paleoclimatology [25]. The LIA sets certain boundaries in late medieval or early modern history. Needless to say, weather events (which usually are the triggers of human calamities) may or may not be typical for prevailing climatic conditions. For example, in the case of famines in LIA Europe, LIA conditions shortened the length and cooled down the temperatures of the growing season. This made the agricultural production and related food systems more vulnerable to disturbances than they were during warmer climatic phases, especially on the northern margins of agriculture. These disturbances can include weather events like frosts destroying the harvest, violent conflicts damaging grain yields, or entitlement failures due to hoarding of food stuff. Thus, the LIA, or any past period in history, cannot be imagined as the sole cause of past events, like famines. Instead, it gives an environmental context to these events in history. Of course, the term “Little Ice Age” is not perfect. It is, for example, not correct in a geophysical sense, as it took place during an interglacial period. However, the term is short, handy, and already widely used. It is practical in science communication, such as interdisciplinary research, teaching, and public outreach. As long as we remember the heterogenous characteristics of the period, by acknowledging the Little Ice Age and exploring its possible entanglements with the human past, we might get further insights into complex climate-society relationships. These can provide perspectives on both sides of the relationship: the agency of climate in human history and the agency of humans in adapting to changing climate and coping with extreme events. Such insights have arguably never been more important than at present, in the context of ongoing anthropogenic climate change and its rising toll on our societies. References and notes: [1] Matthes, F. E. (1939). Report of committee on glaciers, April 1939. Eos, Transactions American Geophysical Union, 20(4), 518-523. [2] Kelly, M., & Ó Gráda, C. (2013). The waning of the Little Ice Age: climate change in early modern Europe. Journal of Interdisciplinary History, 44(3), 301-325. [3] Kelly, M., & Gráda, C. Ó. (2014). Change points and temporal dependence in reconstructions of annual temperature: did Europe experience a little Ice Age? The Annals of Applied Statistics, 8(3), 1372-1394. [4] Neukom, R., Steiger, N., Gómez-Navarro, J. J., Wang, J., & Werner, J. P. (2019). No evidence for globally coherent warm and cold periods over the preindustrial Common Era. Nature, 571(7766), 550-554. [5] White, S. (2013). The real little ice age. Journal of Interdisciplinary History, 44(3), 327-352. [6] Büntgen, U., & Hellmann, L. (2013). The Little Ice Age in scientific perspective: cold spells and caveats. Journal of Interdisciplinary History, 44(3), 353-368. [7] Brönnimann, S., Pfister, C. & White, S. (2018). Archives of Nature and Archives of Societies. In White, S., Pfister, C., & Mauelshagen, F. (eds.), The Palgrave Handbook of Climate History. Palgrave Macmillan, London, 27-36. [8] The PAGES (Past Global Changes) Consortium (2013). Continental-scale temperature variability during the past two millennia. Nature Geoscience, 6(5), 339-346. [9] Charpentier Ljungqvist, F., Krusic, P. J., Brattström, G., & Sundqvist, H. S. (2012). Northern Hemisphere temperature patterns in the last 12 centuries. Climate of the Past, 8, 227-249. Note that some of the data locations on the map has been moved slightly to illustrate all the proxy material, also the overlapping ones. [10] Pfister, C., Camenisch, C., & Dobrovolný, P. (2018). Analysis and Interpretation: Temperature and Precipitation Indices. In White, S., Pfister, C., & Mauelshagen, F. (eds.), The Palgrave Handbook of Climate History. Palgrave Macmillan, London, 115-129. [11] Dobrovolný, P. (2018). Analysis and Interpretation: Calibration-Verification. In White, S., Pfister, C., & Mauelshagen, F. (eds.), The Palgrave Handbook of Climate History. Palgrave Macmillan, London, 107-113. [12] Van Engelen, A. F., Buisman, J., & IJnsen, F. (2001). A millennium of weather, winds and water in the low countries. In History and Climate. Springer, Boston, MA, 101-124. The time-series downloaded from the KNLM Climate Explorer. [13] Matskovsky, V. V., & Helama, S. (2014). Testing long-term summer temperature reconstruction based on maximum density chronologies obtained by reanalysis of tree-ring data sets from northernmost Sweden and Finland. Climate of the Past, 10(4), 1473-1487; Helama, S., Vartiainen, M., Holopainen, J., Mäkelä, H. M., Kolström, T., & Meriläinen, J. (2014). A palaeotemperature record for the Finnish Lakeland based on microdensitometric variations in tree rings. Geochronometria, 41(3), 265-277; Schneider, L., Smerdon, J. E., Büntgen, U., Wilson, R. J., Myglan, V. S., Kirdyanov, A. V., & Esper, J. (2015). Revising midlatitude summer temperatures back to AD 600 based on a wood density network. Geophysical Research Letters, 42(11), 4556-4562. The Polar Urals reconstruction data has been downloaded from a dataset provided by Wilson, R., Anchukaitis, K., Briffa, K. R., Büntgen, U., Cook, E., D'arrigo, R., ... & Hegerl, G. (2016). Last millennium northern hemisphere summer temperatures from tree rings: Part I: The long term context. Quaternary Science Reviews, 134, 1-18. [14] Analysis was performed with the R changepoint package (2.2.2) as implemented by Killick, R., & Eckley, I. (2014). changepoint: An R package for changepoint analysis. Journal of Statistical Software, 58(3), 1-19. [15] Analysis was performed with the R bcp package (4.0.3) as implemented by Erdman, C., & Emerson, J. W. (2007). bcp: an R package for performing a Bayesian analysis of change point problems. Journal of Statistical Software, 23(3), 1-13. [16] Warm season: June–August for the Northern Fennoscandia and Polar Urals, and April–September for the South Finland reconstructions. Correlation analysis performed with the Climate Explorer using the HadCRUT4/HadSST4 filled-in T2m/SST field data (Cowtan, K., & Way, R. G. (2014). Coverage bias in the HadCRUT4 temperature series and its impact on recent temperature trends. Quarterly Journal of the Royal Meteorological Society, 140(683), 1935-1944). [17] Miller, G. H., Geirsdóttir, Á., Zhong, Y., Larsen, D. J., Otto‐Bliesner, B. L., Holland, M. M., ... & Anderson, C. (2012). Abrupt onset of the Little Ice Age triggered by volcanism and sustained by sea‐ice/ocean feedbacks. Geophysical Research Letters, 39(2). [18] Neukom, R., Barboza, L. A., Erb, M. P., Shi, F., Emile-Geay, J., Evans, M. N., ... & Schurer, A. (2019). Consistent multi-decadal variability in global temperature reconstructions and simulations over the Common Era. Nature geoscience, 12(8), 643-649. [19] In addition, perhaps the early (pre-1950s) warming might be attributable also to some degree to the lack of volcanic aerosol forcing. Note also that depending on the reconstruction materials and methods, plausibly also better proxy sample replication or overlapping instrumental data may contribute to the similarity of temperature trends over the past 150 years. [20] Sigl, M., Winstrup, M., McConnell, J. R., Welten, K. C., Plunkett, G., Ludlow, F., ... & Fischer, H. (2015). Timing and climate forcing of volcanic eruptions for the past 2,500 years. Nature, 523(7562), 543. [21] Ballantyne, A. P., Alden, C. B., Miller, J. B., Tans, P. P., & White, J. W. C. (2012). Increase in observed net carbon dioxide uptake by land and oceans during the past 50 years. Nature, 488(7409), 70. Time-series downloaded from the KNLM Climate Explorer. [22] CRUTEM (4.6) T2m anomalies averaged over 20-70E and 60-70N, https://www.metoffice.gov.uk/hadobs/crutem4/; Time-series downloaded from the KNLM Climate Explorer. [23] Fischer, E. M., Luterbacher, J., Zorita, E., Tett, S. F. B., Casty, C., & Wanner, H. (2007). European climate response to tropical volcanic eruptions over the last half millennium. Geophysical research letters, 34(5). [24] Good summary of the climatic effects of volcanic aerosol forcing can be found, for example, in Brönnimann, S. (2015). Climatic changes since 1700, Springer, Cham (especially pp. 123–135). [25] Consequently, it is noteworthy to mention that although the LIA cooling is currently attributed to volcanic forcing, our understanding for the drivers of the period may advance in the future. Likewise, the Southern Hemispheric extent of the cool period may improve with new proxy data available. Special thanks to Dagomar Degroot and Fredrik Charpentier Ljungqvist for the inspiring discussions and comments which helped shape this text. Prof. David J. Nash, University of Brighton, UK, and University of the Witwatersrand, South Africa  To grasp the significance of global warming, and to confirm its connection to human activity, you have to know how climate has changed in the past. Scholars of past climate change know that understanding how climate has varied over historical timescales requires access to robust long-term datasets. This is not a problem for regions such as Europe and North America, which have a centuries-long tradition of recording meteorological data using weather instruments (thermometers, for example). However, for large areas of the world the ‘instrumental period’ begins, at best, in the late 19th or early 20th century. This includes Africa, where, with the exception of Algeria and South Africa, instrumental data for periods earlier than 1850 are sparse. To overcome such data scarcity, other approaches are used to reconstruct past climates, most notably through analyses of accounts of weather events and their impacts in historical documents. Compared to the wealth of documentary evidence available for areas such as Europe and China, there are relatively few collections of written materials that allow us to explore the historical climatology of Africa. Documents in Dutch exist from the area around Cape Town that date back to the earliest European settlers in 1652, and Arabic- and Portuguese-language documents from northern and southern Africa, respectively, are likely to include climate perspectives from even further back in time. However, the bulk of written evidence for Africa stems from the late 18th century onwards, with a proliferation of materials for the 19th century following the expansion of European colonial activity. These documents are increasingly used by historical climatologists to reconstruct sequences of rainfall variability for the African continent. This focus on rainfall isn’t surprising, given that rainfall was – and is – critical for human survival. As a result, people tended to write about its presence or absence in diaries, letters, and reports. In turn, these rainfall reconstructions are now used by historians as a backdrop when exploring climate-society relationships for specific time periods. It is therefore critical that we understand any issues with rainfall reconstructions in case they mislead or misinform. This article will take you under the hood of the practice of reconstructing past climate change. Its aim is to: (a) provide an overview of historical climatology research in Africa at continental to regional scales; and (b) point out how distinct approaches to rainfall reconstruction in different studies can potentially produce very different rainfall chronologies, even for the same geographical area (which of course alters the kinds of environmental histories that can be written about Africa). The article concludes with some personal reflections on how we might move towards a common approach to rainfall reconstruction for the African continent. Different approaches to rainfall reconstruction in Africa Most historical rainfall reconstructions for Africa use evidence from one or more source type (Figure 1). A small number of studies are based exclusively upon early instrumental meteorological data. Of these, some (the continent-wide analysis by Nicholson et al. in 2018, for example) combine rain gauge data published in 19th-century newspapers and reports with more systematically collected precipitation data from the 19th to 21st centuries, to produce quantitative or semi-quantitative time series. Others, such as Hannaford et al. (2015), for southeast Africa, use data digitized from ship logbooks to generate quantitative regional rainfall chronologies. 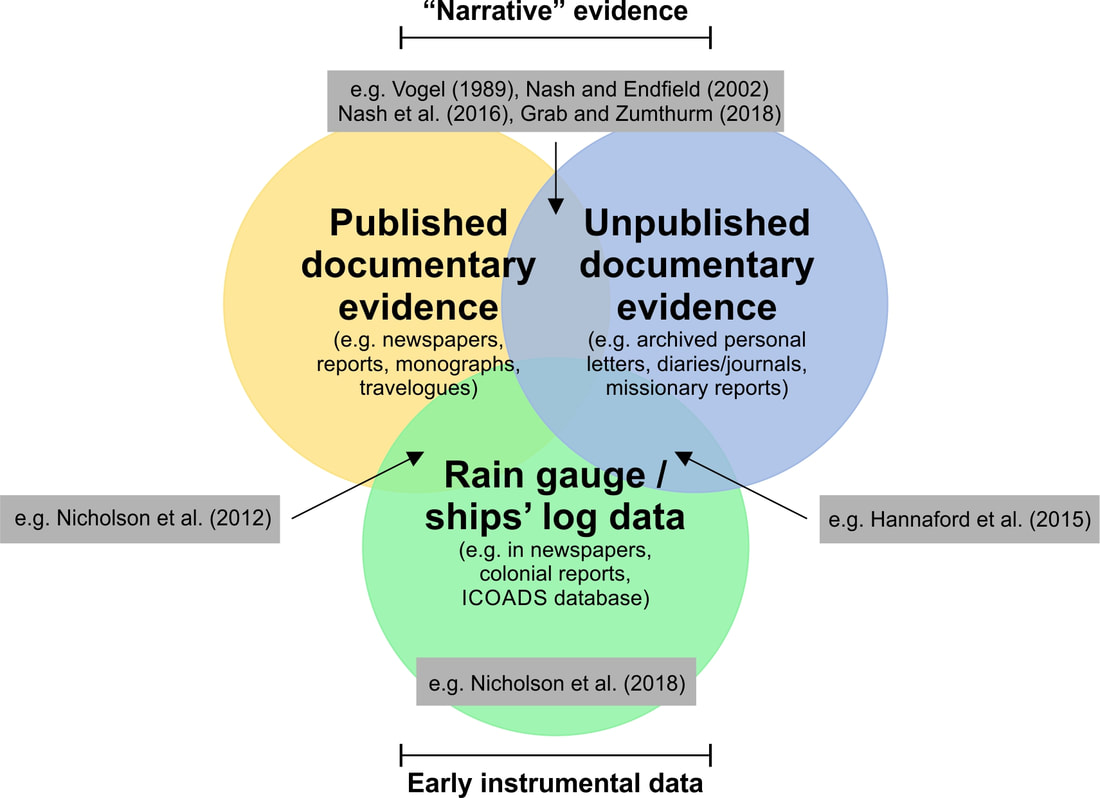 Fig. 1. Combinations of different types of narrative evidence and early instrumental data (circles) used in selected historical rainfall reconstructions for Africa (grey boxes). Most reconstructions, however, draw on European traditions by using narrative accounts of weather and related phenomena contained within documentary sources (such as personal letters, diaries/journals, reports, newspapers, monographs and travelogues) to develop semi-quantitative relative rainfall chronologies. Some of the most widely available materials are those written by early explorers, missionaries, and figures of colonial authority. The use of such evidence permits the reconstruction of rainfall for periods well before the advent of meteorological data collection. The greatest numbers of regional documentary-based reconstructions are available for southern Africa, which forms the focus of this article. These draw on documentary evidence from a combination of published and unpublished sources, often using available instrumental data for verification and calibration, and span much of the 19th century. Where information density permits, it has been possible to reconstruct rainfall variability down to seasonal scales (see, for example, a study by Nash et al. in 2016). There are, in addition, continent-wide series that integrate narrative information from mainly published sources with available rainfall data (Nicholson et al., 2012, for 90 homogenous rainfall regions across mainland Africa). An important point to note is that the various reconstructions adopt slightly different methodologies for analyzing documentary evidence. For example, all of the regional studies in southern Africa noted above use a five-point scale to classify annual rainfall (from –2 to +2; extremely dry to extremely wet). Scholars decide how to classify a specific rainy season in a region through qualitative analysis of the collective documentary evidence for that season. In other words, they take into account all quotations describing weather and related conditions. This contrasts with the approach used by Nicholson and colleagues in a 2012 continent-wide rainfall series. In that reconstruction, scholars attributed a numerical score on a seven-point scale (–3 to 3) to each individual quotation according to how wet or dry conditions appear to have been. They then summed and averaged the scores for each item of evidence for a specific region and year. As we will see, these distinct analytical approaches, which may draw on different documentary evidence, may introduce significant discrepancies between rainfall series. Comparisons between rainfall series A compilation of all the available annually-resolved rainfall series for mainland southern Africa is shown in Figure 2. This includes seven series (g-m) based exclusively on documentary evidence, four regional series (c-f) from Nicholson et al. (2012) based on combined documentary evidence and rain gauge data, the 19th-century portion of the ships’ logbook reconstruction series (b) by Hannaford et al. (2015), and, for comparison, the 19th-century section of a width-based tree ring rainfall reconstruction (a) for western Zimbabwe by Therrell et al. (2006). With the exception of the Cape Winter Rains series, all are for areas of southern Africa that receive rainfall predominantly during the summer months. 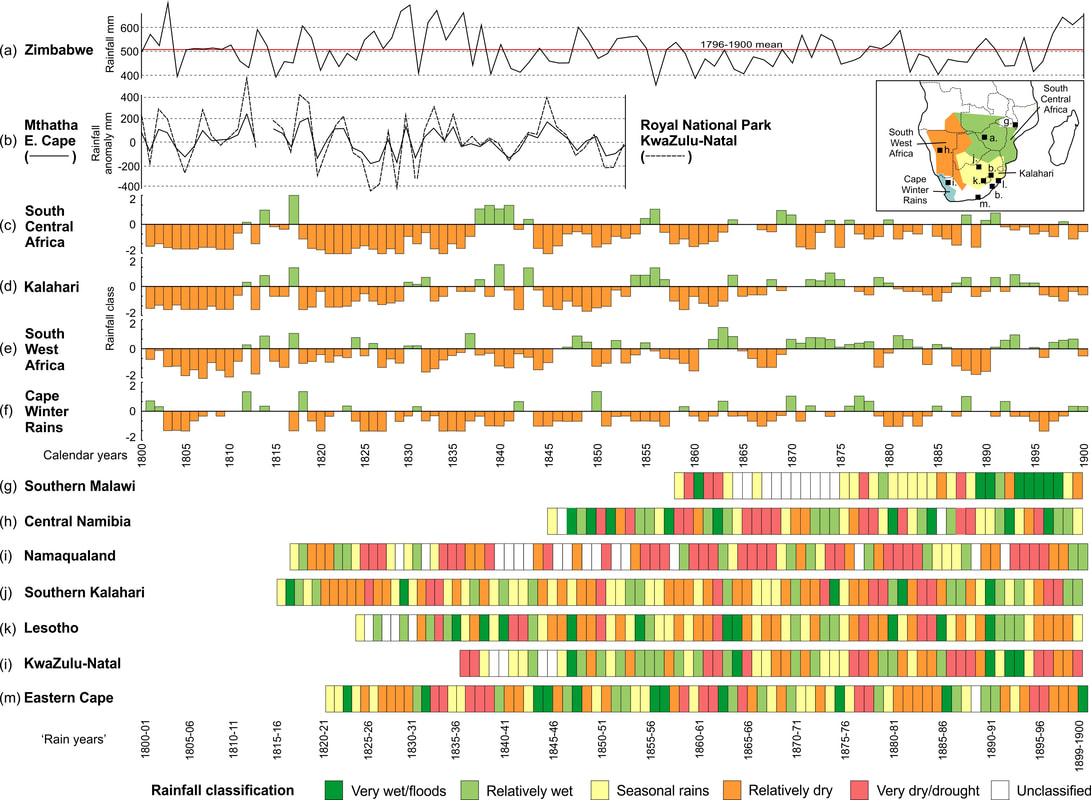 Fig. 2. Annually-resolved rainfall reconstructions for southern Africa, spanning the 19th century. (a) Tree-ring width series by Therrell et al. (2006); (b) Ships’ logbook-based reconstructions by Hannaford et al. (2015); (c-f). Combined documentary and rain-gauge reconstructions by Nicholson et al. (2012); (g-m) Documentary-based reconstructions by (g) Nash et al. (2018), (h) Grab and Zumthurm (2018), (i) Kelso and Vogel (2007), (j) Nash and Endfield (2002, 2008), (k) Nash and Grab (2010), (l) Nash et al. (2016), (m) Vogel (1989). This compilation shows that, in the 19th century, rainfall varied from place to place across southern Africa. However, we can identify a number of droughts that affected large areas of the subcontinent. Droughts, for example, stretched across southern Africa in the mid-1820s, mid-1830s, around 1850, early-mid-1860s, late-1870s, early-mid-1880s and mid-late-1890s. We can also pinpoint a smaller number of coherent wetter years: in, for example, the rainy seasons of 1863-1864 and 1890-1891. Analyses that use many different climate "proxies" - that is, sources that register but do not directly measure past climate change - indicate that the early-mid 1860s drought was the most severe of the 19th century, and that of the mid-late-1890s the most protracted (see, for example, studies by Neukom et al., 2014, and Nash, 2017). The inset map in Figure 2 reveals that a number of rainfall series overlap in their geographical coverage, which allows a direct comparison of results. In some cases, the overlap is between series created using very different methodologies. For the most part, there is good agreement between these overlapping series, but there are some significant differences. The rest of this article will focus on two of these periods of difference: the 1810s in southeast Africa, and the 1890s in Malawi. How dry was the first decade of the 19th century in southeast Africa? Four rainfall series are available for southeast Africa for the first decade of the 19th century (Figure 3) – documentary series for South Central Africa and the Kalahari (by Nicholson et al., 2012), a tree-ring series for Zimbabwe (Therrell et al., 2005), and a ships’ log series for KwaZulu-Natal (Hannaford et al., 2015). Collectively, these series suggest that there was at least one major drought that potentially affected much of the region. This was a very important time in the history of southeast Africa. The multi-year drought is remembered vividly in Zulu oral traditions as the ‘mahlatule’ famine (translated as the time we were obliged to eat grass). Scholars have seen it as a trigger for political revolution and reorganization, one that ultimately led to the dominance of the Zulu polity. 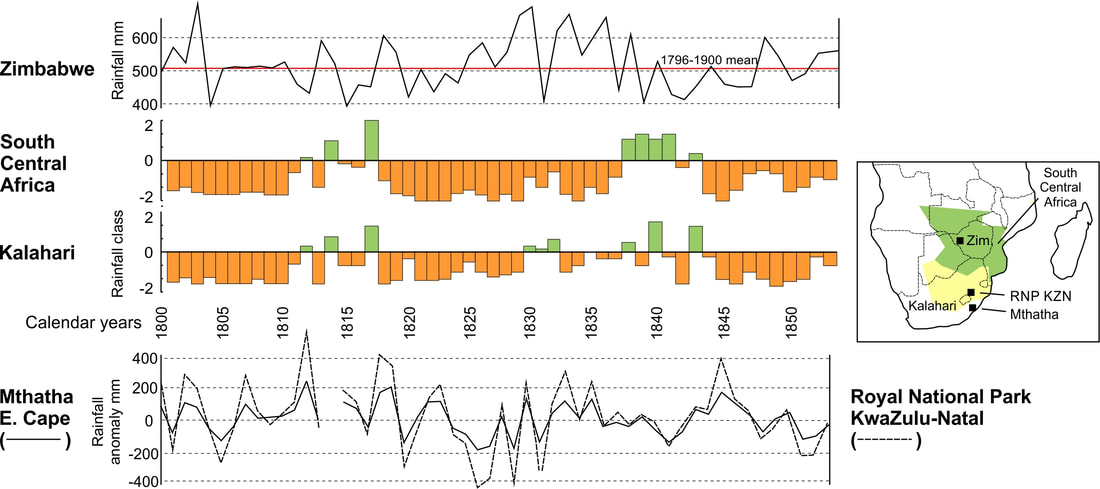 Fig. 3. Comparison of three annually-resolved rainfall reconstructions for southeast Africa for the first half of the 19th century, including the tree ring series for Zimbabwe by Therrell et al. (2006), the combined documentary and rain-gauge reconstructions for South Central Africa and the Kalahari by Nicholson et al. (2012), and the ships’ logbook reconstructions for southeast South Africa by Hannaford et al. (2015). The inset map shows the location of each series. Yet there are some discrepancies between the overlapping records, which have important implications for our understanding of relationships between climate change and society. For example, while the documentary-based South Central Africa series in Figure 3 suggests protracted drought from 1800 to 1811, the overlapping tree ring series for Zimbabwe infers periods of average or above-average rainfall, alternating with drought. A similar contrast is shown between the documentary-based Kalahari series (which encompasses the southern Kalahari but extends to the east coast of South Africa) and the overlapping ships’ logbook-based reconstruction for Royal National Park, KwaZulu-Natal. Since these series are based on different evidence, it is impossible to tell which is more likely to be ‘right’. However, the rainfall series based on documentary evidence are clearly less sensitive to interannual rainfall variability than those based on ships’ log data or tree rings, at least for the early 19th century. This is surprising, as a major strength of documentary evidence is normally the way that it captures extreme events. The reasons for these discrepancies are unclear, but are likely to be methodological. The Africa-wide rainfall series by Nicholson and colleagues, from which the South Central Africa and Kalahari series in Figure 3 are derived, is a model of research transparency – it identifies the evidence base for every year of the reconstruction, with all documentary and other data made available via the NOAA National Climatic Data Center. Inspection of this dataset indicates that the reconstructions for the early 1800s in southern Africa are based on a limited number of published monographs and travelogues, written mainly by explorers. While these are likely to include eyewitness testimonies, there is potential for bias towards drier conditions. The majority of authors were western European by birth and, in some cases, their writings reflected their first travels in the subcontinent. It wouldn’t be at all surprising if they found southern Africa significantly drier than home. How dry was the last decade of the 19th century in Malawi? The collective evidence for rainfall variability around present-day Malawi during the mid-late 19th century is shown in Figure 4. Here, two rainfall reconstructions overlap: the first, a reconstruction for three regions of the country based primarily on unpublished documentary evidence by Nash et al. (2018); and the South Central Africa series and adjacent rainfall zones of Nicholson et al. (2012). 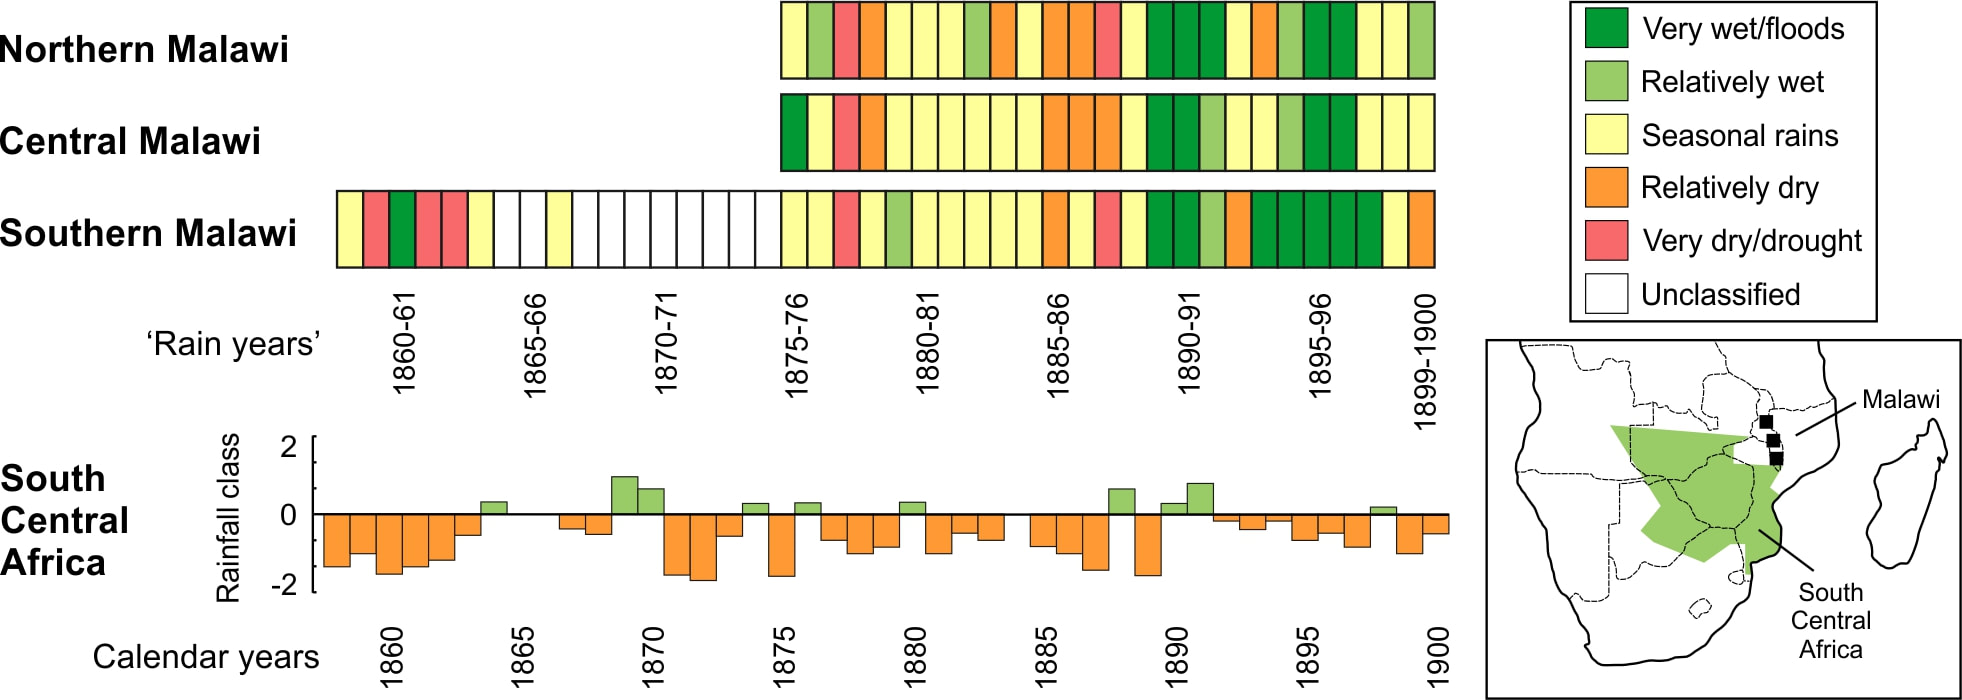 Fig. 4. Comparison of two annually-resolved rainfall reconstructions for southeast Africa for the second half of the 19th century, including a documentary-based reconstruction for three regions of Malawi (Nash et al., 2018), and the combined documentary and rain-gauge reconstruction for South Central Africa by Nicholson et al. (2012). The inset map shows the location of each series. Extreme events, such as the droughts of the early-1860s, mid-late-1870s, and mid-late-1880s, and a wetter period centred around 1890-91, are visible in both reconstructions. However, there are discrepancies in other decades, most notably during the 1890s where the Nicholson series indicates mainly normal to dry conditions, and the Nash series a run of very wet years. Delving deeper into the documentary evidence underpinning the Nicholson series suggests that the discrepancies may again be methodological, and strongly influenced by source materials. As with the other regional reconstructions for southern Africa, the Nash study bases annual classifications on average conditions across a large body of mainly unpublished primary documentary materials. Nicholson, by contrast, uses smaller numbers of mainly published documentary materials, combined with rain gauge data. An over-emphasis of references to dry conditions in these documents, combined with an absence of gauge-data for specific regions and years, could therefore skew the results. The way forward? There are two main take-home messages from this article. First, on the basis of a comparison of annually-resolved southern African rainfall series, documentary data appear less sensitive to precipitation variability than other types of proxy evidence, even for some extreme events. Discrepancies are most apparent for periods of the early 19th century, where documentary evidence is relatively sparse. Second, different approaches to reconstruction may produce different results, especially where documentary evidence is combined with gauge data. The summative approach used by Nicholson and colleagues, for example, where individual quotations are classified, summed and averaged, may be much more sensitive to bias from individual sources when data are sparse. Having identified these potential issues, one way forward might be to run some experimental studies using different approaches on the same collections of documentary evidence to assess the impact of methodological variability on rainfall reconstructions. This would be no small task, as it would mean re-analyzing some large datasets. However, it would confirm or dismiss the suggestions made here about the relative effectiveness of different methodologies. These experimental studies would help us to identify the "best practice" for reconstructing African rainfall. They would allow us to improve the robustness of the baseline data available for understanding historical rainfall variability in the continent likely to be most severely impacted by future climate change. They would also permit us to refine our understanding of past relationships between climatic fluctuations and the history of African communities. These relationships may offer some of our best perspectives on the future of African societies in a warming planet. Works Cited:
Brázdil, R. et al. 2005. "Historical climatology in Europe – the state of the art." Climatic Change 70: 363-430. Grab, S.W. and Zumthurm, T. 2018. "The land and its climate knows no transition, no middle ground, everywhere too much or too little: a documentary-based climate chronology for central Namibia, 1845–1900." International Journal of Climatology 38 (Suppl. 1): e643-e659. Hannaford, M.J. and Nash, D.J. 2016. "Climate, history, society over the last millennium in southeast Africa." Wiley Interdisciplinary Reviews-Climate Change 7: 370-392. Hannaford, M.J. et al. 2015. "Early-nineteenth-century southern African precipitation reconstructions from ships' logbooks." The Holocene 25: 379-390. Kelso, C. and Vogel, C.H. 2007. "The climate of Namaqualand in the nineteenth century." Climatic Change 83: 257-380. Nash, D.J., 2017. Changes in precipitation over southern Africa during recent centuries. Oxford Research Encyclopedia of Climate Science, doi: 10.1093/acrefore/9780190228620.013.539. Nash, D.J. and Endfield, G.H. 2002. "A 19th century climate chronology for the Kalahari region of central southern Africa derived from missionary correspondence." International Journal of Climatology 22: 821-841. Nash, D.J. and Endfield, G.H. 2008. "'Splendid rains have fallen': links between El Nino and rainfall variability in the Kalahari, 1840-1900." Climatic Change 86: 257-290. Nash, D.J. and Grab, S.W. 2010. "'A sky of brass and burning winds': documentary evidence of rainfall variability in the Kingdom of Lesotho, Southern Africa, 1824-1900." Climatic Change 101: 617-653. Nash, D.J. et al. 2018. "Rainfall variability over Malawi during the late 19th century." International Journal of Climatology 38 (Suppl. 1): e649-e642. Nash, D.J. et al. 2016. "Seasonal rainfall variability in southeast Africa during the nineteenth century reconstructed from documentary sources." Climatic Change 134: 605-619. Neukom, R. et al. 2014. "Multi-proxy summer and winter precipitation reconstruction for southern Africa over the last 200 years." Climate Dynamics 42: 2713-2716. Nicholson, S.E. et al. 2012. "Spatial reconstruction of semi-quantitative precipitation fields over Africa during the nineteenth century from documentary evidence and gauge data." Quaternary Research 78: 13-23. Nicholson, S.E. et al. 2018. "Rainfall over the African continent from the 19th through the 21st century." Global and Planetary Change 165: 114-127. Pfister, C. 2018. "Evidence from the archives of societies: Documentary evidence - overview". In: White, S., Pfister, C., Mauelshagen, F. (eds.) The Palgrave Handbook of Climate History. Palgrave Macmillan, London, pp. 37-47. Therrell, M.D. et al. 2006. "Tree-ring reconstructed rainfall variability in Zimbabwe." Climate Dynamics 26: 677-685. Vogel, C.H. 1989. "A documentary-derived climatic chronology for South Africa, 1820–1900." Climatic Change 14: 291-307.  This site explores interdisciplinary research into climate changes past, present, and future. Its articles express my conviction that diverse approaches, methodologies, and findings can yield the most accurate perspectives on complex problems. To contextualize modern warming, for example, we can reconstruct past climate change using models developed by computer scientists; tree rings or ice cores examined by climatologists; and documents interpreted by historians. We gain far more by using these sources in concert than we would by examining each in isolation. Yet we must approach such interdisciplinarity with caution. The problems presented by climate change scepticism provide lessons for academics crossing disciplinary boundaries, and for policymakers, journalists, and laypeople interpreting interdisciplinary findings. In academia, climate change scepticism is usually interdisciplinary. To attack climate change research, academic sceptics use credibility and, occasionally, scholarly methods accrued in relevant disciplines but often unrelated fields. For example, in the late 1980s and 1990s, eminent physicists William Nierenberg and Fred Seitz were among the most outspoken critics of the global warming hypothesis. According to historians of science Naomi Oreskes and Erik Conway, the scepticism expressed by Nierenberg and Seitz grew, in part, from their belief that the ends of supporting unfettered capitalism justified the means of deliberately distorting scientific evidence (Oreskes and Conway, 190). However, another part – perhaps the most damaging – emerged from the conviction that their disciplinary backgrounds gave them special insight into climate change research  Physicists – including one of our own editors – play a crucial role in modelling and interpreting climate change. Yet not all physicists are alike. Nierenberg was a renowned nuclear physicist who oversaw the development of military and industrial technologies for exploiting the sea. Seitz developed one of the first quantum theories of crystals, and contributed to major innovations in solid-state physics. Owing to their similar academic backgrounds, both Nierenberg and Seitz distrusted the lack of certainty in climate modelling, and both would have despised the occasionally fuzzy probabilities that must accompany climate history. Their scepticism effectively takes the most tenuous elements of climate science and argues that they are not science, because “real scientists” know better. These attitudes highlight one of the most important but least appreciated aspects of interdisciplinary research: humility. When we step into another field, we step into another culture with characteristics that often have sound reasons for existing. Before challenging assumptions that inform a discipline, we should thoroughly learn the language, methods, and concepts of scholars in that discipline. Only then can we appreciate their findings. Climate scepticism can also reveal that differences between subfields within academic disciplines can be more significant than distinctions between those disciplines. An environmental historian, for instance, can have much more in common with a climatologist than a postmodern cultural historian. Another example: Fred Singer is an atmospheric physicist who played an important role in developing the first weather satellites. However, he has little respect for the methods or conclusions of mainstream climate research. In 2006, Singer told the CBC’s The Fifth Estate that “it was warmer a thousand years ago than it is today. Vikings settled Greenland. Is that good or bad? I think it's good.” In an interview with The Daily Telegraph three years later, he acknowledged that “we are certainly putting more carbon dioxide in the atmosphere.” However, he argued that “there is no evidence that this high CO2 is making a detectable difference. It should in principle, however the atmosphere is very complicated and one cannot simply argue that just because CO2 is a greenhouse gas it causes warming.” Vikings did settle in Greenland, and the atmosphere is very complicated. However, global temperatures are warmer now than they were a millennium ago, and we can certainly trace relationships between modern warming and atmospheric concentrations of CO2. Singer may be an atmospheric physicist, but he is hardly qualified to offer any observations on the state of climate change research. 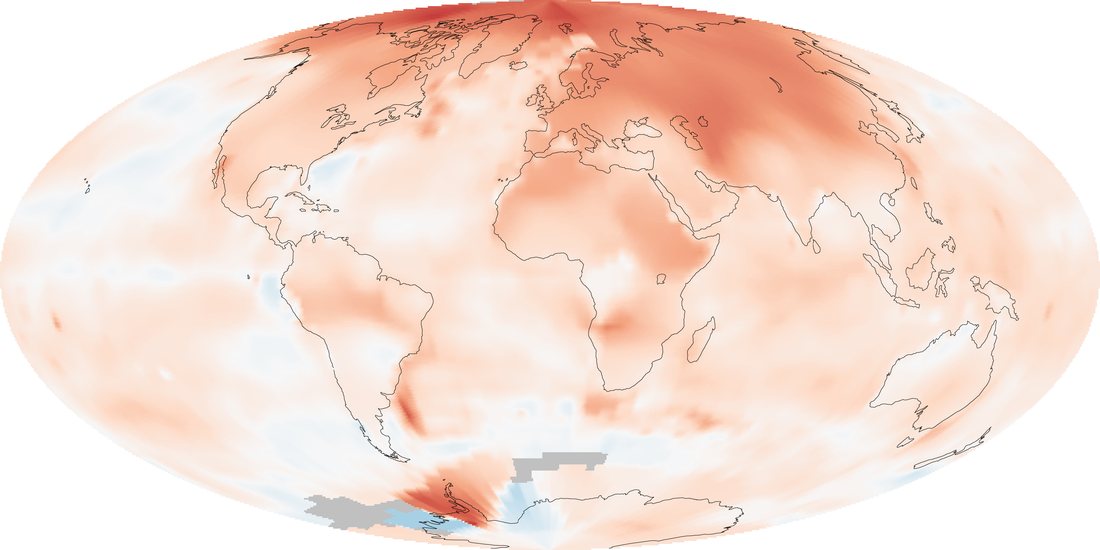 Global temperature anomalies (redder is warmer) from 2001-2009, relative to the average from 1951-1980. NASA images by Robert Simmon. Distinctions between different kinds of scientists – and different agendas among scientists – are always worth remembering when exploring the study of climate change. In a recent article, the popular website Reporting Climate Science described a disagreement between physical oceanographer Jochem Marotzke and meteorologist Piers Forster on the one hand, and “climate scientist” Nic Lewis on the other. Marotzke and Forster recently published an article in the journal Nature that confirmed the reliability of climate models for predicting climate change. Lewis accused them of circular reasoning and basic mathematical and statistical errors.
Lewis is, in fact, a retired financier with a degree in mathematics, and a minor in physics, from Cambridge University. Does that make him a climate scientist? He is certainly qualified to challenge mathematical approaches, and he does not deny the basic physics of anthropogenic climate change. For policymakers, journalists, and even scholars in different disciplines, it can be difficult to discern with what authority he speaks. Similar problems are at work in another recent academic debate. This one unfolded in the pages of the Journal of Interdisciplinary History. As described on this website, two economists took issue with the notion of a “Little Ice Age” between the fourteenth and nineteenth centuries. They waded into an established field – climate history – and assailed one of its most important themes – the existence of a Little Ice Age – without appreciating the methods and findings of recent scholarship. For example, they used a graph of early modern British grain prices as a direct proxy for contemporary changes in temperature. But those grain prices were influenced by so many human variables that, for modern scholars, they can, at best, suggest only how one society responded to climate change. While attacking the rigour of climate reconstructions, the economists actually introduced data that is far less rigorous than climate historians use today. Within academia, most instances of climate change scepticism are case studies of interdisciplinary approaches gone wrong. Interdisciplinarity can help us approach thorny issues in new ways, but such work should be collaborative. When adherents of one discipline or field dictate to those in another, the results are usually destructive. ~Dagomar Degroot Note: the cover photo was taken by our editor, Benoit Lecavalier, during a recent trip to Greenland. Contributing Author: Benoit S. Lecavalier 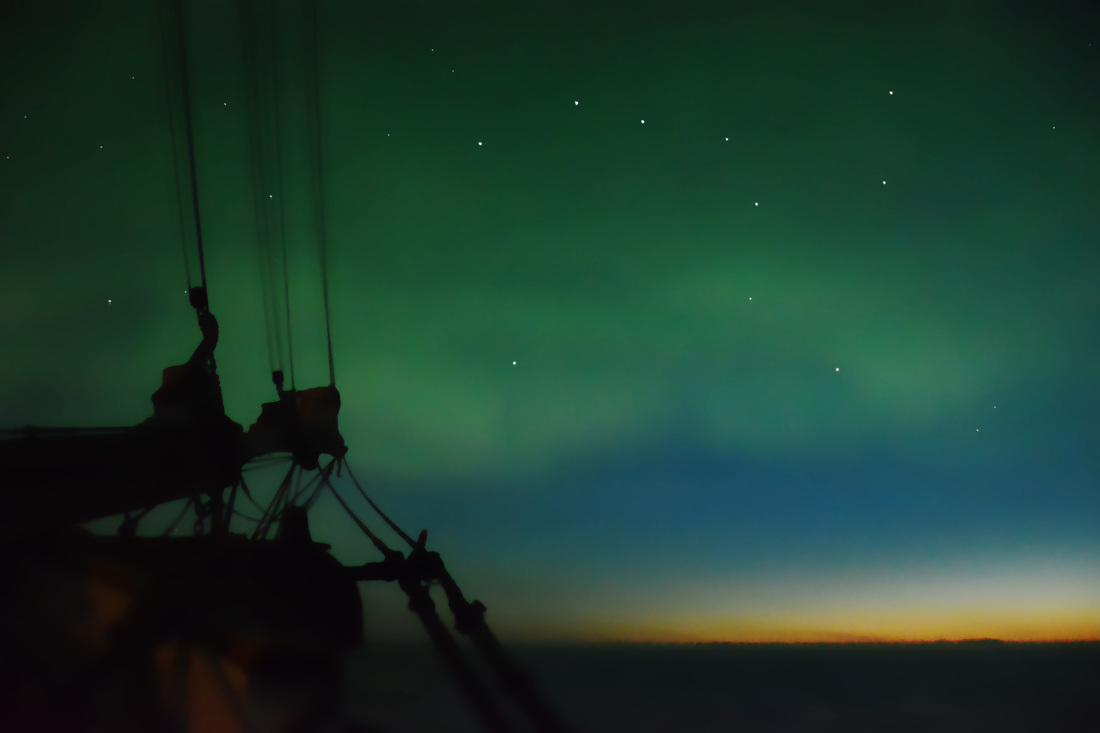 Permanent twilight and the northern lights during a night watch. The Greenland ice sheet is melting fast, and it contains enough water to raise global sea levels by over seven meters if it were to disappear entirely. However, thousands of years ago the ice sheet was much larger, with a total of 12 metres ice-equivalent sea-level. There are many questions that remain unanswered about how Greenland lost all this ice from past to present. For example: how and where did the Greenland ice sheet lose mass? What climate history resulted in such a drastic change in the ice sheet? This summer, these were the questions that led a multidisciplinary team of geologists, geophysicists, biologists, and biogeologists to Southeast Greenland. We were embarking on an expedition to better understand its climate history, and so resolve part of a much bigger story. We were going to the Arctic by ship to take advantage of the best weather it had to offer for the summer 2014 field season. As we waited in Reykjavik with our equipment, our ship - the last sailing vessel built of wood with ice plating for navigating Arctic waters - was traveling from Denmark to Iceland. It was called the Activ, and it was an old-fashioned schooner with three masts and fourteen sails. On the way to its destination, the ship had to cross the rough waters of the Denmark Strait, where we had to endure three days of seasickness. 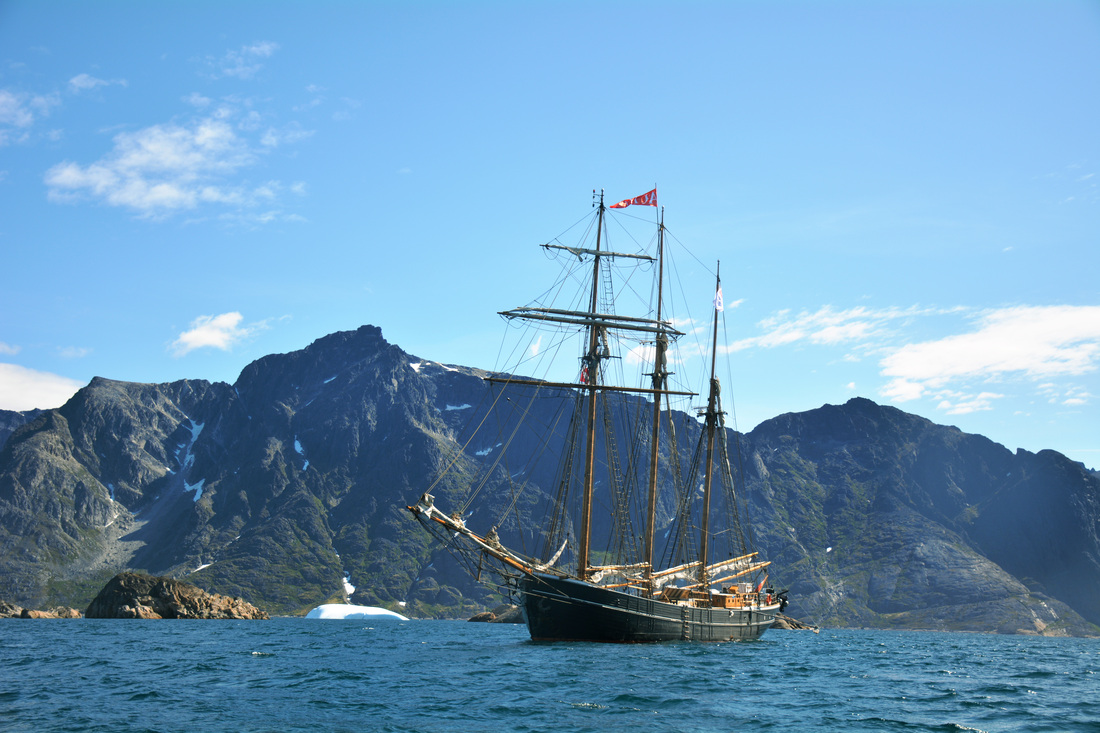 The Activ. Fog descended upon the ship as we approached the Greenlandic coast. The ship navigated carefully past icebergs in search of shallow water to anchor for the evening. There was little room for error: in emergencies we depended entirely on satellite phones, and even by helicopter we were hours from the nearest town. Finally, we sailed into a fjord and found a proper place to anchor, before preparing the inflatable motor boats that would ferry us to and from our research sites. The fjords along the coast were carved over thousands of years by the expansion and retreat of the ice sheet. Because they were flooded by the sea when the ice retreated, for us they were a valuable inlet to the Greenlandic interior. We got there by motor boat, hoping to collect rock samples for cosmogenic dating. As the ice sheet receded, boulders were no longer covered by ice that had shielded them from bombardment by cosmic rays. When these particles from space blasted into the rock, specific isotopes were produced in the minerals (Beryllium-10; 10Be), and as time passed they accumulated. Today, scientists can determine how long the rock has been ice-free by measuring the quantity of Beryllium in a sample. In that way, they can infer the position of the ice sheet at a given time. 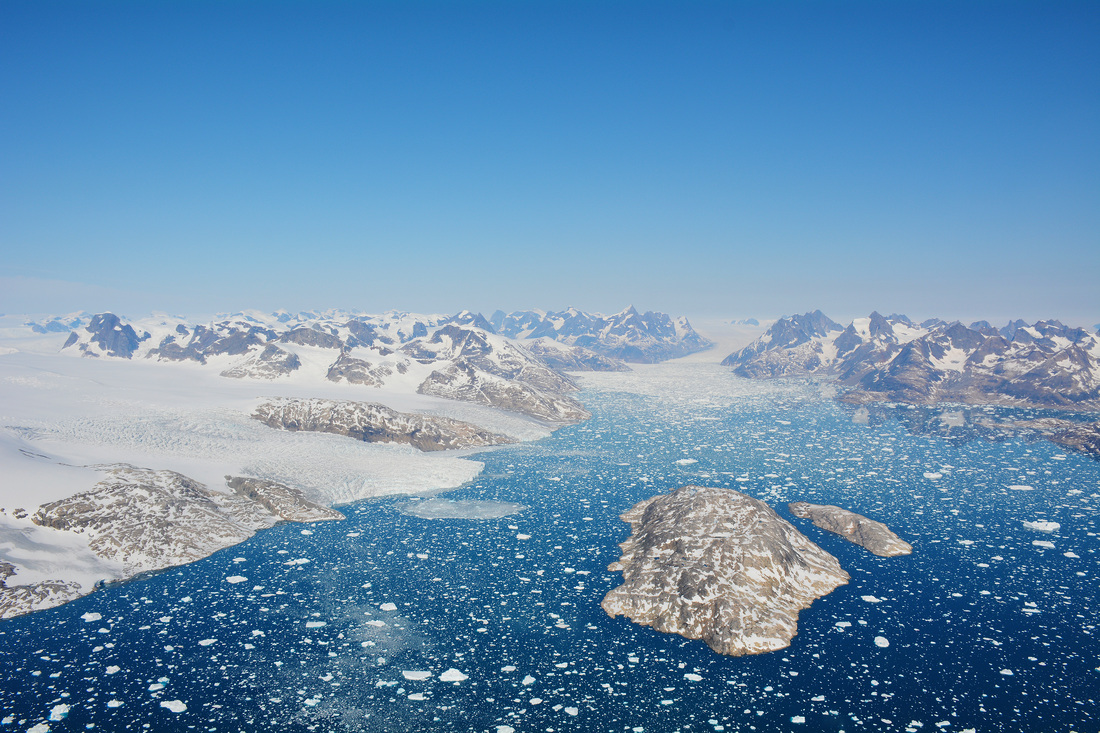 Helicopter ride over the ice sheet. At the end of the day, the motorboat was always weighed down by numerous samples, and the commute back to the ship was always long. On our return, we would weave between newly calved icebergs, often passing seals and birds, before finally arriving back home to the ship, with warm food waiting for us. After dinner, decisions were made on where to head next. With the anchor raised, the goal was usually to sail southward through the night. Night shifts were assigned so that there were always two iceberg watchers at the bow of the ship and two people on the bridge concerned with steering. At this latitude and time of year the sun barely dips below the horizon, resulting in a state of permanent twilight. On a foggy night we had to be ready in a moment’s notice to call out an iceberg, while on a clear night we could enjoy the peaceful tranquility of water and wind flowing past the ship. 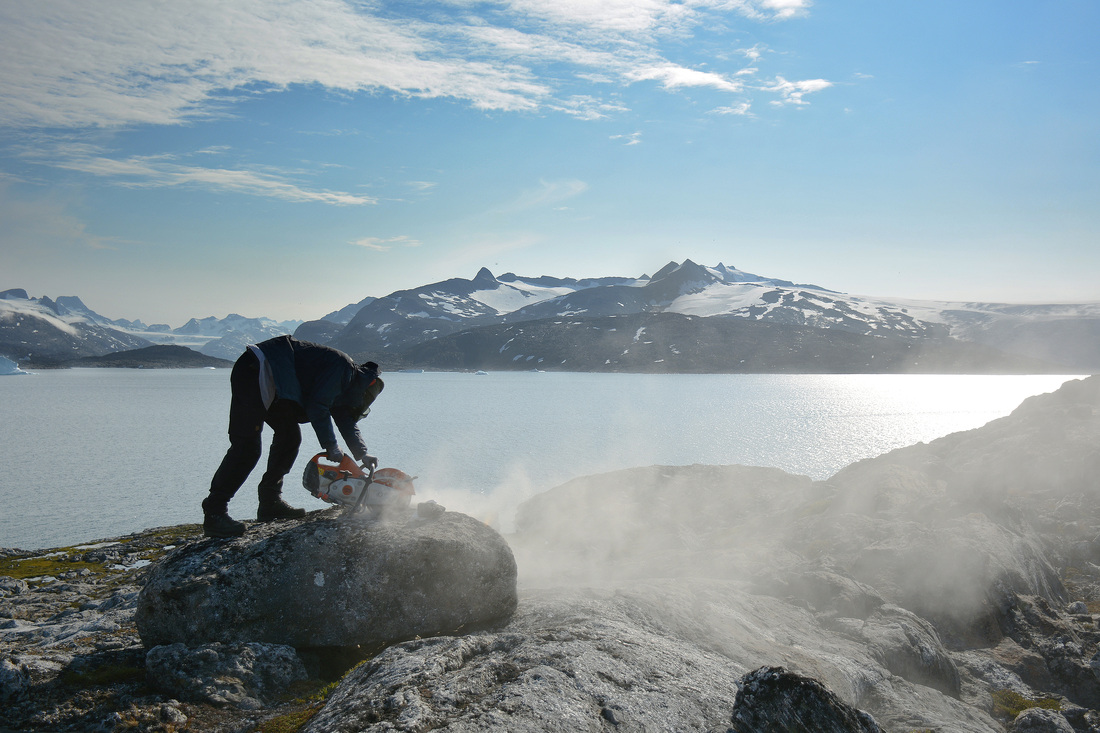 Collecting cosmogenic samples. By early August we anchored in a bay within a major fjord in southern Greenland, with the intention of collecting samples for several days. Using the motorboat we traveled near an isolation basin, a lake that had once been connected to the ocean. Thousands of years ago, the ice sheet extended farther at the margins. The weight of the ice deformed the Earth, depressing the crust lower than it presently lies. As the ice receded, the crust rebounded, which disconnected some basins at the coast from the ocean and created new lakes. We collected cores of the sediments at the bottom of these lakes, since they document the microfossil remains of organisms (foraminifera) that inhabited the area. By dating the transition from saltwater to freshwater organisms, we discovered when the basin was separated from the ocean. Given the current elevation of the lake and time of isolation, we acquired an inference for past sea level. One morning, at the break of dawn, the water was calm yet we heard splashing by the side of the boat. A few minutes later, we left the galley and went up on deck for a day’s work. Suddenly, we noticed that the motor craft was torn and deflated with the emergency kit missing (it had included flares and chocolate, among other things). A polar bear was on the coast tearing through the kit. As we watched, the bear decided he wanted more. He dove back into the frigid water and swam towards us. In a panic we lifted the motor boats, loaded some rifles and carefully watched the bear try to get on board. The bear circled the boat again and again, like a shark. He was attempting to grab on a ridge along the boat when we decided to fire some warning shots. The polar bear quickly fled to the coast where he would remain all day, preventing us from going out and taking more samples. 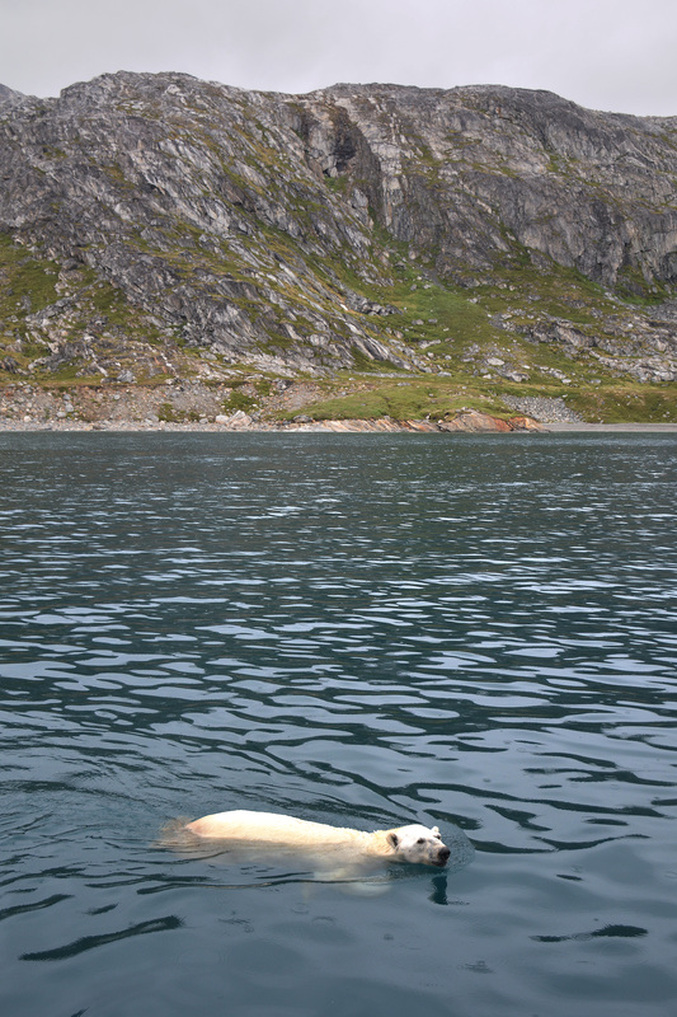 Polar bear looking for a meal. The days passed, we collected more samples, and we continued southward into Prince Christian Sound – a fjord complex that separates the mainland from the southernmost tip of Greenland. As we neared the end of our expedition, we finally began to encounter small isolated coastal communities. We sailed from village to village, from Augpilagtoq to Nanortalik, and then to Qaqortoq, where we officially disembarked. We helicoptered to Narsarsuaq where we said goodbye to Greenland, its vast, pristine landscape, its mountains and wildlife, and its ice. We disbanded and flew our separate ways, where new challenges awaited us. Only upon returning to our respective institutions could we begin to interpret the samples we had collected. The samples will become data, and the data will implemented in models. It is a long process which will ultimately improve how ice sheet models behave. The models must accurately simulate ice retreat to remain consistent with cosmogenic dates. They must unload adequate amounts of ice for the Earth to deform and sea level to change, to coincide with the observations from isolation basins. This procedure will retune and calibrate Greenland ice sheet models, revise their simulations of climate forcing, and increase our level of confidence in our model predictions. It began on a ship navigating never-before sampled areas of Greenland, and it ends as ones and zeros on a super computer. The aim: to better understand how the Greenland ice sheet responded to past climate change, to better predict how it might respond to a warmer future. More photographs from the Arctic:The team:Scientists:
Nicolaj Larsen Kurt Kjær Antony Long Svend Funder Benoit Lecavalier Anders Bjørk Kristian Kjeldsen Peter Ilsøe Laura Levy Anne-Katrine Faber Sarah Woodroffe Willi Winrebe Johan Spens Micaela Hellstrom Crew: Jonas Bergsøe (Captain) Jeppe Møhl Gonzalo Guarda Birk Jessing Aase Huggler Fram Arwyn P. 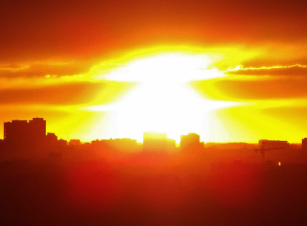 One of those brilliant Toronto sunsets One of those brilliant Toronto sunsets Note: originally posted on The Otter, blog of the Network in Canadian History and Environment. Like the research that inspired it, this article is a cultural consequence of climate change. Seven years ago, I was on a bus, reading a book about ancient climates. I looked out the window at a sunset so brilliant, it seemed to ignite Toronto's skyscrapers. I thought of global warming, and wondered: had anyone searched for connections between human history and climate change? Over the next seven years I found out that they had, but that there was still plenty of room for a new perspective. The book I was reading was the product of an academic culture increasingly affected by the growing manifestations of global warming. Years ago, its importance to me was shaped by my place among a tangle of different cultures that all included discourses about climate change. The sunset that helped me imagine new connections between ideas triggered by these cultures led to a dissertation, which explored the climate history of the Dutch Golden Age. Now completed, the dissertation reveals, in part, that culture is inextricable from the material influence of climate change. Simply put: we cannot comprehend the human consequences of climate change, past, present, and future, without understanding culture. That insight was central to the papers of my panel at the World Congress of Environmental History, which recently concluded in beautiful Guimarães, Portugal. Panelists discussed how climate change can upend delicate relationships between humans and local environments, in ways that ultimately influence culture. Thanks to funding generously provided by the Network in Canadian History and Environment, I was there to chart the ways in which a cooler early modern climate, known as the “Little Ice Age,” influenced the famous Dutch culture of the seventeenth century. My paper drew both from the last chapter of my dissertation, and from my more recent articles on Arctic environmental history. 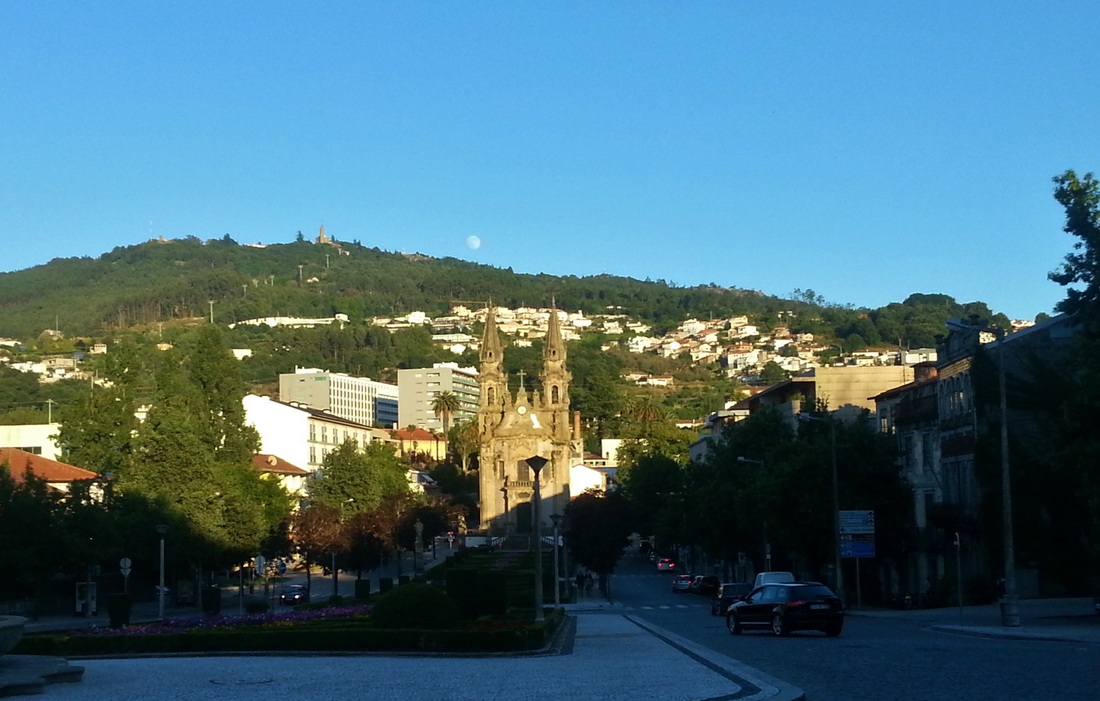 Moonrise over Guimarães, Portugal, site of the 2014 WCEH. Strangely, projected relationships between climate and culture rarely feature in the reports regularly published by the Intergovernmental Panel on Climate Change or the World Meteorological Organization. Moreover, scholars of past climates who consider cultural consequences have too often assumed that a worsening climate inspired melancholic cultural responses. Those narratives are easily dismissed by cultural historians who can readily find alternative explanations for changing artistic tastes, or shifting patterns of gendered persecution, during even the coldest decades of the Little Ice Age. Because the Dutch Republic flourished during the nadir of the Little Ice Age, examining its richly documented culture provides a rare opportunity to refine narratives that connect climate change to culture. My paper argued that literate Dutch observers, writing within a maritime culture that produced detailed records of daily weather, discerned changes in prevailing patterns of extreme weather in the seventeenth century. This partial understanding of climate change might have informed cultural responses, but I believe that we must be careful in making these connections. 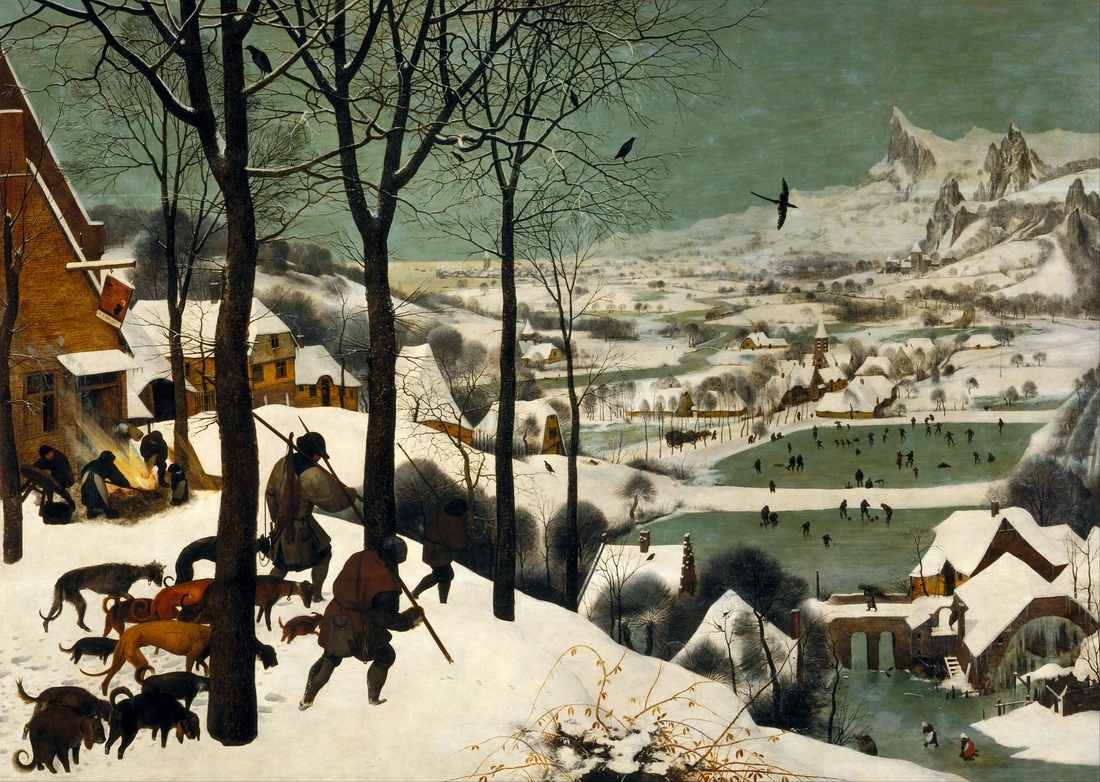 Arguably the most famous Dutch “winter landscape.” Pieter Bruegel, the Elder, “Hunters in the Snow,” 1565. Take the famous Dutch “winter landscapes” of the sixteenth and seventeenth centuries. The rise of these paintings during the onset of a particularly cold phase of the Little Ice Age appears, at first, like an especially direct cultural consequence of climate change. Certainly many scholars of past climates have argued as much. However, on closer inspection, connections between climate and culture are not so straightforward. The painters of winter landscapes often painted indoors, during years that were not especially cold, and their paintings were often heavy with mythology and allegory. Certainly they did not directly reflect contemporary weather or climate. Moreover, winter landscapes were often part of a series, which included depictions of other seasons. Finally, they were attuned to a market that had dried up by the late seventeenth century, another period of extreme cold that was nevertheless not accompanied by paintings of winter landscapes. The Dutch example therefore reveals that, in order to link climate change to cultural responses, we must carefully establish relationships between climate, weather, individuals, markets, and more. Scholars who examine the human consequences of climate change must range across so many disciplines that making assumptions can be very tempting. However, too easily connecting climate to culture can undermine other conclusions founded on more sturdy ground. Ultimately, there were some elements of Dutch Golden Age culture that probably reflected the influence of climate change. Among them: poems and illustrations that responded to distinct weather events rendered more frequent during the coldest (or warmest) decades of the Little Ice Age. Technologies like new heating devices and “ice wagons” that travelled speedily across the ice likely also reflected the cultural influence of a cooler climate. So too did the uniquely egalitarian cultures that emerged from winter carnivals, which were held on ice that was more extensive and lasted longer in the chilliest phases of the Little Ice Age. Overall, concrete cultural responses to climate change in the Dutch Republic were consequences of, or contributed to, the broader societal resilience of the Dutch to the Little Ice Age. At the WCEH, my paper and panel demonstrated once again that relationships between climate change and humanity are inexplicable without a rigorous analysis of culture. ~Dagomar Degroot
 In order to keep global warming below 2° C, there is desperate need for urgency in curbing greenhouse gas emissions. However, national and international policymakers have yet to take action on the scale that would prevent catastrophe. In the most recent issue of Nature Climate Change, Cambridge University geographer David Christian Rose explains why even the governments that have publicly acknowledged the threat of climate change have been so slow to address it. He then introduces practical ways for researchers to communicate more effectively to policymakers. Most scholars understandably assume that policy should respond to the weight of evidence. To them, influencing policy is simply a matter of articulating abundant evidence with clarity. However, Rose argues that evidence derived from “scientific rationality” is just one factor among the many that influence policy. Rose draws on principles developed by political scientist John Kingdon, who holds that even ideas backed by the best scientific evidence do not become policy unless they fit prevailing political conditions. 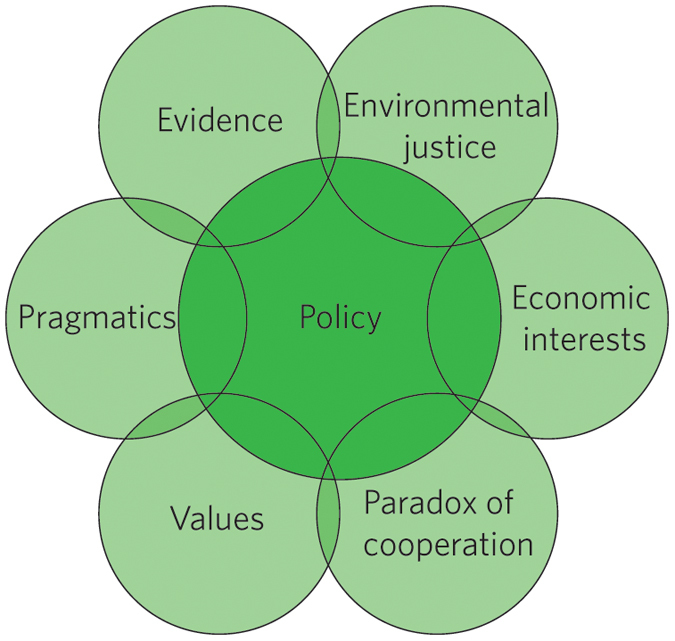 To Rose, nothing is more misguided than the continued focus on producing better evidence, undertaken most famously by the Intergovernmental Panel on Climate Change (IPCC). Increasing the certainly of anthropogenic change from 90% (in the IPCC’s fourth report), to 95% (in its fifth), does not account for the ways in which policy is actually formulated.
Rose argues that, in climate change negotiations, progress is rarely impeded by a lack of sufficiently reliable evidence. Instead, Rose claims that talks break down because of questions such as: “Who wins? Who loses? Who decides?” Scientists and other scholars should therefore figure out how their evidence can be presented to policymakers in ways that give it maximum leverage alongside other influences. Scientists and other climate researchers have a tendency to advertise the peril of inaction. Their frequently apocalyptic narratives are both evidence-based, and intended to galvanize policymakers and the public into action. However, Rose finds that telling “good news stories” can be much more effective, because policy is rarely agreed upon without concrete evidence that it will work. By better communicating these stories, academics and activists alike can demonstrate that adaptation is both possible, and applicable in policy. Finally, Rose argues that climate change policy recommendations presented by scientists should be attached to issues that are political winners. As an example, he explains that European researchers campaigning against the trade in wild birds were only able to influence policy when they tied the issue to the spread of bird flu. Given the other political influences faced by policymakers, animal welfare was a political non-starter, but public health was not. Ultimately, the guidelines presented by Rose will strike many academics as cynical recommendations that threaten to turn scientists into lobbyists. Academics, they might claim, should have an unimpeachable voice precisely because they do not employ the tactics used, for example, by big oil lobbyists. Some activists may hold that the inability of political systems to respond directly to evidence is, if left unaltered, a long-term threat to meaningful environmentalism. However, we do not live in a world where these lofty ideals can always yield practical, short-term solutions of the kind necessary to mitigate, and adapt to, global warming. Rose therefore presents a convincing case: if researchers want policymakers to take action, they should start thinking like policymakers. ~Dagomar Degroot David Christian Rose, "Five ways to enhance the impact of climate science." Nature Climate CHange 4 (2014): 522-524.  Established in 1988 by the UN and the World Meteorological Organization, the Intergovernmental Panel on Climate Change (IPCC) is a scientific body that periodically summarizes the scholarly understanding of the world’s climate. In 2007, the panel’s fourth assessment report outlined in stark terms the likelihood of anthropogenic global warming. Since then, severe storms and drought have ravaged North America, Australia and Africa, yet unusually wet, cold conditions have accompanied some European winters. Through it all carbon emissions have continued to rise, now driven largely by developing nations. Today, the IPCC’s highly anticipated summary for policymakers was finally released, in lieu of its fifth assessment report that will be published later this year. In this article, I explore this landmark report and the responses it has inspired from the perspective of a climate historian. Initially, the most striking aspect of the IPCC’s new summary for policymakers was not its content but the media reaction. The banner at CNN is currently: “A town that’s melting.” Its subheading: “climate change already happening in Alaska town.” Additional titles announce: “climate change: it’s us,” and “Miama’s rising water,” while an opinion calls for “common sense.” Not surprisingly, among major news networks the BBC has provided the most informative analysis of the IPCC’s report, and its banner, while not as large as CNN’s, nevertheless reads: “UN ‘95% sure’ humans cause warming.” Of course, the Fox News headline is in substantially smaller font, and its conclusion is characteristically fair and balanced: “Hockey Schtick: UN report ignores global warming pause.” Worse still is coverage given by the Times of India, which features only a link in diminutive font buried at the bottom of its website. Meanwhile the homepage for CCTV, a major Chinese broadcaster, contains no reference at all to the report. Taken together, headlines at the big media outlets confirm the enduring importance of partisan divisions in the global warming discussion. They also suggest that scholars, journalists, the IPCC, and indeed the UN must do more to raise awareness of global warming in countries that will be most affected by its consequences. Still, the banner headlines on many centrist news outlets in the West are encouraging. For those who have paid heed to the relentless debate about global warming, much of the action in the IPCC's fifth summary for policymakers happens in the first few pages. In previous days and weeks, so-called climate “skeptics” flooded the airwaves, encouraging rampant speculation about whether the alleged “pause” in global warming would feature prominently in the IPCC's new report. In fact, in its second page the IPCC's summary actually confirms that: 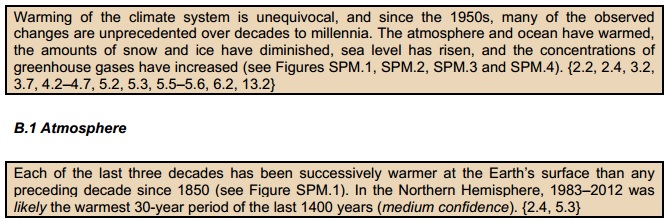 The IPCC affirmed that average global temperatures at sea and on land have risen by 0.85 degrees Celsius since 1880, although that will come as no surprise. What does impress, however, is the IPCC's explicit repudiation of the false narrative of the "pause." Climate historians know better than most that climatic reconstructions can be manipulated with ease. Start your graph of annual temperatures with a year of anomalous warmth, and you're bound to discover long-term cooling. Begin with an unusually cold year, and you'll find just the opposite. That is precisely why scholars must set their temporal and geographic parameters before reconstructing past climates. What region are we examining? For what time, and why? With what sources? What are the limitations of those sources? These questions are essential for the accurate reconstruction of past climates, and the answer can never be: "because of the expected result." Moreover, to unravel why variations in temperature occur, we must also seek the stimulus - the "forcing" - for cooling or warming. Is a volcanic eruption responsible for a few unusually cold years? Is an intense El Niño to blame for a really hot year? Neither event need contribute to a long-term climatic trend. Not surprisingly, skeptics eager to discredit the scientific consensus around global warming have ignored these questions. Instead, they have arbitrarily started their climatic reconstructions at 1998, a year of extreme warmth, in order to highlight supposed cooling since then. Unfortunately for them, the scholars of the IPCC have included this paragraph:  In other words, the presence of short-term fluctuations in climate does not throw into doubt the existence of long-term climatic trends. If anything, the impact of strong El Niño in 1998 reveals what can happen when an entirely natural event that stimulates warming compounds the the influence of anthropogenic greenhouse gases. Still, the IPCC's fifth summary did include these passages:  Those paragraphs will probably be manipulated by skeptics and misinterpreted by many journalists. While they seem to suggest that there has been a pause in the warming trend, the context matters. The surrounding passages confirm that model accuracy has improved, further strengthening projections of future warming. However, in 10 or 15-year intervals, natural signals can mask the anthropogenic warming trend. In other words, volcanic eruptions can stimulate short-term cooling, but, again, that hardly rules out long-term warming. In short intervals some natural influences will surprise scientists and confound models, because we are still learning more about the intricacies of our world's climate. Nevertheless, the big conclusions are still the same: the earth is warming, we're to blame. The IPCC's summary for policymakers also addresses climates in the more distant past. Another argument frequently advanced by skeptics holds that the Medieval Climate Anomaly - previously known as the Medieval Warm Period - was actually accompanied by hotter temperatures than we face today. Their conclusion is that modern warming isn't a big deal, and falls within natural variability. Of course, the cause of current warming is more important to climate scientists than the scale of warming to date, because it is precisely that cause which will trigger future warming far beyond anything humanity has encountered. Nevertheless, the IPCC's report also discredits the idea that medieval warmth exceeded or matched modern temperatures:  In subsequent pages, the IPCC's report describes the worrying findings presented in thousands of scientific papers during the past six years. Oceans are warming, polar ice caps are shrinking and sea levels are rising, while the atmospheric concentration of carbon dioxide, methane, and nitrous oxide have risen to levels unseen in over 800,000 years. In its most important conclusion, the panel's report reveals that greenhouse gases emitted by human activity are now 95% certain to have caused recent warming. These emissions have affected carbon cycle processes, stimulating further warming from natural sources (for example, methane hidden under melting permafrost). Meanwhile, the ocean has absorbed 30% of anthropogenic carbon dioxide, causing dangerous ocean acidification. The IPCC's fifth summary concludes that warming in the coming century will likely fall between 1.5-4 degrees Celsius. Moreover, it is more likely that warming will exceed a catastrophic 6 degrees Celsius than fall beneath 1 degrees Celsius. The lower range of this estimate is 0.5 degrees Celsius lower than it was in the IPCC's fourth assessment in 2007, owing in part to the slight divergence between model projections and climatic trends in the past decade. It is possible that the range will be adjusted upward in the IPCC's next report, as model simulations and average global warming converge again. Either way, our best guess for the future hasn't changed much: we probably face warming of approximately 3 degrees Celsius worldwide by the end of the century. 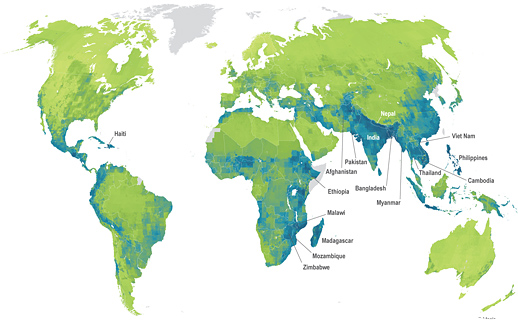 Social and environmental vulnerability to climate change, from low (pale green) to high (purple). Of course, a 3 degree Celsius rise in average global temperatures does not mean each day will be three degrees warmer, no matter where we are. In many regions, warming will be expressed in extremes: a doubling, or tripling, of days accompanied by severe heat, along with far more dangerous storms and flooding. Moreover, warming in some countries will far outstrip the global average, and demographic, social or environmental conditions already increase the vulnerability of many of these countries to climate change. In 2011, scholars at Maplecroft, a global risk analytics company, created the above map of global climate change vulnerability by analyzing 42 social, economic and environmental variables. News outlets in China and India take note: it is precisely the countries that increasingly contribute most to warming that have the most to lose. In that context, let us hope that the dire projections in the IPCC's fifth summary help moderates bridge the partisan divide to inspire concrete responses to climate change in the developed west.
~Dagomar Degroot Further reading: Climate scientist Michael Mann, author of The Hockey Stick and the Climate Wars, measures claims by climate skeptics in light of the IPCC's fifth summary for policymakers. On September 28th, the scientists of the International Geosphere-Biosphere Programme respond to the IPCC's fifth summary. 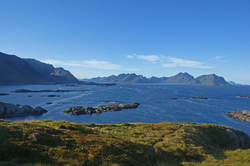 Contributing Author: Benoit S. Lecavalier August 18th, 2013 marked the start of a two week long workshop called the Advanced Climate Dynamics Course (ACDC). The venue was located in a former fishing village in the Vesterålen islands of Arctic Norway, a little place called Nyksund with a population of slightly over a dozen permanent residents. We were there for more than just hiking through the great outdoors, eating the local food, and performing local outreach. We were there to discuss what many call small talk: the climate. Organized by European and North American Universities, this event attracted internationally renowned researchers and graduate students, gathered there to discuss the climate dynamics of the last deglaciation. Twenty thousand years ago, during the last glacial maximum, the climate was cooler, the Greenland and Antarctic ice sheet were larger, and gargantuan bodies of ice rested across North America, the British Isles, and Scandinavia. Consequently, the sea-level was lower than it is today by over 120 meters. The emphasis of the workshop was to discuss how the climate system transitioned from glacial to present interglacial conditions. The seminars began by summarizing our present understanding of climate on time-scales of thousands of years. The driver, often referred to as the pacemaker for the ice ages, is the changes in the Earth’s orbit around the sun. These gradual changes in the Earth’s orbit affect incoming solar radiation at the Earth’s surface, which can either facilitate the growth of an ice sheet or deter it. However, countless feedbacks within the climate system render the situation complex. For example, ice sheet’s reflective nature deflects radiation back into space affecting the available energy at the surface. In addition ice sheets, which can rival mountain ranges in size, affect atmospheric jet streams and deflect storm tracks as well as precipitation patterns. To understand these feedbacks within the climate system we have to look at paleoclimate records: terrestrial and marine records of past climate. The following days were spent going over climate proxies, which preserve physical characteristics of past climatic conditions. These tell us about past temperatures on land and in the ocean, how vigorously the oceans circulated, and past sea-levels, among many other things. After being presented with collections of paleoclimate records, we could speculate on the role of the atmosphere and ocean during the deglaciation. The question that came came to mind: if the ice ages are driven by slow gradual changes in the Earth’s orbit around the sun, what processes, feedbacks, and mechanisms could punctuate the system with such abrupt and rapid climate change? 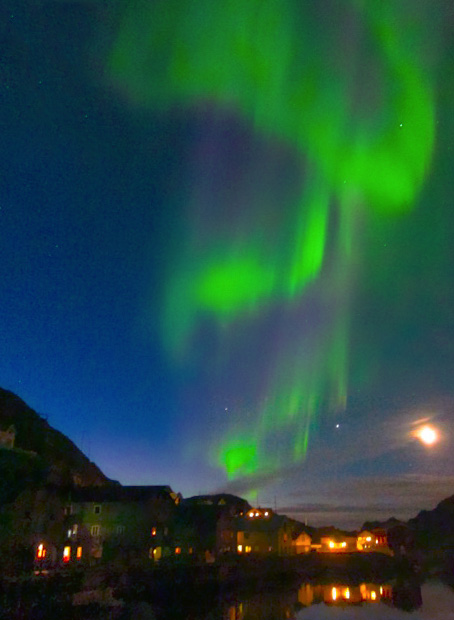 Evening in Nyksund. We reviewed the literature to investigate the consensus on what is currently understood and what observations lack a proper explanation. Our review emphasized the necessary role of geophysical modeling of the climate system to understand how all these complex processes are intertwined. State-of-the-art atmosphere-ocean general circulation models tell us about the state of the atmosphere and ocean, while glacial system models reveal the response of ice sheet to past climate change and the resulting change in sea-level. Atmosphere-Ocean models are predominantly applied for the past and future 100 years, so the question remains: what were the climatic conditions over the ice sheets thousands of years ago? What climate forcing led to ice sheet instabilities, causing the flow of iceberg armadas in the North Atlantic? To which extent did the fresh water from these icebergs affect the circulation of the Ocean? How have these changes in circulation affected global heat transport and the carbon cycle? What about global temperatures? Fortunately, we are beginning to answer these questions thanks to international cross-disciplinary collaborations, which are often initiated by workshops such as the ACDC. Many atmosphere-ocean modelers take an interest in simulating the deglacial climate, with help from the glaciological community who provide past ice sheet reconstructions. These scientists have discovered that massive ice sheets show the potential to deflect atmospheric stationary waves. The ice sheets respond to climatic shifts, and in warmer conditions they can change dynamically by releasing icebergs into the ocean. Fresh water melting from those icebergs produces density differences in the Atlantic Ocean which slows down the formation of heavy deep water, affecting global circulation. This change in ocean heat transport cools the North Atlantic, while the Southern Oceans warm in a compensating fashion. The models simulate these dramatic climate events, hinting at underlying mechanisms and illuminating the observations found in paleoclimate records. This goes a long way towards explaining how the Earth as a whole warmed out of the glaciation and why records in the North Atlantic reflect quick warming with subsequent rapid and prolonged cool period before finally stabilizing to present conditions. However, the story is far from understood, for every answer brings new questions. The workshop got everyone thinking about possible avenues of research which will have to be investigated to address our questions. That is why we gathered there in that little Norwegian village. It was to exchange ideas, data and model predictions, to work together and form collaborations, and to piece together a story that shaped humanity and still affects us today. 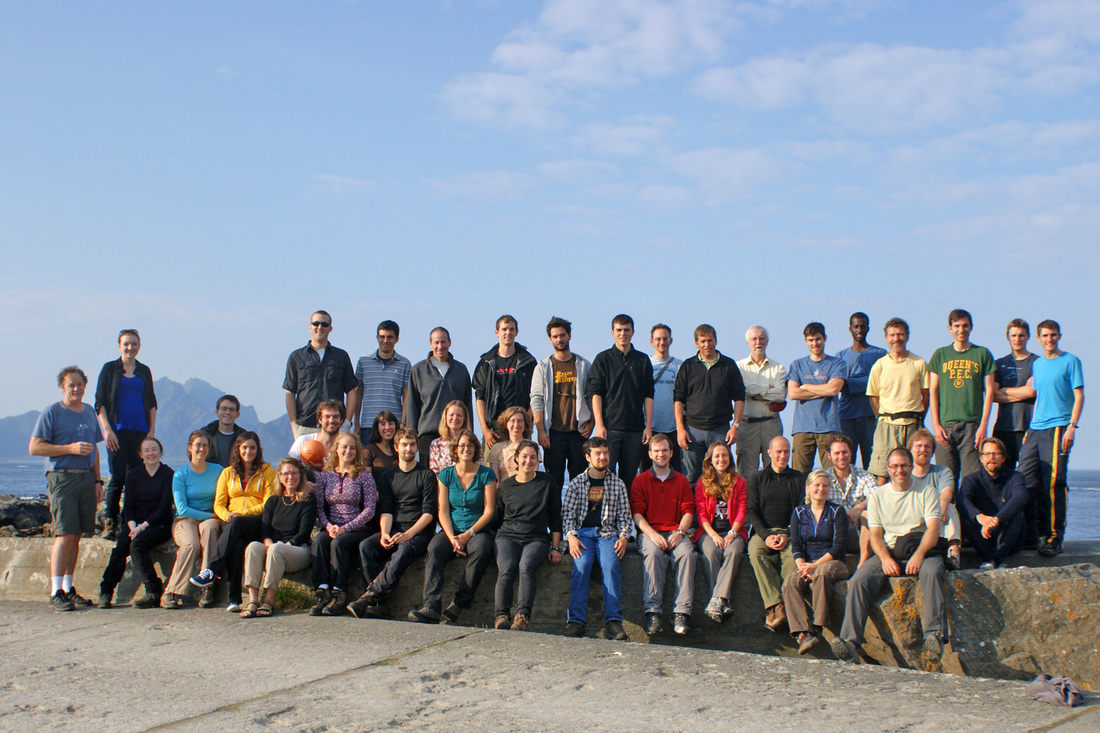 Researchers at the Advanced Climate Dynamics Course, 2013. 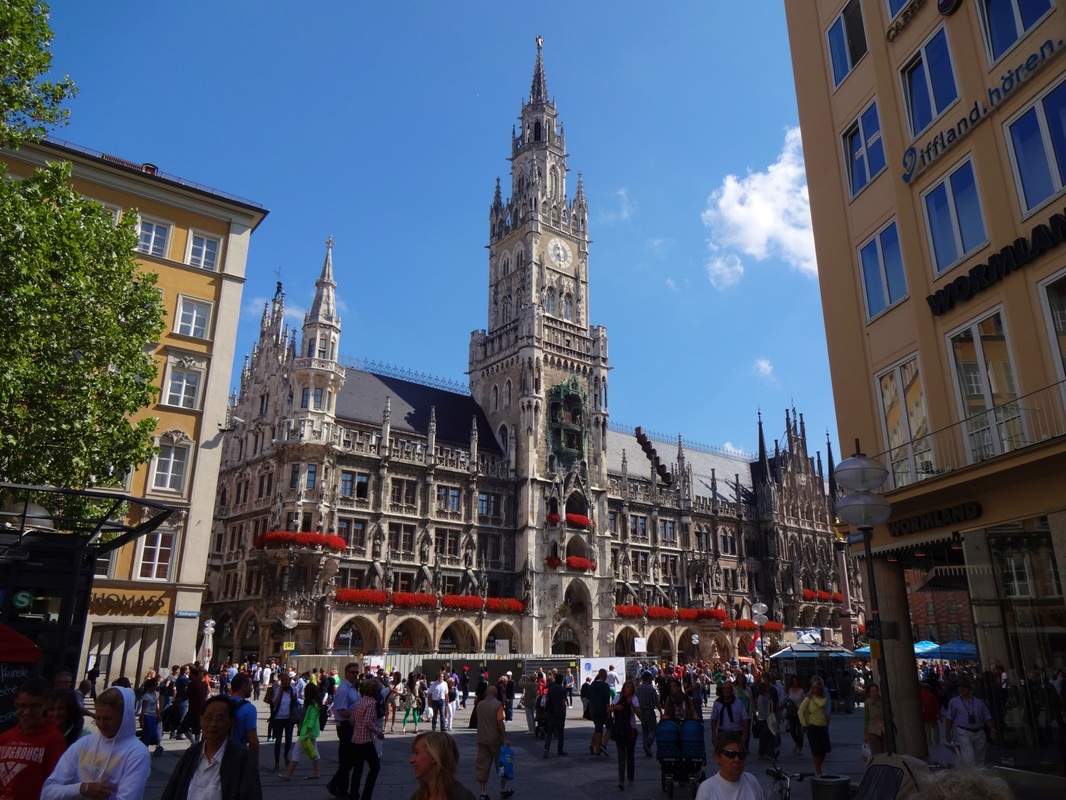 A week ago I returned from what was, surprisingly, my first trip to Germany. This year the European Society for Environmental History convened its biannual conference in Munich, a city I’ll remember for its beautiful architecture, sensible public transit and delicious beer. No fewer than fifteen climate history panels were part of the conference, and despite my best attempts I couldn't attend them all. Still, I decided to share some of what I learned (or remembered) while listening to papers that were good enough to keep me from exploring Munich. Note that for the purposes of this little article, the terms “climate history” and “historical climatology” are synonymous. 1. Climate history must be inclusive to be effective.There is only limited value in mining one kind of documentary source for evidence of past weather and, in turn, past climate change. Of course, the value of such work fluctuates with the source under investigation: registers of past events called chronicles are notoriously prone to exaggeration, for example, while ship logbooks provide standardized, easily quantifiable and remarkably reliable weather observations. Still, a reconstruction of past climate that makes any claim to accuracy must, where possible, employ a wide variety of documentary evidence compiled by many authors. These reconstructions are strengthened when meteorological information contained in some documentary sources can be verified using the data contained in other documents. They gain even more credibility alongside scientific evidence like model simulations, or statistics developed using natural archives (ice cores or tree rings, for example). Good climatic reconstructions are necessarily interdisciplinary, and we should think carefully about what we are really saying when we discuss observations written by a single author, in a single source. Are we reconstructing the climate of a vast region across the decades, or are we engaging in literary criticism? If interdisciplinary work is essential to historical climatology, interactions between sub-disciplines are just as important. Climate history is often considered a sub-discipline of environmental history, which, in turn, is one genre in the broader field of history. Agricultural history, forest history and energy history are all among the sub-disciplines that together constitute environmental history. Like climate history, they lose significance when divorced from one another. Reconstructions of past climates are fascinating, but historians can also incorporate the many different sub-disciplines and genres of their profession to do something scientists can’t: weave the history of climate into the history of humanity. The narratives we get can be as valuable as the models developed by scientists as we struggle to understand our plight on a warming planet. 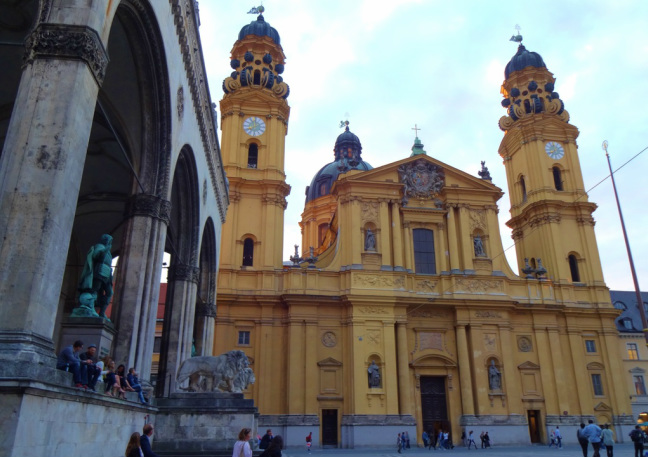 Beautiful Munich: the perfect city for a conference. 2. We're only scratching the surface of relevant documentary evidence.Chronicles and weather diaries have long formed the backbone of the documentary evidence used to reconstruct past climates. Questions of interpretation hound both sources, however, and these days, correspondence and ship logbooks are increasingly in vogue. In Munich I heard scholars like Rudolf Brázdil describe how correspondence related to the collection of taxes can yield strikingly detailed climatic reconstructions. Tax records can be placed alongside court documents, toll accounts and maintenance registers as largely quantitative sources that can yield rich climatic data if interpreted using qualitative evidence. New sources – and new methods of source interpretation - can provide data about wind patterns, hailstorms, and other previously unexamined meteorological conditions, deepening our understanding of climate change. 3. We need new ways of conceptualizing the relationship between climate change and human history.Fernand Braudel, perhaps the greatest historian of the twentieth century, introduced a revolutionary way of conceptualizing time. According to his notion of “total history,” different kinds of historical change transpire differently across time and space. Environmental or economic transformation at a vast scale spanned the centuries, yet the historical “event” was immediate. Understanding the past from this perspective allowed him to gather the entire Mediterranean world into a single narrative using the huge, lumbering structures of history. 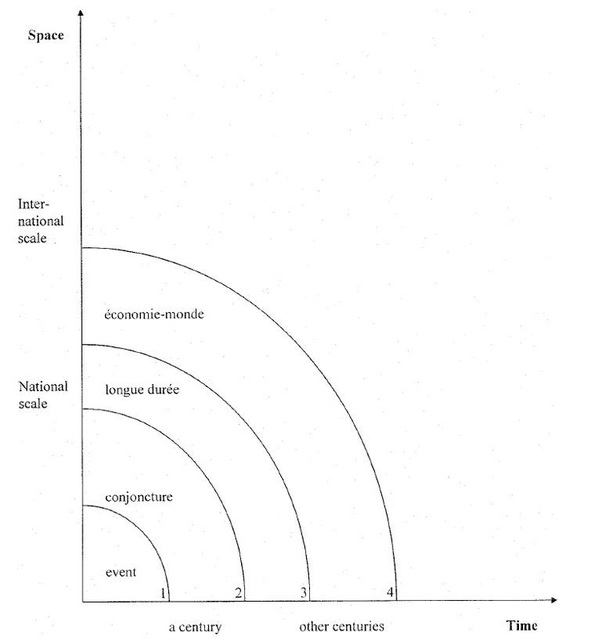 Braudel's conception of historical change. Source: http://goo.gl/MSqC4U The problem for historical climatologists – and indeed, all environmental historians – is that Braudel was wrong. Interdisciplinary research has revealed that many historical structures can be brittle; they can break quickly with immediate yet regionally specific ramifications. For example, climate change influenced by volcanic eruptions and the subsequent expansion of polar ice could alter prevailing weather patterns over the North Sea in one cruel winter. However, the same processes behind routinely cold winters in northern Europe could bring not frost but rather drought to the Mediterranean.
So different kinds of historical change can occur across many scales of time and space, and that complicates our attempt to conceptualize connections between past environments and historical events. Human history cannot be modeled – we simply lack all of the necessary variables – but in recent years environmental historians have made great progress going beyond the problematic concepts like footprint metaphor or social metabolism in their efforts to conceptualize the connections between nature and society. In this effort historical climatologists lag behind their peers, and for that reason climate histories can devolve into lists in which weather events likely stimulated by a climatic shift cause environmental changes that contribute to one event after another in the history of a particular region. Historians need to work with colleagues across many disciplines to develop ways of understanding relationships between climate, weather and human history. These ways of understanding might not completely explain the past, but they might help us conceive of historical change more clearly, with insights applicable for our future on a warming planet. ~Dagomar Degroot Note: originally posted on The Otter, blog of the Network in Canadian History and Environment (NiCHE). On February 10th I embarked on the first leg of a long voyage from Toronto to Goa, a former Portuguese enclave nestled among the beaches of western India. After enduring the concrete monolith that is Frankfurt’s international airport, I finally boarded my second flight and flew south through Turkey, past Syria, across Iran and down towards Mumbai. I left the plane at an hour past midnight. Mosquitos swarming through the airport quickly prompted me to take the malaria medication that would later give me incredibly vivid dreams. Hours later the shock of a violent landing in Goa was nothing compared to the culture shock that followed. As I left the airport and stepped onto the rust-coloured soil I saw signs promoting European luxury vehicles or American cologne towering over slums and endless trash amid lush tropical beauty. After three sunrises and two sunsets without sleep I finally arrived at my hotel, ignoring for the moment the hand-sized spider dangling near my door.  For those planning to attend next month’s ASEH conference, Toronto does not look like this. With the help of funding generously provided by Network in Canadian History and Environment (NiCHE), I had travelled nearly 13,000 kilometers to attend the fourth Open Science Meeting (OSM) organized by the Past Global Changes (PAGES) initiative. A core project of the International Geosphere-Biosphere Programme, PAGES has over 5000 subscribing scientists across more than 100 countries. Because research supported by PAGES explores past environments to create a roadmap for the future, the initiative is especially concerned with climate change. Every four years its Open Science Meeting is held in a new location, and in case the Olympic parallels were not obvious enough a “PAGES lamp” was lit at the opening ceremonies. It may not have resembled London’s burning torch, but it did avoid the mishap that embarrassed my fellow Canadians at the Vancouver Olympics. It’s easy for historians to forget that we don’t have a monopoly over the interpretation of the past. There’s nothing like a scientific conference to remind us that we can only access a tiny sliver of the very recent past, that other disciplines can find voices which speak to the present in sources beyond the documents we hold sacred. Many of the scientists at the OSM reconstructed past climates to measure the significance of modern warming, to unravel how climatic shifts influence different environments, and to provide a clearer picture of the world’s natural history. In papers and posters scientists presented results derived from the exhaustive analysis of, for example, changes in the growth of trees, the thickness of permanent ice cover and the scope of lakebed deposits. Conclusions were compared with other data that measured shifts in animal ranges, tree lines or glacial extent, all of which can be used to reconstruct changes in regional temperature or precipitation. Evidence from these so-called “proxies” was weighed against a range of sophisticated models, enabling projections of climates past that move seamlessly into the present and future. Not surprisingly, correlating fluctuations in diverse proxy records and tying them to climatic trends is hardly straightforward. Physicist Ashoka Kumar Sinhvi gave an opening keynote address that exposed the frequently overlooked complexity of linking different kinds of data between different environments at different scales, revealing the limitations of our understanding of past and future climates. Later in the day that concept was echoed by André Berger, who explained how the intricate constellation of influences that shapes the global climate is never stable, complicating the attempt to find historical analogues for our present condition. Sinhvi, Berger and others helped frame the rich data presented in the papers and posters that followed by demonstrating yet again that in science, as in history, the past is opaque, unstable, and forever subject to interpretation. Of course, that never stops us from seeking more information and, in turn, greater clarity. Some particularly fascinating papers explored past Antarctic climates at a time when the Antarctic Peninsula is warming at a rate of 5.3° C per century. Michael Weber presented findings that reveal how the Antarctic ice sheet is much more reactive to atmospheric Carbon Dioxide than previously believed. Robert Mulvaney then described how the rate of Antarctic melting, unprecedented in the past millennium, likely had analogues in the distant past when ice shelves were entirely absent. Medieval warmth and early modern cooling, familiar to historians of climates past, apparently were not felt in Antarctica. On the other hand, Guillaume Leduc presented exhaustive findings that, while skewed towards the Atlantic region, nevertheless suggested that the “Little Ice Age” between the fourteenth and nineteenth centuries strongly affected global sea surface temperatures. Those results may have critical implications for the nascent field of marine environmental history, which until now has not adequately considered climatic fluctuation. 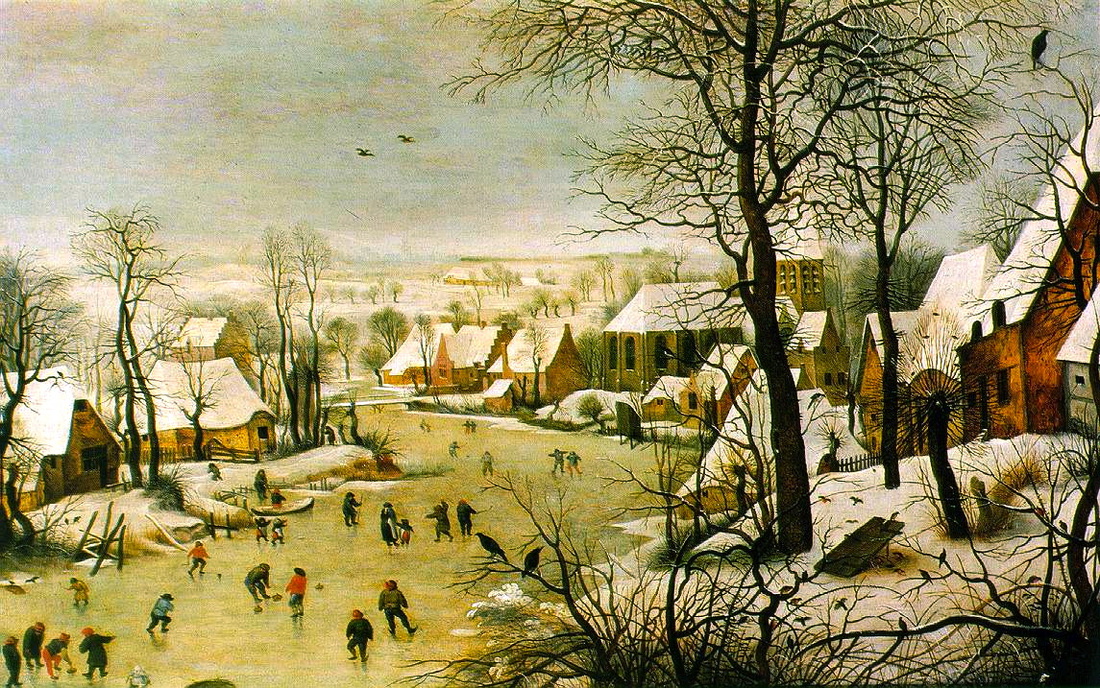 High times in the Low Countries during the “Little Ice Age.” To unravel histories that bridge culture and nature, environmental historians require some scientific literacy, yet I wasn’t sure what to expect as I prepared to give at a talk at a conference where formulas were ubiquitous and historiography unheard of. I argued that documentary evidence can improve the accuracy of reconstructions of temperature or precipitation, giving us a way of testing meteorological patterns recorded by the kinds of sources unearthed by scientists. Accustomed to the critical analysis of diverse documents, historians are ideally situated to filter documents through the kind of methodology that lets us quantify past weather observations and, in turn, reconstruct the climatic past. Moreover, while tree rings or ice cores rarely provide much more than seasonal resolution, surviving documents can record weather with far greater temporal precision, and some even chart hourly changes. Most importantly, documentary evidence grants us access to past wind intensity or direction, weather conditions that are less easily measureable through the analysis of scientific proxy data. For centuries it was necessary for European mariners to estimate longitude by calculating a ship’s speed, direction and any leeway in its course, for which the most important influence was wind. Hence many logbooks kept aboard ships abound with reliable and quantifiable meteorological information taken several times on virtually every day of the vessel’s journey. The bulk of my talk presented results from English and Dutch ship logbooks, which suggest that easterly winds increased in the late seventeenth century as the climate cooled across the North Sea. I was relieved and delighted by the reception I received from the scientists in the audience. More importantly, it was heartening to see the importance of interdisciplinary cooperation in the new “Future Earth” project spearheaded by the International Geosphere-Biosphere Programme. Still, many scholars in both the sciences and the humanities continue to take a passive approach to building connections between disciplines. Conferences like the PAGES OSM have existed for decades, yet many historians fail to realize that their insights are needed and desired. Similarly, most presenters at the upcoming ASEH conference are historians, and scientists or engineers remain underrepresented. Establishing connections between institutions like NiCHE, the ASEH, PAGES and the Climate History Network (CHN) can help move us forward, but what’s even more valuable is feedback from those who have benefitted from conferences in another discipline. 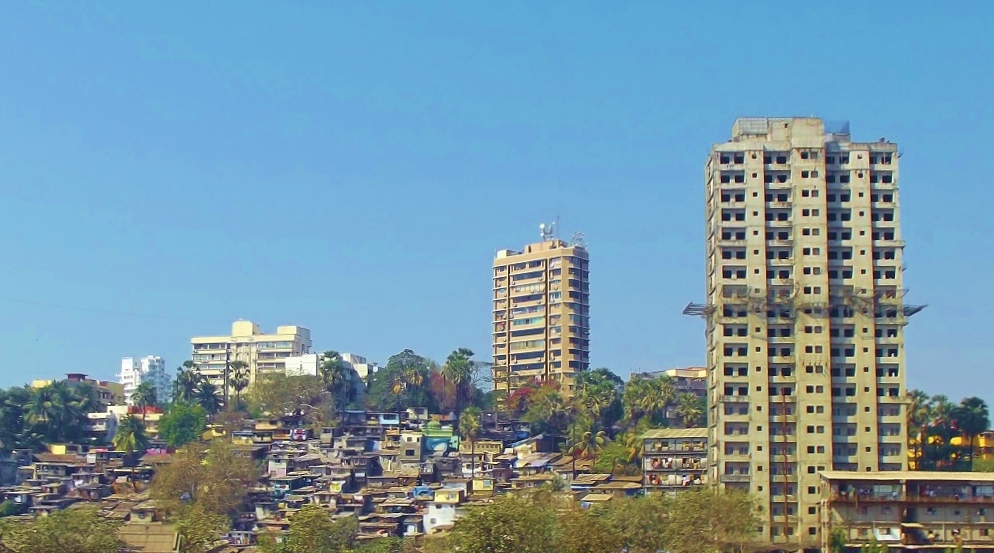 Slums bordering a wealthy part of Mumbai. Though poorly represented in this picture, the smog was overwhelming. After the conference in Goa I spent a few days in the vast metropolis of Mumbai. My plane was delayed, and as it finally approached the city our pilot was forced to circle the airport for a few minutes before we could land. The slums in Mumbai are so vast that their full extent can only be grasped from the air. As I shifted in my leather seat I glimpsed the innumerable shanties, clustered around open sewage, barely visible through the purple smog. The impoverished people far below, and countless millions like them, will suffer most as our planet continues to warm, yet their voices are never heard in academic or political conferences. The quest to understand climate change must become more inclusive, not just of other academic disciplines, but of all voices, past and present, learned and “unlearned,” rich and poor.
~Dagomar Degroot |
Archives
March 2022
Categories
All
|

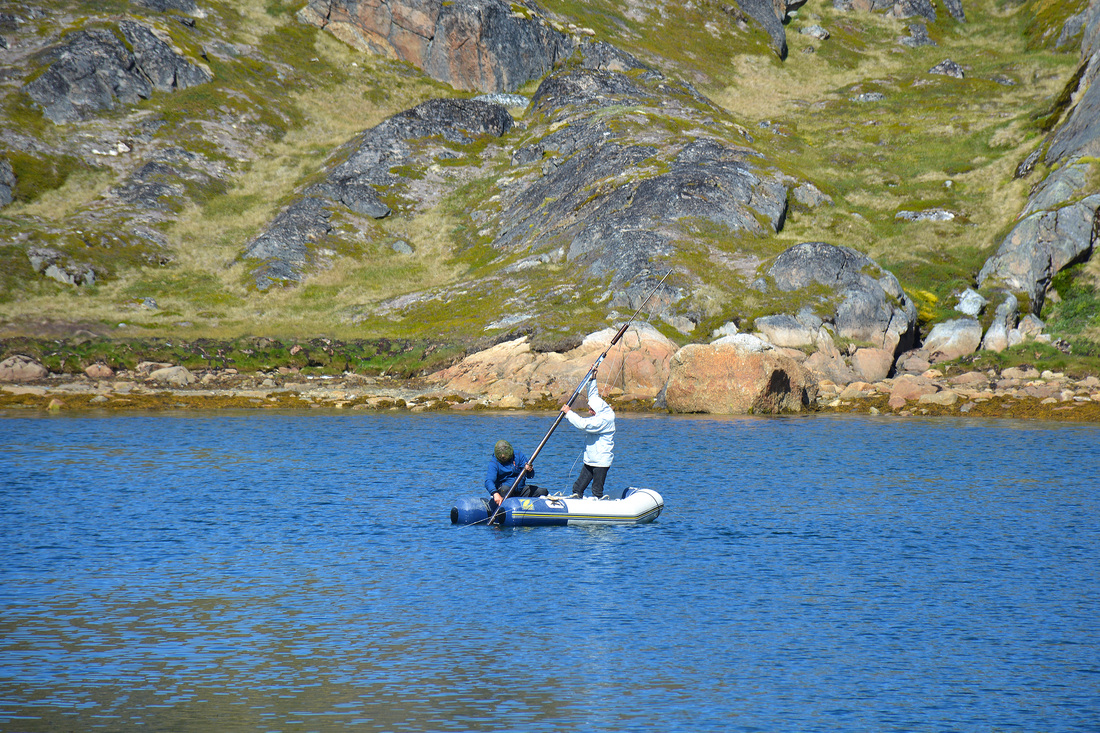
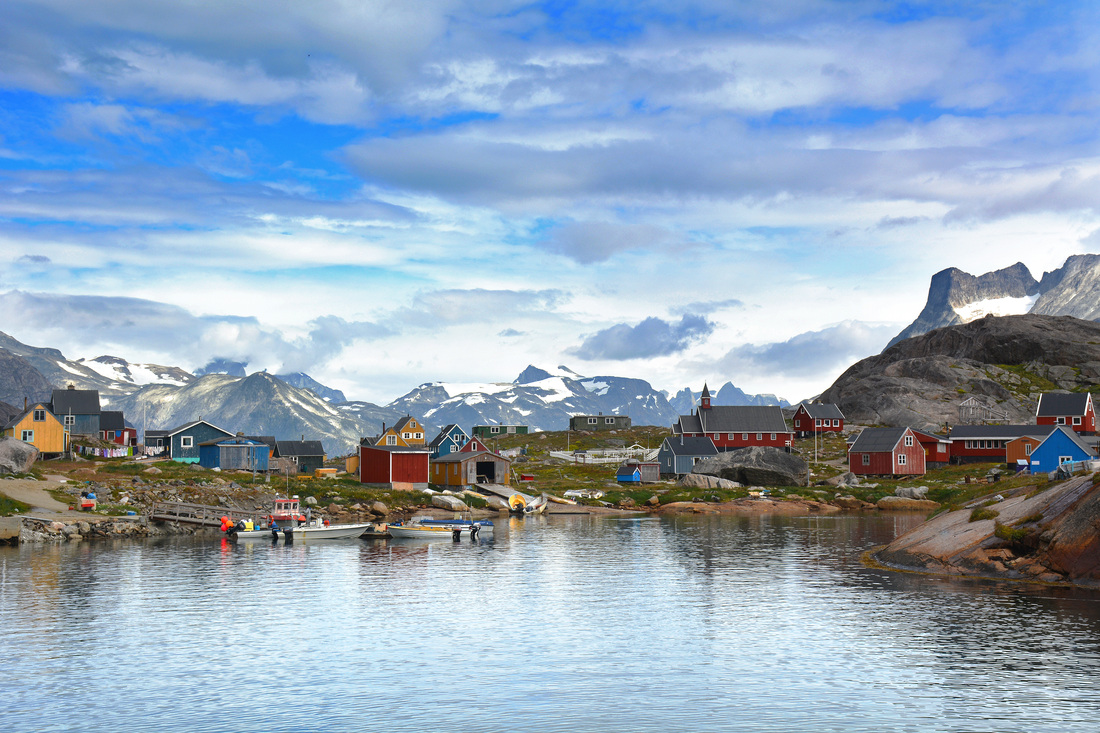
 RSS Feed