|
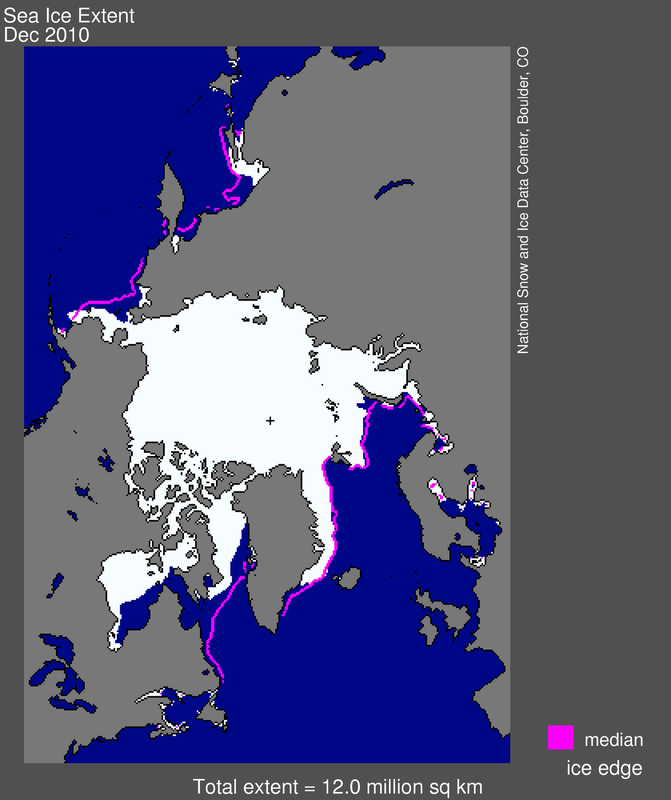
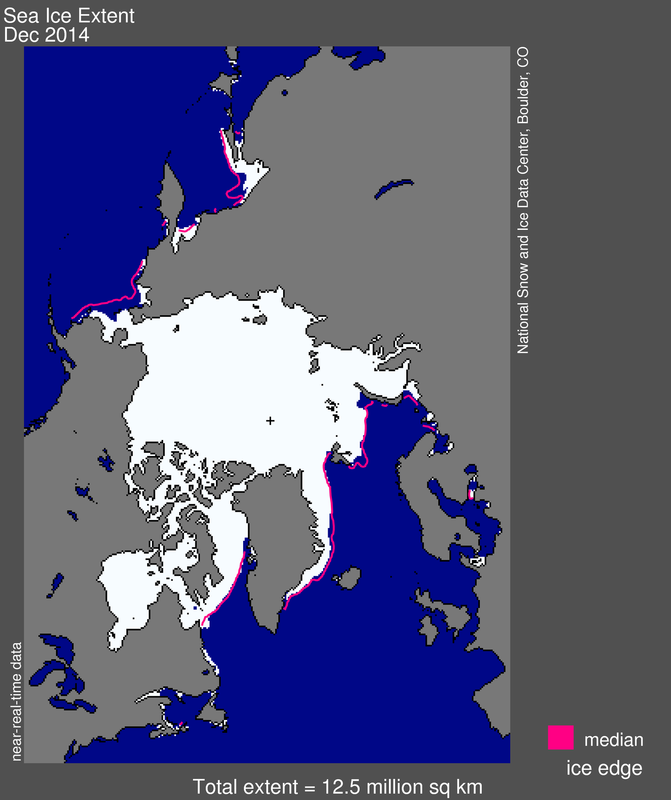
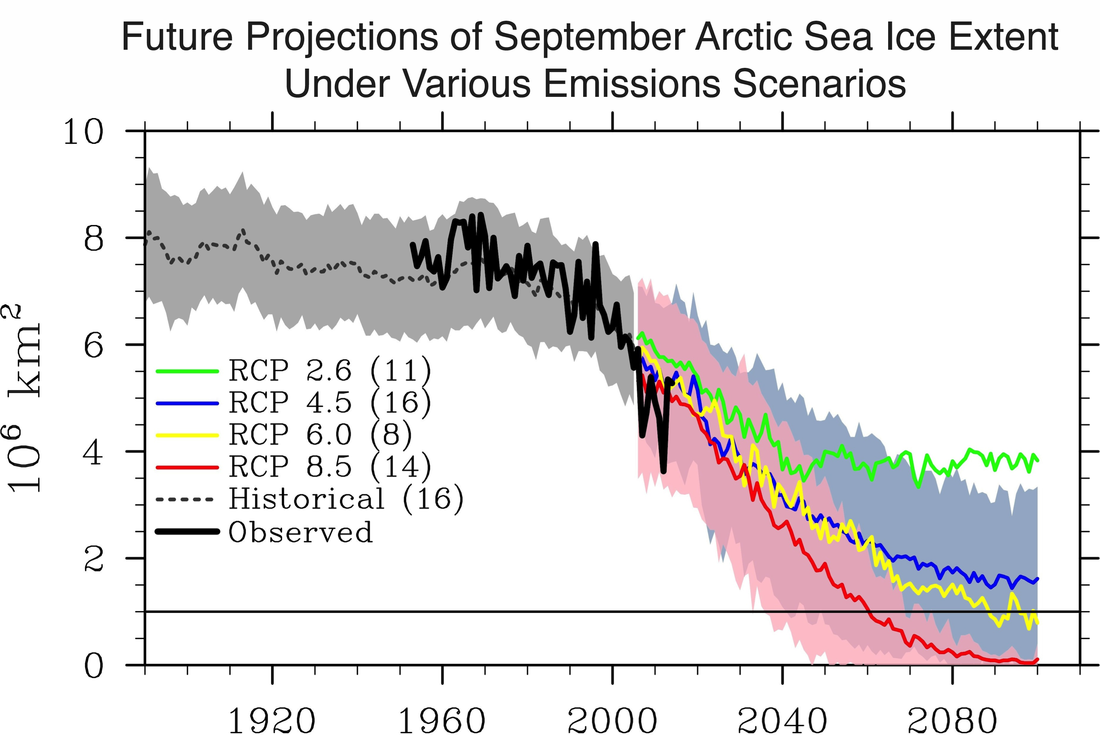
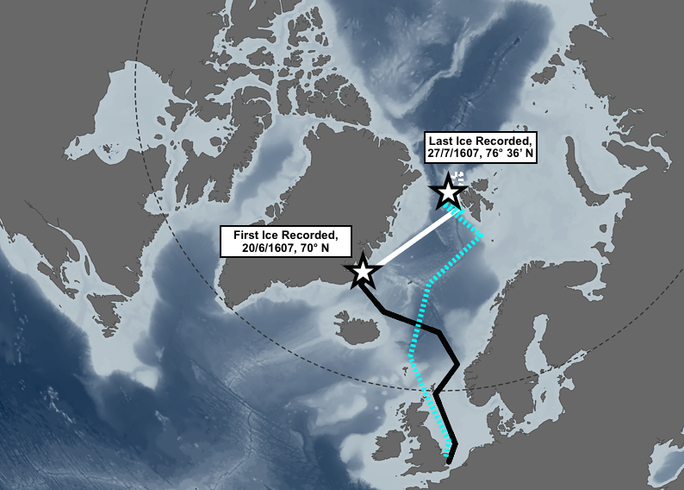
Last year might have been the hottest year ever recorded by our instruments. Average global temperatures were at least 0.27° C warmer than the average between 1981 and 2010, which was in turn up from the preindustrial norm. Overall, the past 17 years have been very warm, and since 2002 temperatures have been consistently well above the 1981-2010 average. However, that consistency is not clearly reflected in Arctic sea ice trends. In fact, the winter extent of Arctic sea ice has expanded in the last two years, seemingly defying projections of its imminent collapse. Arctic sea ice is extremely complex and comes in many forms that respond more or less aggressively to seasonal changes and temperature anomalies. Currents, wind patterns, and even subtle differences in Earth’s gravitation also influence sea ice extent, although temperature usually plays a dominant role. As a result, Arctic sea ice coverage rises in winter and falls in summer. Its minimum and maximum yearly extent reflect shifts in average annual temperature, and in turn climate change. In the winter of 2010/11, Arctic sea ice reached its lowest-recorded extent (above). Satellite data reveals that, in December 2010, average Arctic sea ice covered just 12 million square kilometers. While that may sound like a lot, it is some 1.35 million square kilometers below the 1979-2000 average, and 270,000 square kilometers below the previous record low (set in 2006). The sharp decline in Arctic sea ice coincided with very high global temperatures. In fact, scientists are still determining whether 2014 was actually warmer than 2010. In the wake of the winter of 2010/11, it seemed as though even the direst projections of Arctic sea ice decline had been too optimistic. Perhaps a threshold had been crossed, a tipping point had been reached, and Arctic sea ice would soon vanish. However, since the winter 2010/11 Arctic sea ice extent has haltingly recovered. Satellite maps demonstrate that Arctic sea ice currently covers 12.52 million square kilometers, about 520,000 square kilometers more than the 2010/11 maximum (above). The greatest change relative to 2010/11 is in the Canadian Arctic and Subarctic, where the Hudson and Baffin Bays are now completely covered with ice. If Arctic warming has persisted since 2010, why has Arctic sea ice recovered? One possible explanation lies in the recent history of the Arctic Oscillation (AO), a band of winds that circle the Arctic in a counter clockwise direction. When the AO is in a positive phase, its winds move quickly, tightly sealing frigid air in the Arctic. When it is in a negative phase, its winds move more slowly and the band is distorted, allowing Arctic air to descend towards lower latitudes. There appears to be a correlation between a negative AO and reductions in Arctic sea ice extent. The AO, which was in a strongly negative phase in 2010, is now apparently in a weakly positive setting. Recent research also suggests that Arctic sea ice has a very low “memory” of previous trends. If, for example, Arctic sea ice extent is very low in September, winter heat loss is high, encouraging the formation of more sea ice. Such processes explain high year-to-year fluctuations in sea ice, yet they do not preclude long-term trends. The apparent recovery of Arctic Sea Ice therefore does not counter long-term developments in either regional sea ice decline or global warming. Sea ice extent in December was still 540,000 kilometers below the 1981-2010 average, which means that sea ice coverage in the Arctic is still declining by 3.4%/decade. Most model simulations still project an accelerating decline in Arctic sea ice extent, even in optimistic scenarios in which our civilizations sharply reduce their greenhouse gas emissions (above). Model simulations, scientific proxy data, and documentary evidence assessed by interdisciplinary scholars can contextualize sea ice in the modern Arctic in light of the distant past. My own recent research suggests that sea ice extent in the Arctic north of Europe during December 2014 is not dissimilar to what was encountered by European polar explorers during summer expeditions at the height of the Little Ice Age. This reflects climate change on a remarkable scale, given the vast annual difference between summer and winter sea ice coverage in the Far North. For example, I traced sea ice recorded by Henry Hudson and his crew, during their first Arctic expedition. In the above map, the outbound journey is depicted with a black solid line, while the return journey portrayed in a blue, dashed line. The part of the voyage in which ice was sighted is in white; a solid white line for the outbound journey, and a dashed line for the return. Compare the summer sea ice sighted in the Hudson journey with the edge of winter sea ice today (the second map provided in this article).
Ultimately, Arctic sea ice fluctuates from year to year in ways that can temporarily mask gradual climate change. The world is warming, and the Arctic is warming faster than anywhere else. It is important to keep an eye on the recent recovery in Arctic sea ice, but all indications are that it is just a momentary reprieve in a very worrisome trend. ~Dagomar Degroot |
Archives
March 2022
Categories
All
|


 RSS Feed