 Established in 1988 by the UN and the World Meteorological Organization, the Intergovernmental Panel on Climate Change (IPCC) is a scientific body that periodically summarizes the scholarly understanding of the world’s climate. In 2007, the panel’s fourth assessment report outlined in stark terms the likelihood of anthropogenic global warming. Since then, severe storms and drought have ravaged North America, Australia and Africa, yet unusually wet, cold conditions have accompanied some European winters. Through it all carbon emissions have continued to rise, now driven largely by developing nations. Today, the IPCC’s highly anticipated summary for policymakers was finally released, in lieu of its fifth assessment report that will be published later this year. In this article, I explore this landmark report and the responses it has inspired from the perspective of a climate historian. Initially, the most striking aspect of the IPCC’s new summary for policymakers was not its content but the media reaction. The banner at CNN is currently: “A town that’s melting.” Its subheading: “climate change already happening in Alaska town.” Additional titles announce: “climate change: it’s us,” and “Miama’s rising water,” while an opinion calls for “common sense.” Not surprisingly, among major news networks the BBC has provided the most informative analysis of the IPCC’s report, and its banner, while not as large as CNN’s, nevertheless reads: “UN ‘95% sure’ humans cause warming.” Of course, the Fox News headline is in substantially smaller font, and its conclusion is characteristically fair and balanced: “Hockey Schtick: UN report ignores global warming pause.” Worse still is coverage given by the Times of India, which features only a link in diminutive font buried at the bottom of its website. Meanwhile the homepage for CCTV, a major Chinese broadcaster, contains no reference at all to the report. Taken together, headlines at the big media outlets confirm the enduring importance of partisan divisions in the global warming discussion. They also suggest that scholars, journalists, the IPCC, and indeed the UN must do more to raise awareness of global warming in countries that will be most affected by its consequences. Still, the banner headlines on many centrist news outlets in the West are encouraging. For those who have paid heed to the relentless debate about global warming, much of the action in the IPCC's fifth summary for policymakers happens in the first few pages. In previous days and weeks, so-called climate “skeptics” flooded the airwaves, encouraging rampant speculation about whether the alleged “pause” in global warming would feature prominently in the IPCC's new report. In fact, in its second page the IPCC's summary actually confirms that: 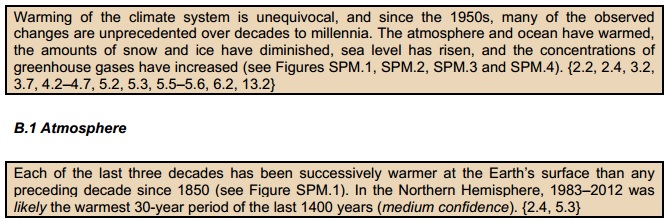 The IPCC affirmed that average global temperatures at sea and on land have risen by 0.85 degrees Celsius since 1880, although that will come as no surprise. What does impress, however, is the IPCC's explicit repudiation of the false narrative of the "pause." Climate historians know better than most that climatic reconstructions can be manipulated with ease. Start your graph of annual temperatures with a year of anomalous warmth, and you're bound to discover long-term cooling. Begin with an unusually cold year, and you'll find just the opposite. That is precisely why scholars must set their temporal and geographic parameters before reconstructing past climates. What region are we examining? For what time, and why? With what sources? What are the limitations of those sources? These questions are essential for the accurate reconstruction of past climates, and the answer can never be: "because of the expected result." Moreover, to unravel why variations in temperature occur, we must also seek the stimulus - the "forcing" - for cooling or warming. Is a volcanic eruption responsible for a few unusually cold years? Is an intense El Niño to blame for a really hot year? Neither event need contribute to a long-term climatic trend. Not surprisingly, skeptics eager to discredit the scientific consensus around global warming have ignored these questions. Instead, they have arbitrarily started their climatic reconstructions at 1998, a year of extreme warmth, in order to highlight supposed cooling since then. Unfortunately for them, the scholars of the IPCC have included this paragraph: 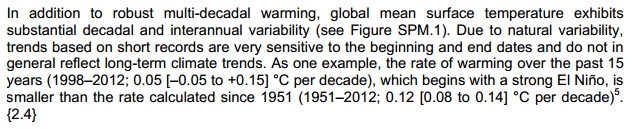 In other words, the presence of short-term fluctuations in climate does not throw into doubt the existence of long-term climatic trends. If anything, the impact of strong El Niño in 1998 reveals what can happen when an entirely natural event that stimulates warming compounds the the influence of anthropogenic greenhouse gases. Still, the IPCC's fifth summary did include these passages: 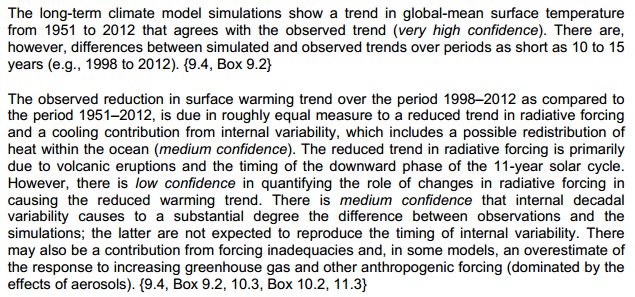 Those paragraphs will probably be manipulated by skeptics and misinterpreted by many journalists. While they seem to suggest that there has been a pause in the warming trend, the context matters. The surrounding passages confirm that model accuracy has improved, further strengthening projections of future warming. However, in 10 or 15-year intervals, natural signals can mask the anthropogenic warming trend. In other words, volcanic eruptions can stimulate short-term cooling, but, again, that hardly rules out long-term warming. In short intervals some natural influences will surprise scientists and confound models, because we are still learning more about the intricacies of our world's climate. Nevertheless, the big conclusions are still the same: the earth is warming, we're to blame. The IPCC's summary for policymakers also addresses climates in the more distant past. Another argument frequently advanced by skeptics holds that the Medieval Climate Anomaly - previously known as the Medieval Warm Period - was actually accompanied by hotter temperatures than we face today. Their conclusion is that modern warming isn't a big deal, and falls within natural variability. Of course, the cause of current warming is more important to climate scientists than the scale of warming to date, because it is precisely that cause which will trigger future warming far beyond anything humanity has encountered. Nevertheless, the IPCC's report also discredits the idea that medieval warmth exceeded or matched modern temperatures: 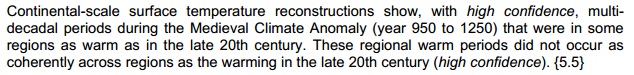 In subsequent pages, the IPCC's report describes the worrying findings presented in thousands of scientific papers during the past six years. Oceans are warming, polar ice caps are shrinking and sea levels are rising, while the atmospheric concentration of carbon dioxide, methane, and nitrous oxide have risen to levels unseen in over 800,000 years. In its most important conclusion, the panel's report reveals that greenhouse gases emitted by human activity are now 95% certain to have caused recent warming. These emissions have affected carbon cycle processes, stimulating further warming from natural sources (for example, methane hidden under melting permafrost). Meanwhile, the ocean has absorbed 30% of anthropogenic carbon dioxide, causing dangerous ocean acidification. The IPCC's fifth summary concludes that warming in the coming century will likely fall between 1.5-4 degrees Celsius. Moreover, it is more likely that warming will exceed a catastrophic 6 degrees Celsius than fall beneath 1 degrees Celsius. The lower range of this estimate is 0.5 degrees Celsius lower than it was in the IPCC's fourth assessment in 2007, owing in part to the slight divergence between model projections and climatic trends in the past decade. It is possible that the range will be adjusted upward in the IPCC's next report, as model simulations and average global warming converge again. Either way, our best guess for the future hasn't changed much: we probably face warming of approximately 3 degrees Celsius worldwide by the end of the century. 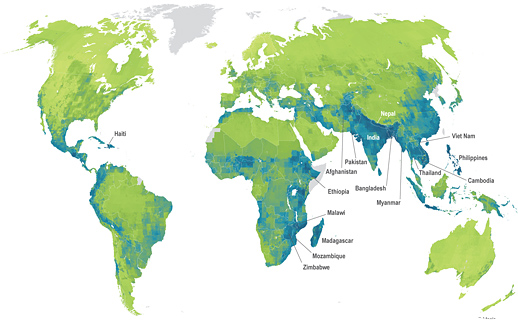 Social and environmental vulnerability to climate change, from low (pale green) to high (purple). Of course, a 3 degree Celsius rise in average global temperatures does not mean each day will be three degrees warmer, no matter where we are. In many regions, warming will be expressed in extremes: a doubling, or tripling, of days accompanied by severe heat, along with far more dangerous storms and flooding. Moreover, warming in some countries will far outstrip the global average, and demographic, social or environmental conditions already increase the vulnerability of many of these countries to climate change. In 2011, scholars at Maplecroft, a global risk analytics company, created the above map of global climate change vulnerability by analyzing 42 social, economic and environmental variables. News outlets in China and India take note: it is precisely the countries that increasingly contribute most to warming that have the most to lose. In that context, let us hope that the dire projections in the IPCC's fifth summary help moderates bridge the partisan divide to inspire concrete responses to climate change in the developed west.
~Dagomar Degroot Further reading: Climate scientist Michael Mann, author of The Hockey Stick and the Climate Wars, measures claims by climate skeptics in light of the IPCC's fifth summary for policymakers. On September 28th, the scientists of the International Geosphere-Biosphere Programme respond to the IPCC's fifth summary. 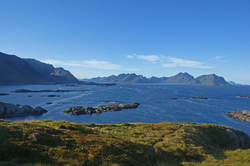 Contributing Author: Benoit S. Lecavalier August 18th, 2013 marked the start of a two week long workshop called the Advanced Climate Dynamics Course (ACDC). The venue was located in a former fishing village in the Vesterålen islands of Arctic Norway, a little place called Nyksund with a population of slightly over a dozen permanent residents. We were there for more than just hiking through the great outdoors, eating the local food, and performing local outreach. We were there to discuss what many call small talk: the climate. Organized by European and North American Universities, this event attracted internationally renowned researchers and graduate students, gathered there to discuss the climate dynamics of the last deglaciation. Twenty thousand years ago, during the last glacial maximum, the climate was cooler, the Greenland and Antarctic ice sheet were larger, and gargantuan bodies of ice rested across North America, the British Isles, and Scandinavia. Consequently, the sea-level was lower than it is today by over 120 meters. The emphasis of the workshop was to discuss how the climate system transitioned from glacial to present interglacial conditions. The seminars began by summarizing our present understanding of climate on time-scales of thousands of years. The driver, often referred to as the pacemaker for the ice ages, is the changes in the Earth’s orbit around the sun. These gradual changes in the Earth’s orbit affect incoming solar radiation at the Earth’s surface, which can either facilitate the growth of an ice sheet or deter it. However, countless feedbacks within the climate system render the situation complex. For example, ice sheet’s reflective nature deflects radiation back into space affecting the available energy at the surface. In addition ice sheets, which can rival mountain ranges in size, affect atmospheric jet streams and deflect storm tracks as well as precipitation patterns. To understand these feedbacks within the climate system we have to look at paleoclimate records: terrestrial and marine records of past climate. The following days were spent going over climate proxies, which preserve physical characteristics of past climatic conditions. These tell us about past temperatures on land and in the ocean, how vigorously the oceans circulated, and past sea-levels, among many other things. After being presented with collections of paleoclimate records, we could speculate on the role of the atmosphere and ocean during the deglaciation. The question that came came to mind: if the ice ages are driven by slow gradual changes in the Earth’s orbit around the sun, what processes, feedbacks, and mechanisms could punctuate the system with such abrupt and rapid climate change?  Evening in Nyksund. We reviewed the literature to investigate the consensus on what is currently understood and what observations lack a proper explanation. Our review emphasized the necessary role of geophysical modeling of the climate system to understand how all these complex processes are intertwined. State-of-the-art atmosphere-ocean general circulation models tell us about the state of the atmosphere and ocean, while glacial system models reveal the response of ice sheet to past climate change and the resulting change in sea-level. Atmosphere-Ocean models are predominantly applied for the past and future 100 years, so the question remains: what were the climatic conditions over the ice sheets thousands of years ago? What climate forcing led to ice sheet instabilities, causing the flow of iceberg armadas in the North Atlantic? To which extent did the fresh water from these icebergs affect the circulation of the Ocean? How have these changes in circulation affected global heat transport and the carbon cycle? What about global temperatures? Fortunately, we are beginning to answer these questions thanks to international cross-disciplinary collaborations, which are often initiated by workshops such as the ACDC. Many atmosphere-ocean modelers take an interest in simulating the deglacial climate, with help from the glaciological community who provide past ice sheet reconstructions. These scientists have discovered that massive ice sheets show the potential to deflect atmospheric stationary waves. The ice sheets respond to climatic shifts, and in warmer conditions they can change dynamically by releasing icebergs into the ocean. Fresh water melting from those icebergs produces density differences in the Atlantic Ocean which slows down the formation of heavy deep water, affecting global circulation. This change in ocean heat transport cools the North Atlantic, while the Southern Oceans warm in a compensating fashion. The models simulate these dramatic climate events, hinting at underlying mechanisms and illuminating the observations found in paleoclimate records. This goes a long way towards explaining how the Earth as a whole warmed out of the glaciation and why records in the North Atlantic reflect quick warming with subsequent rapid and prolonged cool period before finally stabilizing to present conditions. However, the story is far from understood, for every answer brings new questions. The workshop got everyone thinking about possible avenues of research which will have to be investigated to address our questions. That is why we gathered there in that little Norwegian village. It was to exchange ideas, data and model predictions, to work together and form collaborations, and to piece together a story that shaped humanity and still affects us today. 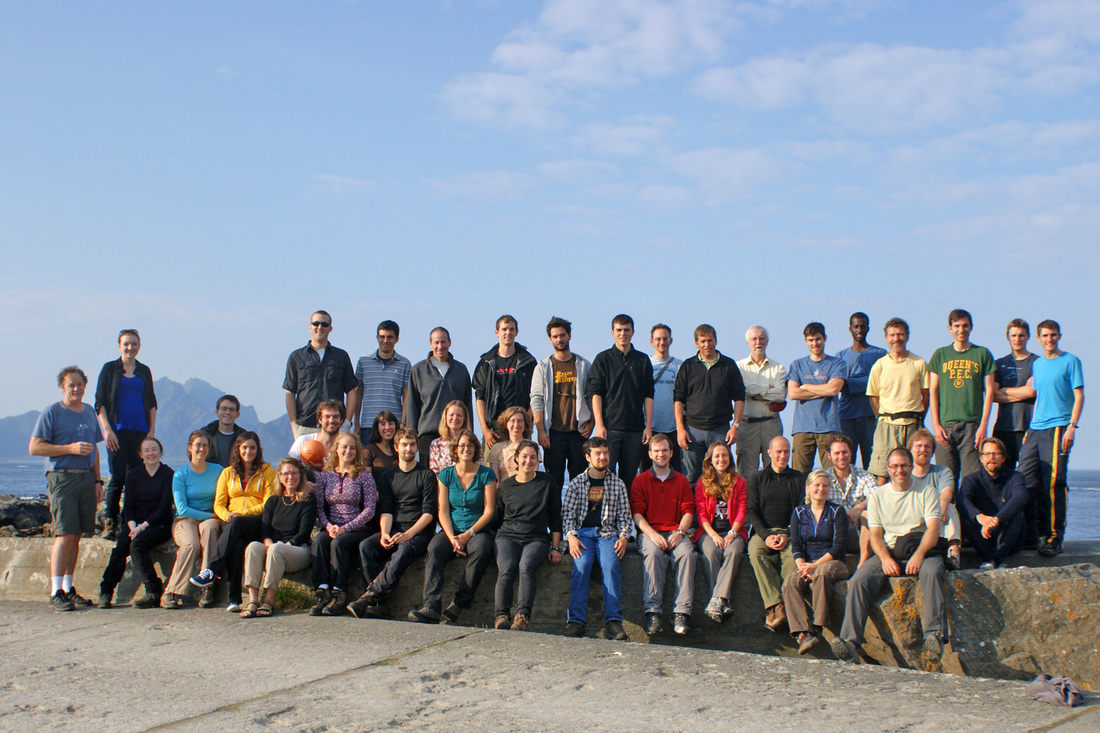 Researchers at the Advanced Climate Dynamics Course, 2013. |
Archives
March 2022
Categories
All
|
 RSS Feed