|
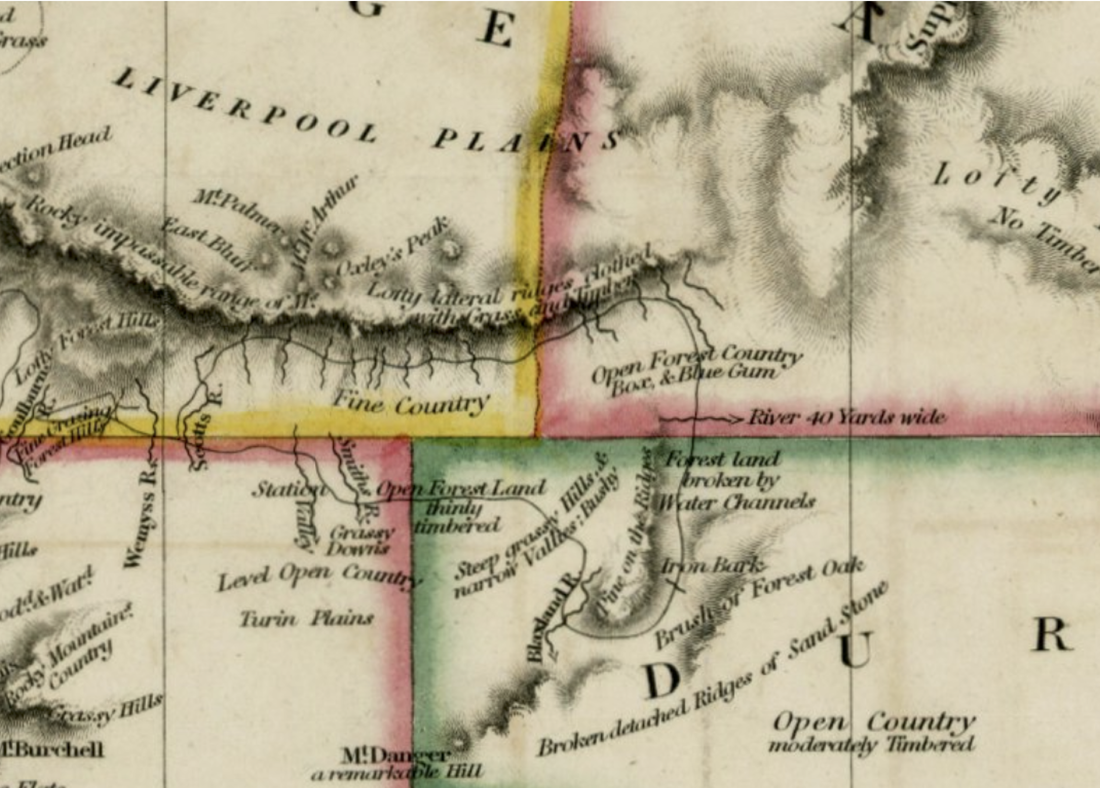
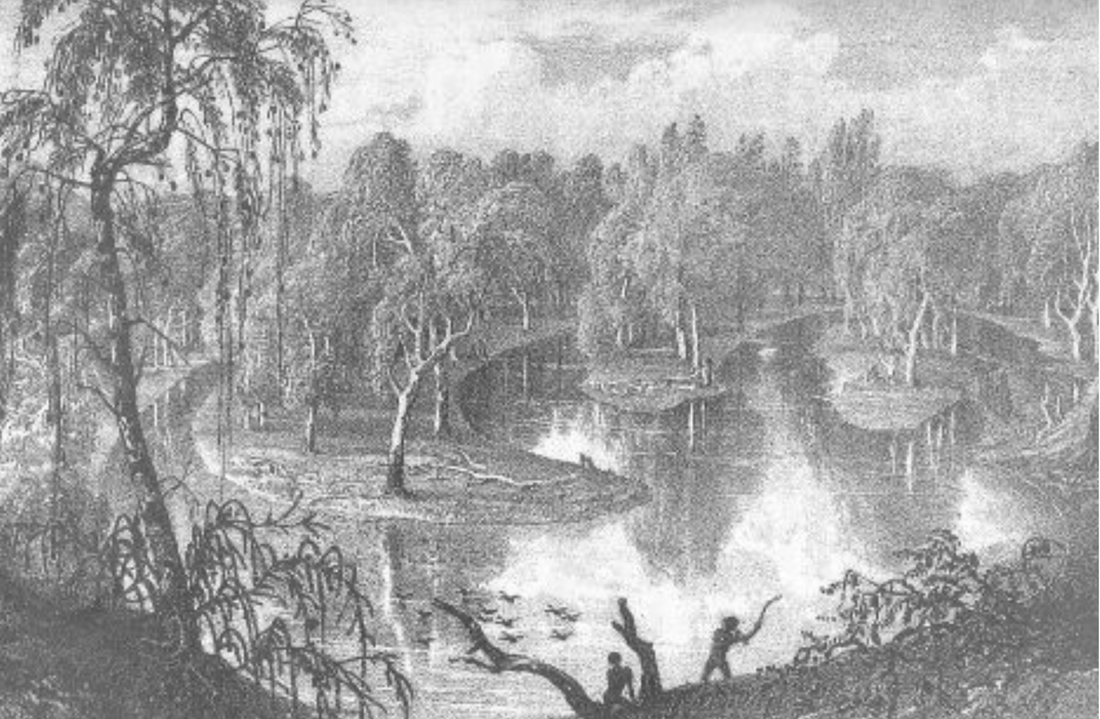
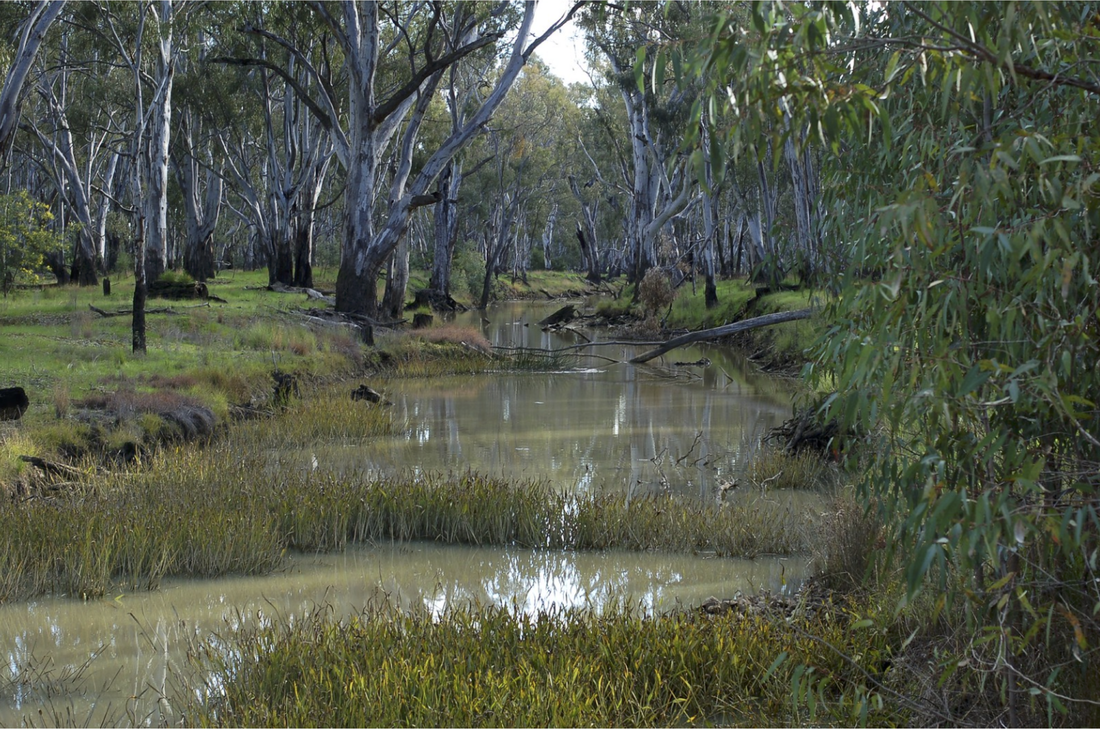
Harriet Mercer, University of Oxford  A section of a map of New South Wales based off the work of Oxley and King and showing how vegetation marks were written on to the maps. Joseph Cross, "Map of New South Wales, Embellished with Views of the Harbour of Port Jackson" (London: J. Cross, 1826) from the collections of the State Library of New South Wales. In early nineteenth century Australia, surveyors were given a near impossible task by colonial authorities. They were asked to use their expeditions to ascertain "the general nature of the climate, as to heat, cold, moisture, winds, rains, periodical seasons." [1] Meeting this directive was difficult because most surveyors did not spend more than a few days or weeks in a location that was otherwise unfamiliar to them. In these situations, precision instruments such as thermometers and barometers were of limited utility as they could only offer a reading at the time of visitation and not for any other time of year or for any other year when atmospheric conditions might be quite different. Plants provided one solution to the dilemma. In the opening decades of the nineteenth century, Aboriginal Australians helped surveyors to decipher some of the relationships between plants and atmosphere in Australia. This article shows how surveyors were taught that the distribution of certain tree species could help them understand the way rainfall patterns varied over space. It also shows how surveyors learnt to use the watermarks on trees and debris lodged in branches as indications of the way rainfall patterns varied over time. With the help of Aboriginal Australians, surveyors were practicing a sort of historical climatology. They were attempting to understand past atmospheric changes in a given area using indirect sources. Can the evidence contained in surveyors’ journals and maps help the historical climatologists and climate scientists of today? This article argues that they can. When Thomas Mitchell, the surveyor-general of New South Wales, was tasked with charting the two major inland river systems of Australia’s south east, his Wiradjuri guides helped him understand the association of particular plants with particular atmospheric and hydraulic conditions. Mitchell was taught that the yarra tree (known today as the river red-gum or eucalyptus camaldulensis) indicated the presence of a river or lake. Mitchell scanned the horizon for these tall trees when he wanted to locate a place of permanent waters: The yarra is certainly a pleasing object in various respects; its shining bark and lofty height inform the traveller of a distant probability of water […] and being visible over all other trees it usually marks the course of riverd so well that, in travelling along the Darling and Lachlan [rivers], I could with ease trace the general course of the river without approaching its banks. [2] Mitchell’s Wiradjuri guides showed him that the presence of goborro trees, by contrast, indicated a place of transient waters. Mitchell learnt that the goborro tree (most likely the plant known today as black box or Eucalyptus largiflorens) flourished on plains subject to temporary inundations rather than on the banks of more permanent waters. “These peculiarities,” Mitchell wrote, “we ascertained only after examining many a hopeless hollow where the goborro grew by itself; nor [sic] until I had found my sable guides eagerly scanning the yarra from afar when in search of water, and condemning any distant view of goborro trees as hopeless during that dry season.” [3] But the presence of particular trees did more than give surveyors an indication of how rain fell and flowed over space in inland Australia. Flood marks on trees such as the yarra also gave surveyors an indication of how much rainfall an area had received in the past. Some of Mitchell’s travels around Australia’s inland river systems were during the drier than average year of 1835, which meant that he did not see how the country looked when it was well-watered. [4] But Mitchell often used the water stains on river red gums and other trees to make judgements about the rainfall variability of an area. Near the inland Lachlan River, for example, he noticed “a tract extending southward from the river for about three miles, on which grew yarra trees bearing the marks of occasional floods to the height of a foot above the common surface.” [5]  An illustration from Mitchell’s account of his 1836 expedition showing a ‘flood-branch of the Murray, with the scenery common on its bank’ including the yarra or river red gum tree. Thomas Mitchell, "Three Expeditions into the Interior of Eastern Australia; with descriptions of the recently explored region of Australia Felix, and of the present colony of New South Wales, Volume 2." Other surveyors working in Australia such as John Oxley and Charles Sturt also used the flood marks left on trees to understand the rainfall variability that a region could experience. Travelling through inland New South Wales northwest of Sydney in 1818, Oxley did not think that the Castlereagh River had been flooded for a long period because there were “no marks of wreck or rubbish on the trees or banks” of the river. [6] Cedar trees along the Hastings River further east, by contrast, bore “marks of flood exceeding twenty feet, but confined to the bed of the river.” [7] Travelling southwest of Sydney about ten years later, Charles Sturt reported “marks of recent flood on the trees, to the height of seven feet.” [8] Surveyors’ atmospheric observations were not, moreover, confined to their journals. They were also written on their maps of Australia. Sometimes, this data was indirectly transcribed and would only be decipherable when read together with the surveyors’ written accounts. Take the example of an 1826 map of New South Wales, which was based on the work of two surveyors. In addition to the names of settlements, rivers and mountains, the map had descriptions of prevailing plant life written on to its surface. [9] The presence of plants such as “box” (or goborro as Mitchell called it) on the map indicated that an area was subject to flood as this was the plant that liked to wet its feet in temporary inundations. More often, the atmospheric information plants provided was directly recorded on to surveyors’ maps. In 1822, for instance, Oxley produced a map which included the Lachlan River, a waterway he had visited five years earlier in 1817. By the sides of the River, Oxley wrote over the map “Low Marshy Country devoid of Hills and occasionally overflowed, perhaps to the extent of 30 miles on each side of the River.” Near other rivers on the map, Oxley also added earth-atmosphere descriptions such as “marks of the flood 30 feet above the present surface of the River’ and ‘Marks of the rise of the flood about 16 feet.” [10] Surveyors’ maps were, then, not just topographical representations of the country – they were also atmospheric representations. The atmospheric information contained in these maps and journals has been overlooked by historians and historical climatologists. This is in part because the maps and journals were created in a period when the use of precision instruments such as thermometers was becoming increasingly widespread and when methods for observing these instruments were being standardised. But as this article (and my doctorate research) shows, instruments were not always the preferred newcomer method for accessing information about the atmosphere. Whereas instruments offered surveyors isolated snapshots of the atmosphere, plants revealed annual and interannual trends. Like historical climatologists and paleoclimatologists today, nineteenth century surveyors yearned to know the atmospheric history of a place. This Australian case study suggests that there are at least three reasons why survey maps and journals deserve the attention of contemporary climate scientists. First, these sources could help historical climatologists overcome the bias toward reconstructing past temperatures over other atmospheric variables. “Most of the climate reconstructions over say the last 1000 years,” Brázdil et al. argued in 2005, "focus on temperature." [11] More recently, the editors of the 2018 Palgrave Handbook of Climate History have argued that precipitation is a "field of research calling for more effort by climate historians." [12] One of the reasons that past precipitation patterns have received less attention than past temperature patterns is because the latter tend to be better represented in the sources. Survey journals and maps can help address this bias in the sources. Second, these sources not only offer information on an under-represented atmospheric variable. They also offer information on under-represented regions. Often, when nineteenth century rain-gauge measurements were taken, they were recorded in urban centers and port cities. This is a problem because precipitation rates and patterns are “highly localized” phenomena. [13] The amount of rainfall one area received could be different for an area just a few kilometers away. Attaining more geographically dispersed precipitation information is therefore crucial to producing more accurate and geographically diverse reconstructions. Surveyors’ records offer information about precipitation patterns for areas where no rain-gauge records were kept in nineteenth-century Australia. Finally, survey maps and journals could provide scientists with information about how particular plants are responding to the earth’s changing atmosphere. The river red gums that are frequently mentioned in Mitchell’s journals have been the subject of recent research into the water needs of flood-plain trees. These trees, researchers have shown, are crucial to the health of flood-plain eco-systems: ‘Everything relies on the red gum to maintain health’. [14] Yet while it is well known that river red gums have adapted strategies for surviving long periods of drought, exactly how long these trees can go without water is less certain. Dr. Tanya Doody’s research, for example, indicates that in conditions of below average rainfall, the trees should not go more than seven years without being flooded. [15] The records of surveyors could offer an additional source of data for such important research projects. In the case of Australia, survey maps and journals are accessible sources. The journals referred to in this article are all digitized and available online without the need for payment or institutional affiliation. Public institutions such as the National Library of Australia and the State Library of New South Wales have also digitized numerous survey maps in high resolution, which allows researchers to zoom in on the atmospheric details that surveyors marked on their charts. Recognizing the valuable atmospheric data contained in these historical sources could prompt other institutions to digitize more survey journals and maps. Such a project promises to help climate scientists in their quest to reconstruct past climates in order to better understand future atmospheric changes and the effects of those changes on plant life and river systems. It also promises to illuminate the way past efforts to understand the atmospheric patterns in Australia were sometimes joint newcomer-Indigenous endeavors. Harriet Mercer is a PhD candidate in the Centre for Global History at the University of Oxford. She is writing a history of climate knowledge production in Australia in the nineteenth century, and exploring how the Anthropocene is changing the way historians write and research history. [1] See for example John Oxley, Journals of two expeditions into the interior of New South Wales undertaken by order of the British Government in the years 1817 – 1818, http://setis.library.usyd.edu.au/ozlit/pdf/p00066.pdf; Phillip Parker King, Narrative of a Survey of the Intertropical and Western Coasts of Australia Performed Between the Years 1818 and 1822, Volume 1, http://gutenberg.net.au/ebooks/e00027.html; Charles Sturt, Two Expeditions into the Interior of Southern Australia, during the years 1828, 1829, 1830, and 1831, http://www.gutenberg.org/files/4330/4330-h/4330-h.htm-
[2] Thomas Mitchell, Three Expeditions into the Interior of Eastern Australia; with descriptions of the recently explored region of Australia Felix, and of the present colony of New South Wales, Volume 2, http://gutenberg.net.au/ebooks/e00036.html. [3] Mitchell, Three Expeditions, Volume 2, http://gutenberg.net.au/ebooks/e00036.html. [4] Linden Ashcroft, Joëlle Gergis and David John Karoly, “A historical climate dataset for southeastern Australia, 1788 – 1859,” Geoscience Data vol. 1, no. 2 (2014) p. 172. [5] Mitchell, Three Expeditions, Volume 2, http://gutenberg.net.au/ebooks/e00036.html. [6] Oxley, Journals of two expeditions, http://setis.library.usyd.edu.au/ozlit/pdf/p00066.pdf. [7] Oxley, Journals of two expeditions, http://setis.library.usyd.edu.au/ozlit/pdf/p00066.pdf. [8] Sturt, Two Expeditions, http://www.gutenberg.org/files/4330/4330-h/4330-h.htm. [9] Joseph Cross, Map of New South Wales, Embellished with View of the Harbour of Port Jackson (London: J. Cross, 1826). [10] John Oxley, A Chart of the Interior of New South Wales (London: A. Arrowsmith, 1822). [11] Rudolf Bradzil et al. “Historical Climatology in Europe the State of the Art,” Climate Change vol. 3 (2012), pp. 386 – 387. [12] Christian Pfister et al. “General Introduction: Weather, Climate, and Human History,” in The Palgrave Handbook of Climate History eds. Christian Pfister, Sam White and Franz Mauelshagen (London: Palgrave Macmillan, 2018), p. 12. [13] Pfister et al. “General Introduction: Weather, Climate, and Human History,” p. 12. [14] Mary O’Callaghan, “The water needs of floodplain trees – the inside view,” ECOS, 9 April 2018, https://ecos.csiro.au/flood-plain-river-red-gums. [15] O’Callaghan, “The water needs of floodplain trees”. |
Archives
March 2022
Categories
All
|


 RSS Feed