|
Dr. Dagomar Degroot, Georgetown University
The Tipping Points map at the time of publication (April 30th, 2018).
In late 2016, Randall Bass, vice provost for education at Georgetown University, asked me to help design and teach a pilot project at Georgetown University that would experiment with a new way of introducing climate change to undergraduate students. The Core Pathway on Climate Change initiative, as we came to call it, ultimately allowed students to mix and match seven-week courses - "modules" - to find their own pathway through the scholarship of climate change. Each module explored climate change from a different disciplinary vantage point, from English Literature through Environmental History and the Earth Sciences.
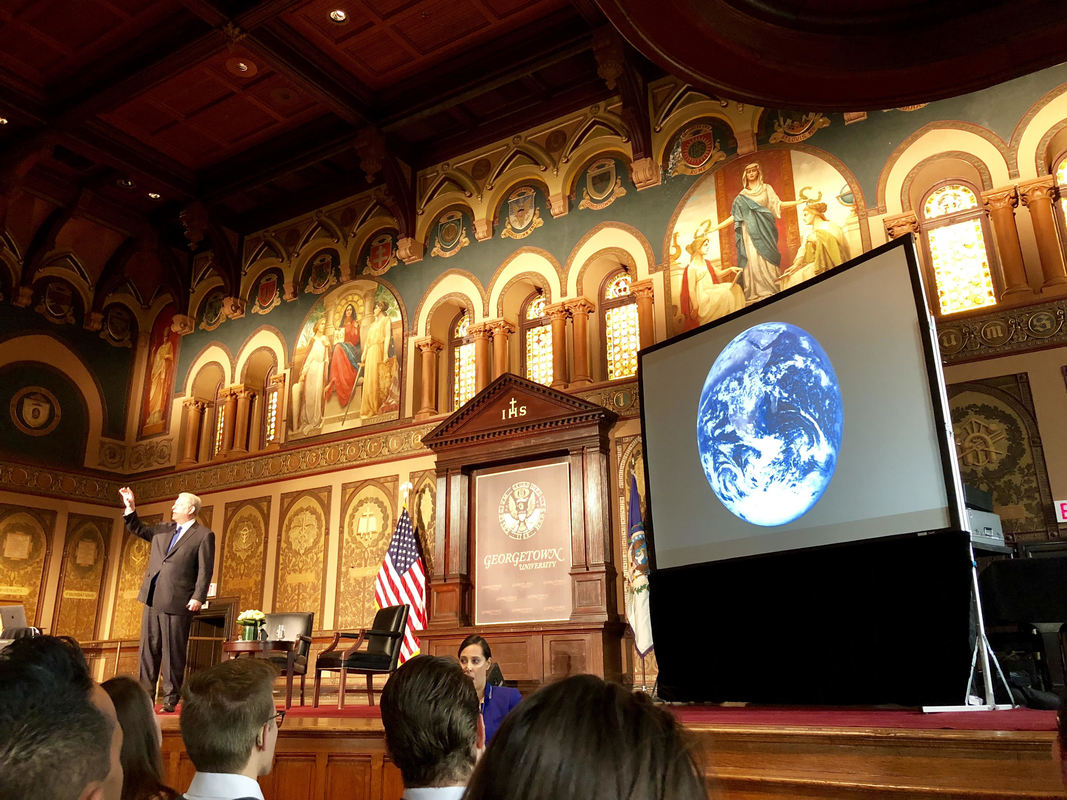
Students could, for example, mix modules on literature and climate change with modules on the theology and philosophy of climate change. Alternatively, they could select modules on the physics and chemistry of climate change with environmental science modules that survey the impacts of global warming on water use and the ecology of cities. We scheduled every module for the same time, and we capped each at around 20 students. The program attracted over 100 students, many of whom were eager to learn more about climate change and anxious to be part of solving its pressing challenges. After and in some cases during every module, all the students in the program convened for "integrative days" in large halls or auditoriums. Often, we would guide students through an activity that encouraged them to draw on the distinct disciplinary insights they had learned in their modules. In our final integrative day, former Vice President Al Gore joined us for a series of meetings and talks that addressed the gravity of the climate change crisis and the prospects for overcoming it.
Al Gore gives his final talk at the last integrative day of the Core Pathways Program at Georgetown University.
I taught two environmental history modules in the Core Pathway on Climate Change: one that surveyed how societies coped with the climatic cooling of the Little Ice Age from the thirteenth through the nineteenth centuries, and another that explored the causes, consequences, and controversies of anthropogenic global warming. Both modules cover huge topics, of course, but the seven-week format actually helped me emphasize what was most important about them.
Students in my Little Ice Age module learned how scholars work together to reconstruct past climate changes, studied what the history of natural climatic variability tells us about the causes of climate change, and evaluated what made societies vulnerable - or resilient - in the face of climatic cooling. Students in my global warming module learned about the "discovery" of global warming; weighed scholarship about its environmental and human consequences; traced the history of "geoengineering" schemes, and debated the causes for government inaction. The innovative design of the Core Pathways Program and the quality of our students also encouraged me to experiment with different kinds of assignments. Early in 2017, I won a Georgetown Environment Initiative grant for a new initiative - the "Tipping Points Project" - that aims to raise popular awareness about the consequences of global climatic trends for local communities. My grant covers events at Georgetown that connect climate scholars who actively reach out to the public, but from the start I imagined that the heart of the Tipping Points Project would be a map littered with icons that directed visitors to short, jargon-free articles on the impacts of climate change in local communities. The focus would be on the United States: still the world's superpower, and the only country poised to withdraw from the Paris Agreement on Climate Change. As I prepared to teach my first Core Pathways modules, I realized that some of my assignments could require my students to write first drafts of these articles. With that in mind, I created a first edition of the Tipping Points map and website. I added a page to the website that listed online tools that visitors and students could easily use to reconstruct and project climatic trends - temperature, precipitation, sea levels, and more - in local communities. To see if students could actually use these tools to write compelling articles - and to give them templates for those articles - I drafted two short pieces for the website. The first examined how climate change would likely impact the environments and people of Washington, DC, while the second explored the impacts of past climate change in Tulare County, California.
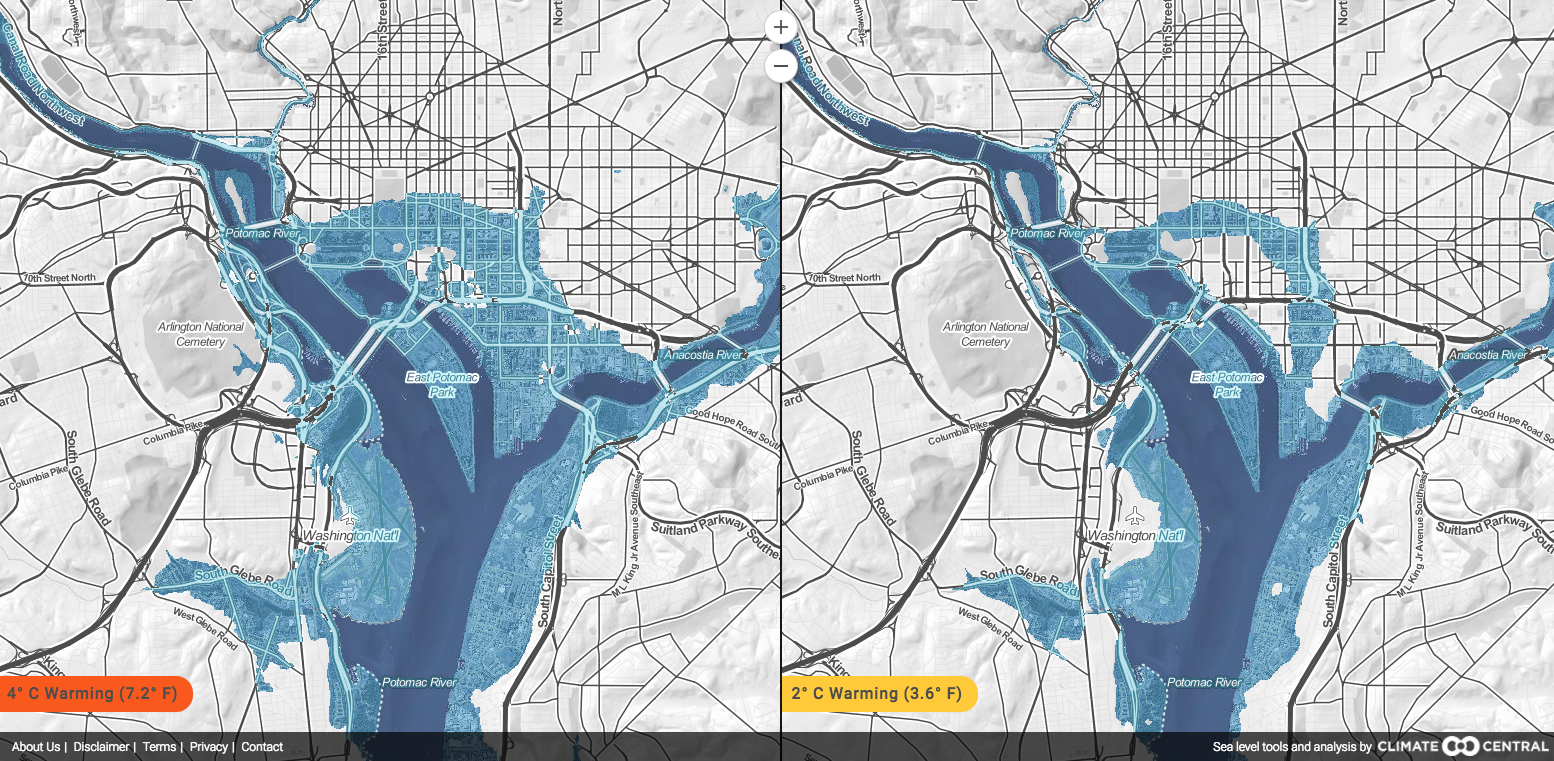
Many students gravitated towards the the Climate Central "Surging Seas, Mapping Choices" program, which represents the impacts of rising sea levels on coastal communities, in different emissions scenarios (and absent adaptive responses).
Students drew on these templates to write their own Tipping Points articles. In our Little Ice Age module, they used the tools on the Tipping Points website to reconstruct the impacts of past climate change in local communities, while in our Global Warming module, they used other tools to project the consequences of climate change, sometimes in the same communities. Often, they chose to write about counties and cities that had special significance for them: hometowns, places they visited, places they aspired to live in. Sometimes, they wrote for family members they hoped to persuade.
I stressed that every article should follow a simple format. It had to have three parts devoted to, first, the impacts of climate change on local environments; second, how we know that those impacts had happened or would likely happen; and third, the likely consequences of those environmental impacts for local communities. I challenged students to avoid jargon while clearly explaining the mechanisms behind the relationships they uncovered. It was not enough for them to mention, for example, that global warming would likely make severe hurricanes more common. They had to explain how warmer waters, changing atmospheric circulation, and rising sea levels would likely all play a role in intensifying the worst hurricanes and magnifying their human impacts. Perhaps above all, students learned just how difficult - but how important - it can be to communicate complex ideas in plain English. In the end, my students submitted roughly seventy Tipping Points articles in my modules. As I painstakingly edited and expanded each article, I decided that the icons on our map should convey something about the articles to which they linked. First, I opted to color-code the icons: blue for articles that dealt with past climate change, and red for articles that projected future climate change. I figured out a way to allow visitors to view only articles about past or present climate change, if they played with the filters on our map. Second, I decided to use icons that visualize the major weather trends in each article. A thermometer represents temperatures changes; waves represent rising sea levels; cyclones represent hurricanes; rain drops represent liquid precipitation; and suns represent droughts (okay, that one is a little less straightforward). As I populated the Tipping Points map with icons, I was struck by how clearly it visualized the extent to which climate change had already altered environments and impacts communities across the United States. Droughts already routinely stretch across the southwest; hurricanes and rising sea levels already imperil the east coast. And of course, there is so much more to come. The Tipping Points map currently features icons that link to nearly twenty student-written, and professor-revised, articles. Each include striking visualizations, many created by students using the accessible tools listed on our website. By the end of the summer, the map should be teeming with as many as seventy icons. Bathsheba Demuth - our assistant director at HistoricalClimatology.com and the Climate History Network - may also ask her students at Brown University to write Tipping Points articles. That would allow us to host over 100 articles by spring 2019. Going forwards, we will use our online resources - including our social media feeds - to direct visitors to new articles as they come online. We will permanently link to the Tipping Points project under the "resources" tab of HistoricalClimatology.com. Ultimately, I hope that the Tipping Points map will provide a first stop for ordinary people interested in the impact of climate change in their communities. It may also serve as an example of the ways in which instructors can use simple, digital platforms to allow undergraduate students to create resources that have both pedagogical value in the classroom, and practical value in the real world. So please, visit the Tipping Points website, and stay tuned for much more! |
Archives
March 2022
Categories
All
|


 RSS Feed