|
Dr. Dagomar Degroot, Georgetown University 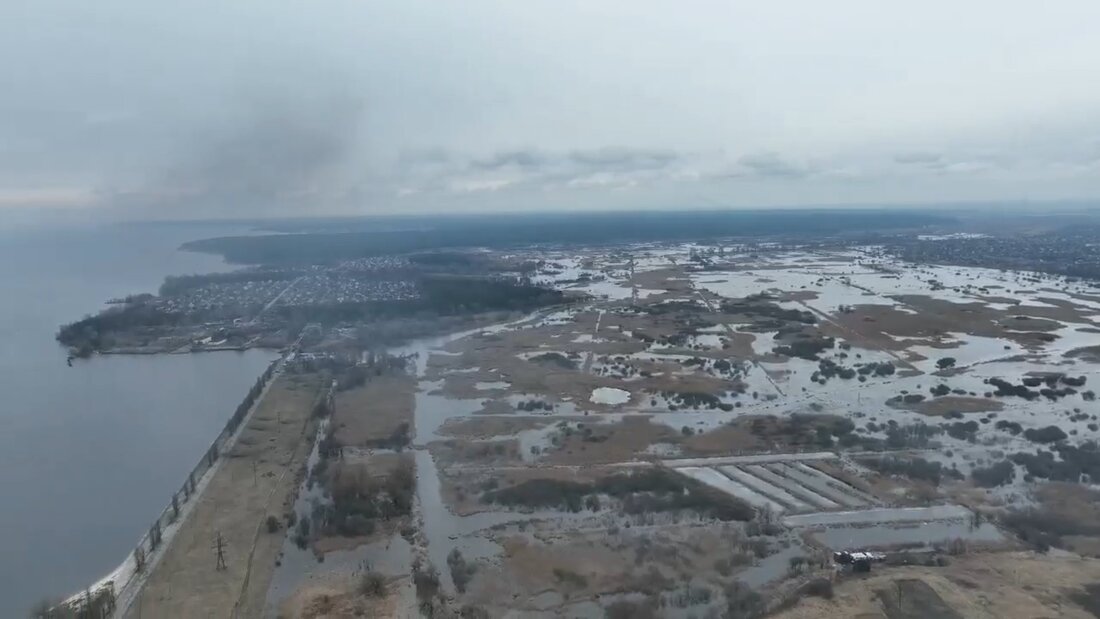 Floods near Kyiv last week. MilitaryLand.net. According to a western intelligence report, when Vladimir Putin travelled to Beijing this February, Xi Jinping asked him to wait until after the Olympics to invade Ukraine. Frigid winter weather had, by then, frozen the Ukrainian landscape, making it strong enough to support Russian tanks. American officials warned that the Russian military could exploit this hardened terrain to invade. Putin, however, apparently agreed to wait. The weather would surely be cold enough in March. Not long ago, it was a safe assumption to make. Yet temperatures around Kyiv and Kharkiv – Ukraine’s first and second cities, hotbeds of fighting in the present war – have warmed by more than two degrees Celsius since the middle of the twentieth century. In February, temperatures across Ukraine soared over five degrees Celsius above their mid-twentieth century averages. Frozen ground that otherwise would have held Russian heavy armor collapsed into mud. When Putin finally launched his brutal invasion on February 24th, images proliferated across social media of Russian tanks and rocket launchers abandoned in the mud. In northern Ukraine, Russian vehicles kept to roads, forming long columns easily bombed from the air. Far from the blitzkrieg Putin seems to have expected, the invasion from the north advanced at a snail’s pace. It was an unexpected reversal that owed much to the bravery and skill of Ukrainian soldiers and their leaders. Yet it may also have owed something to the influence of human-caused climate change. Human activities have warmed Earth’s climate by about one degree Celsius since the middle of the twentieth century, and land is heating up at about twice the speed of the oceans. This is why Kyiv and Kharkiv have warmed around as much as Washington, DC and New York City. The combination of the speed, magnitude, and cause of this climate change has no precedent in Earth’s history. Yet natural forces have changed Earth’s climate even before the industrial era, in ways that shaped the outcome of wars. In the late sixteenth century, for example, explosive volcanic eruptions cooled European temperatures as just the Spanish Empire struggled to suppress a rebellion in the Low Countries. Cooling altered patterns of atmospheric circulation, increasing the regional frequency of heavy rains and intense storms. Invading Spanish armies routinely found it difficult to advance towards fortified cities. When they finally arrived, they discovered it was nearly impossible to dig trenches in the mud that would have allowed them to mount an effective siege. Then as now, wet, muddy weather can be a nightmare for an invading army. The rebel army was much weaker than its Spanish counterpart, whose “Army of Flanders” was widely regarded as the best in Europe. To even the playing field, rebel engineers breached dikes that normally protected the coastal Low Countries from the sea. Deliberate floods washed away besieging armies around the cities of Alkmaar and Leiden, for example, and brought to battle the formidable rebel fleet. Storms and heavy rainfall increased the speed and therefore the military effectiveness of these floods, allowing the rebels to relieve besieged cities more quickly than they otherwise could. 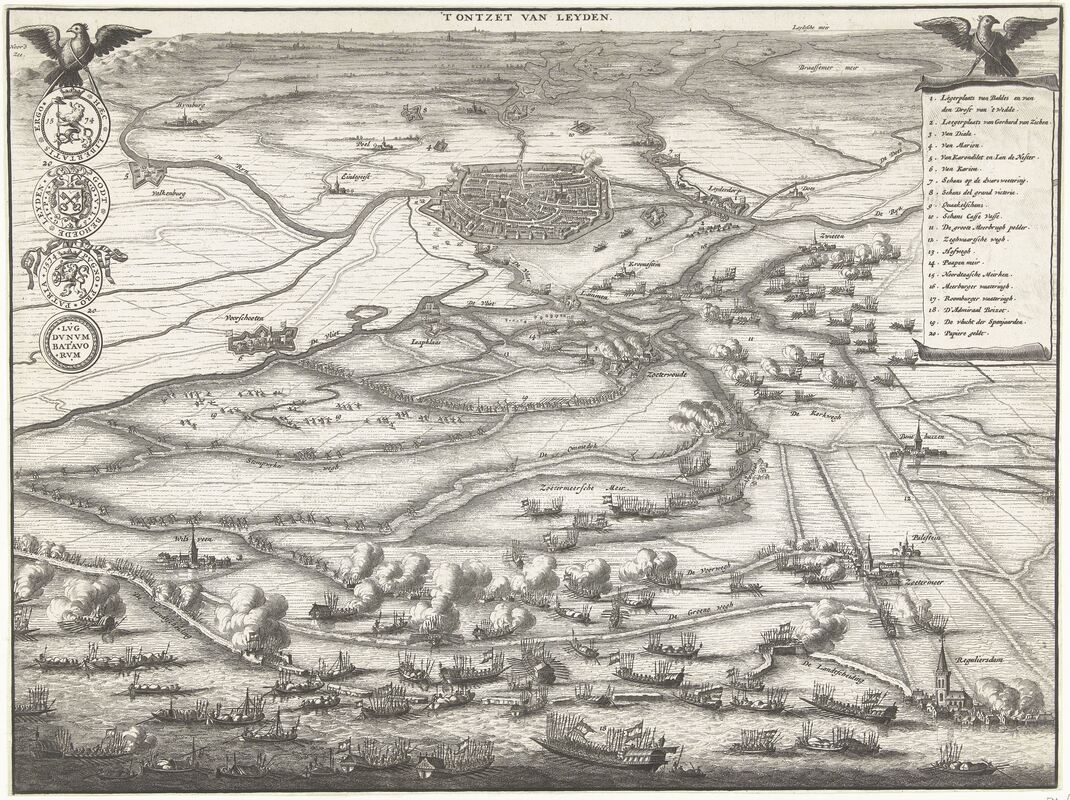 An illustration of floodwaters and rebel ships surging towards Leiden, a city besieged in 1574 and relieved with an intentional flood. Coenraet Decker, "Kaart met het ontzet van Leiden, 1574," 1703. Rijksmuseum, Amsterdam. Here again, history may be repeating itself. Near Kyiv, Ukrainian defenders seem to have breached a dam, sending floodwaters north of the Dnieper River. Until recently, a Russian convoy had stalled nearby, owing in part to challenging terrain and the vigorous Ukrainian defense. The fog of war is thick even in a battlefield that can feel saturated by social media, and for now it is hard to know to what extent the floods slowed the Russian advance. If they did, climate change may again have played a pivotal role. Without today’s warm temperatures, the water would have frozen, and intentional floods would have been much harder to execute.
Temperatures across Ukraine plummeted over the weekend, however, because climate change consists of gradual trends and therefore does not determine daily weather. Unfortunately, the sixteenth century reveals that “hydraulic warfare” can fail in such conditions. Spanish armies repeatedly invaded into rebel territories over frozen rivers and flooded landscapes that otherwise would have blocked their progress. Rebel defenders struggled to break up the ice, sometimes by literally hacking at it with axes, but it was often not enough. Bitterly cold weather, however, created additional hazards for sixteenth-century invaders. Long sieges dragged on for months, and when they did soldiers ran out of fuel and food. Many froze to death, and those who survived repeatedly mutinied. After one particularly brutal winter, in 1573, Spanish soldiers demanded “winter-quarters in walled and populous towns” as long as rebels were not themselves in the field. It is tempting to wonder whether some poorly-provisioned Russian soldiers will leave their posts in frigid temperatures. Yet the greatest effects of climate change on war may unfold far from the battlefield. When rebels in the Low Countries coalesced into a country – the Dutch Republic, precursor of today’s Netherlands – they found ingenious ways to cope with a cooler climate, and this may have given them a military edge over other European powers. Today, a warm spring would ease Europe’s dependence on Russian natural gas, providing new motivation for blocking a key export of Putin’s regime – and the most important source of Russian leverage over western Europe. Exports that cripple Russia's economy may yet compel Putin to withdraw - though, tragically, the cost to ordinary Russians would be immense. Researchers and military officials have long focused on the potential for climate change to cause wars by shifting the supply, accessibility, or defensibility of desirable resources. Yet the history of the Little Ice Age may reveal that climate change most profoundly affects wars by transforming how they can be fought, occasionally to the detriment of one side and the salvation of another. As Putin may be discovering, in a rapidly warming world the influence of climate change is inescapable - even for one of the world's most ruthless regimes.
0 Comments
This is the twelfth and final post in the series Historians Confront the Climate Emergency, hosted by ActiveHistory.ca, NiCHE (Network in Canadian History & Environment), Historical Climatology, and Climate History Network. Dr. Vinita Damodaran, University of Sussex 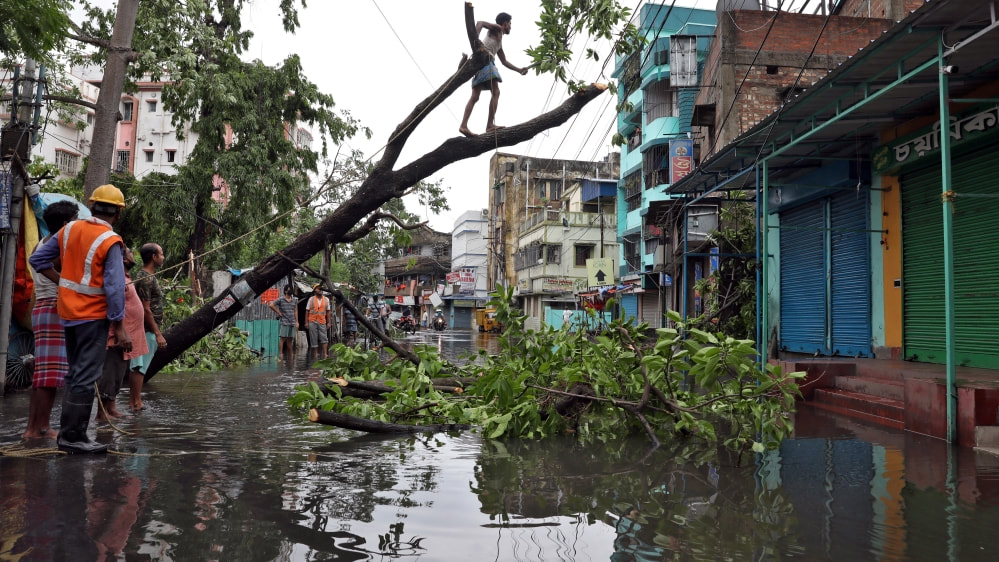 Damage in Kolkata from Cyclone Amphan, May 2020. Source: Reuters via Al Jazeera. In May 2020, Cyclone Amphan battered the east coast of Bangladesh and India, especially Kolkata and the Sundarbans, leaving hundreds of people dead and causing damage of over $13 million USD. This was not the first time such a storm had battered the coast but was only one in the long history of such events. In 1999, a super cyclone in Orissa killed 10,00 people and destroyed 210,000 houses. In flood-prone cities the dangers are even greater. For example, in cities in the region such as Ho Chi Minh City, Kolkata, Dhaka, and Manila, potential sea level rise and the increased frequency and intensity of extreme weather events pose significant adaptation challenges. The urban poor—often living in riskier urban environments such as floodplains or unstable slopes, working in the informal economy, and with fewer assets—are most at risk from exposure to hazards. Regions with active river deltas, such as Kutch in Western India and the Sundarbans, are historically more prone to frequent droughts, famines, pestilence, earthquakes and floods, which can be mapped through the archive. For the British, the lack of environmental predictability meant a loss of control over the territory and the populace. Colonial surveys, in such contexts, were efforts to establish rule and control over unpredictable landscapes. Local archives, however, reveal knowledges, syncretic histories and pastoralist and fisher narratives that convey past social worlds that were more adept at handling environmental shocks. As such, the archival record on calamitous events, natural catastrophes and environmental shocks as catalogued by colonial sources while very rich needs to be bolstered by local archives and oral histories of communities. The scope of such historical data, both colonial and local, available to refine climate anomalies is underestimated and large amounts remain untapped, but with concerted data rescue activities this situation can be dramatically improved, both back through time and wider in space. As extreme events increase, questions regarding the predictability of such events become more important. Thus, improving the historical weather and climate data base will provide a platform with which to address key concerns in climate change. The historical record reveals that two devastating cyclones hit the centre of Sundarbans and Calcutta in the latter half of the nineteenth century. This was a period when colonial weather data and collecting cyclones had made a big step forward. Colonial scientists realised that climate and weather are complex and vary through time and geographically. The colonial scientific network allowed for the possibility to collect useful data through lots of data points and an information flow network that spanned Australia, India and oceanic islands such as Mauritius and St. Helena. The ‘Monsoon,’ coined from the Arabic mawsin (a season), was key to understanding world climate; therefore, the Indian peninsula became key to understanding world climate. Between 1700 and 1924, many critical features of world climate were discovered by Indian civil servants, who were mostly Scots, Germans, and Bengali. They included the remarkable Henry Piddington, who wrote the Law of Storms and coined the word cyclone in 1848.[1] By 1852 there were 123 weather stations in India with the Centre of Calculation being in Calcutta. The journal Asiatic Researches published the data which included a detailed study of cyclones. The 1864 storm had a width of 100 miles and proceeded at a speed of 10-17 miles per hour. The greatest damage on land was from a 15-foot storm surge. At the end of the cyclone, 48,000 people were declared dead in Calcutta and environs (about one third of the population), including those who died in the aftermath due to cholera. The cyclone had a differential impact on rich and poor. In Calcutta alone, 102 well-built houses were destroyed, with 563 severely damaged. On top of that, 40,698 native huts were completely levelled. 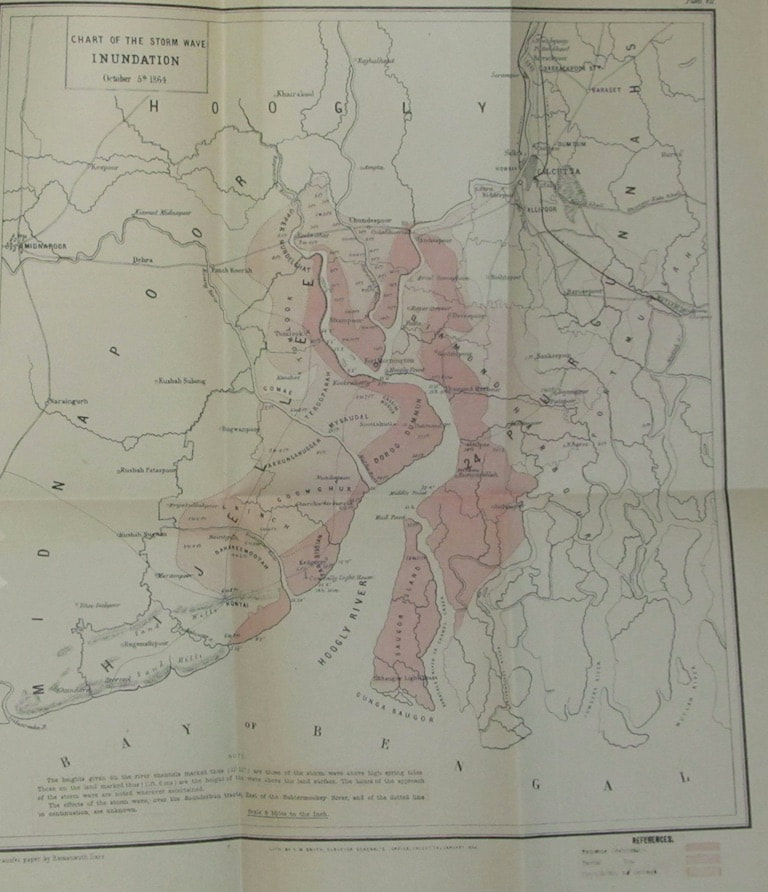 The inundation map of the cyclone of 1864 is useful for understanding the effect of settlement patterns and can help us map the impact of the current cyclone in the context of land use and deforestation history of South Asia and its coastal regions which will us help think in terms of resilience strategies for the future. Source: scalar.usc.edu, Cyclone Storm Wave In this same period, a scheme was being mooted to develop another port as an auxiliary to Calcutta, at a location about 45 km to the south-east of Calcutta, deeper in the Ganga-Brahmaputra delta, on the Matla River. A town would be settled as well. Beginning in 1853, the work of survey, settlement and the formation of a company occurred in rapid succession. That very year, Henry Piddington, who had moved his residence in Calcutta in order to pursue his varied intellectual interests, wrote to the Governor-General of India stating that, per his calculations, the Matla was directly in the way of cyclones - the term he had coined a few years earlier. He warned that the site would be extremely vulnerable to storm surges. His letter was received, and his proposition was also assessed in the Calcutta Review. In the journal, Piddington’s reputation was commended, but his proposal was refuted on the premise that there were no facts to support his projection. His critics chose to ignore his warning and stated that, given an upsurge in the river, one could always resort to the good old system of embankments. The example of prosperous coastal ports and port towns in Europe were thrown in as comparisons for good measure. Port Canning was commissioned in 1864. In 1867, a storm of moderate intensity brought six feet (1.8 metres) of water over the settlement. The port was completely destroyed and abandoned four years later, never to be rebuilt. Piddington’s claim turned out to be true.[2] A historical understanding of the impact of past events and traditional methods of coping and adapting to these events in these regions can give us important lessons on how to deal with current extreme events and help build resilience at all levels. It is the most vulnerable groups that have been affected by the recent Cyclone Amphan. With regard to this cyclone, the protection provided by mangroves is an important lesson in how to manage the landscape. The mangroves protected areas such as Khulna in Bangladesh from destruction and salinity due to the long history of British-planted reserved forests in the region. In India, relentless land encroachment and deforestation has intensified the impact of the cyclone and made Calcutta much more vulnerable. As tropical cyclones become more common in this era of global warming, a deep historical understanding helps illuminate the responses of the state, scientists, and local communities to such issues in the past. In 1867, the folly of building Port Canning was made apparent after the Calcutta cyclone, which destroyed it. Vinita Damodaran is a historian of modern India and Professor at the University of Sussex, interested in sustainable development dialogues in the global South. Her work ranges from the social and political history of Bihar to the environmental history of South Asia, including using historical records to understand climate change in the Indian Ocean World. [1] Henry Piddington, Law of Storms in India, (An Eighteenth Memoir on the) being the Cyclone of the 12th to 14th Oct. 1848, in the Bay of Bengal, Journal of the Asiatic Society of Bengal, Vol. XVIII, Part II, July to December 1849, pp. 826-869.
[2] The Spectator, 7 December 1867, page 2; “India: The cyclone at Calcutta,” account printed in The Calcutta Englishman, 10 October, reprinted in General News column in New York Times, 24 November 1864, https://www.nytimes.com/1864/11/24/archives/general-news-india-the-cyclone-at-calcutta.html last accessed on 20 December 2019. This is the eleventh post in the series Historians Confront the Climate Emergency, hosted by ActiveHistory.ca, NiCHE (Network in Canadian History & Environment), Historical Climatology, and Climate History Network. Dr. Jim Clifford, University of Saskatchewan 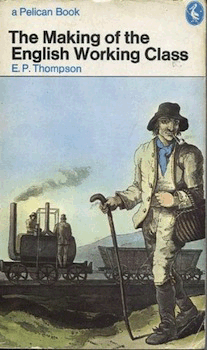 If you are a historian, your work is about global warming. - Dagomar Degroot A few weeks ago Dagomar Degroot provided an overview of the excellent work done by historians of science, historical climatologists and historians of climate and society. But he also argued, given the all-encompassing nature of the climate emergency, for us to think about the contributions of a much wider range of historical scholarship: “In a sense, just about every kind of history has relevance to the present crisis, because climate affects every aspect of the human experience.” I am going to take up this point and present a book published just three years after Charles David Keeling confirmed the rising level of CO2 in the atmosphere in 1960. During the early 1960s, leading historians remained unaware of the significance of these scientific breakthroughs and instead were introducing new methods to study “history from below.” This work focused on workers and their fights for democracy and unionization remain surprisingly relevant to the climate crisis today.
There is a lot of value in reading the history of other intractable problems and the messy and incomplete ways they have been solved over time. For this, I recently returned to E. P. Thompson’s classic, The Making of the English Working Class, for the first time since I read (and skimmed) it during graduate school. Thompson focuses on a moment of transition and conflict where industrialization, democratic reform, and increased commitment to free-market principles amongst the political and economic elite all created considerable social instability. Thompson follows the Luddites as they responded to a situation where new machines and the growing hegemony of the free trade ideas put forward by Adam Smith dramatically undercut their standard of living. Their handcraft skills became obsolete, and merchants took advantage of the surplus of labour to drive down compensation. Once prosperous skilled tradesmen found themselves thrown into poverty. Parliament, elected by a corrupt system that generally included no representation for the new industrial cities, ignored calls for reforms to protect these workers and passed laws making unions and other collective action illegal. The value of the book remains immense almost fifty years after its publication, even after the legitimate critique of its limited gender analysis and the underlying economic determinism from Thompson’s engagement with Marxist theory. It provides a detailed look at the social and political responses of communities of working people to rapid economic transformations. We face a future of similar transformation and we need to consider how communities facing economic dislocation will respond to these changes. We need to stop criticizing people who live in communities that rely on oil, gas or coal to maintain a comfortable standard of living for resisting calls to “believe in science.” Having watched other resource-producing and industrial regions decline, they are worried that the end of coal or oil means accepting that their kids will need to leave the community as they transition from a life of hard work for a good income to a demoralizing reliance on government handouts. Of course, many environmental activists have long recognized this challenge and are working with the labour movement to fight for a just transition. Thompson’s book highlights the importance of this work and reminds us of the potential radicalization of people who are set to lose their livelihoods, particularly when they are accustomed to a relatively high standard of living compared with other workers. The book also highlights the unsatisfying nature of progress. The dislocated skilled workers don’t win in the end. Historians can look back and argue that the British working classes benefited in the long term from increased standards of living and more social mobility, but the generation trying to survive the transition during the 1820s, 1830s or 1840s mostly faced economic hardship, declining standards of living, unhealthy urban conditions, and the failure of grassroots political movements. Urban working men didn’t win the vote until 1867. While it is dangerous for historians to predict the future, I expect progress in addressing the climate emergency will be messy, uneven and often unsatisfying. Reading this book might help inspire us to keep fighting through these difficult decades ahead, knowing it will be hard to identify any of the early stages of the successful transition to a more sustainable future. As anyone who teaches topics related to the climate emergency knows, it is all too easy to retreat to nihilism in the face of intractable challenges and generational injustice. Linking the struggle of our time to tame the damage done by industrial capitalism with the early histories of labourers fighting for decent pay, working and living conditions in that system’s formative years might help give the climate justice movement a sense of history and the knowledge that grassroots movements can succeed – at least partially – in transforming capitalism. This is the tenth post in the series Historians Confront the Climate Emergency, hosted by ActiveHistory.ca, NiCHE (Network in Canadian History & Environment), Historical Climatology, and Climate History Network. Dr. Thomas Wien, Université de Montréal 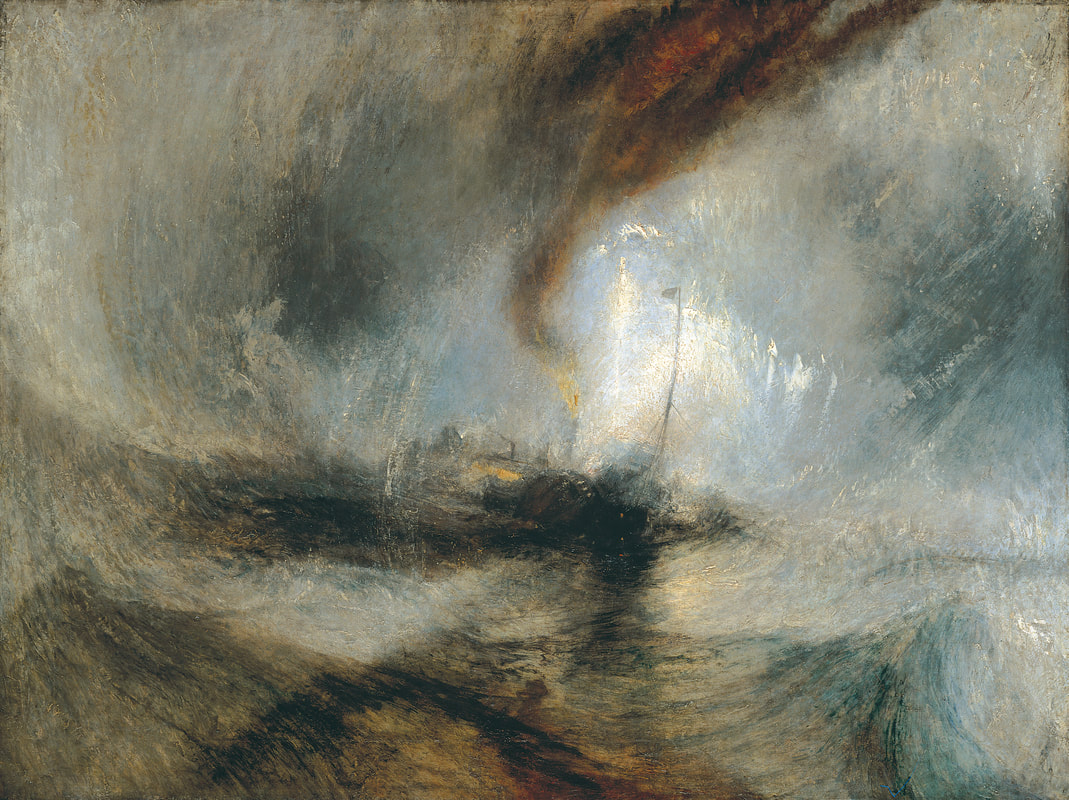 Snow Storm: Steam-Boat off a Harbour's Mouth, Joseph Mallord William Turner, 1842. The next Ice Age is behind schedule. Now for the bad news: the infernal and, for many in the northern hemisphere, eye-opening summer of 2021 has shown that global warming’s effects are reaching critical levels sooner than expected. Worsening drought and extreme weather events afflict the hotter parts of the globe, already sorely tried. The rapidly warming Arctic, devastating fires and floods in places like British Columbia, Siberia, or the Rhine Valley, and a stray hurricane over Newfoundland suggest that the “cool blue north” isn’t quite what it used to be (you may remember that Jesse Winchester first sang those words in 1977…). Using uncharacteristically blunt language, experts confirm this impression of acceleration. And over the past decade or two, they have added an order of magnitude to the uncertainty: no longer does the worsening seem linear (“one additional degree will cause more such-and-such”), conjuring up situations that while alarming, at least present a threat that is directly proportionate to the amount of carbon (etc.) in the atmosphere – and to human action or inaction. Rather, the warning now is “such-and-such may happen regardless,” or even “all hell may break loose,” as sudden, irreversible shifts and catastrophic chain reactions within the Earth System become more likely. For it seems that we humans (some of us much more than others, of course, historically and presently) and the other species we have dragged into this are closer than ever to truly formidable tipping points. The destabilization of the oceanic system picturesquely known in English as AMOC (Atlantic Meridional Overturning Circulation), is only the latest of these to attract attention. Dying coral reefs, rapidly melting ice in high latitudes or altitudes, methane suddenly unleashed from permafrost and ocean sediments, are some of the others. Imagine: a prospect even more worrisome than the climate deteriorating a step, a degree at a time. Amok indeed. Short of such extreme scenarios and their associated dystopias (imperialistic deserts, drowned cities…), getting some sort of handle on warming in a few short years promises not a quick return to friendlier conditions, but an unprecedently difficult climatic future. In its recent report, to me all the more ominous in that it dwells so little as yet on the suffering the current and coming geophysical changes will cause, the Intergovernmental Panel on Climate Change laconically speaks of “commitment”: “unavoidable future climate change resulting from inertia in the geophysical and socio-economic systems.” In 2018, a group of Earth System specialists already specified what this might mean. The best that can be hoped for, they argued, is “stabilization in a range of intermediate temperature rises,” well beyond the range seen over the Holocene’s dozen millennia. This for centuries and centuries to come, the time it takes for anthropogenic carbon, half of it accumulated since 1990 (!) to leave the atmosphere. Here it is, the future the past summer portends. A future of avoiding the worst. At best. Yet all this, too, is in the process of becoming old news. I repeat it here in part as a kind of mantra, as a way of summoning up, momentarily, a crisis so enormous that it continuously repels our gaze. Even – especially? – now that it has begun to loom over our present. But I include my amateur climate bulletin also by way of describing this moment’s specific combination of certainty and uncertainty. And of pointing to a further possible tipping point that would see many – too many – of our contemporaries proceed from inertia to resignation, without passing go, without coalescing sufficiently to move or remove the people and the systems that are so powerfully arrayed against rapid climate action. “The new challenge”, remarked journalist David S. Wallace just the other day about climate writing in general, “[…] is to capture the feeling of our predicament, along with its facts: not merely to convince people, but to galvanize them out of despair or fatalism.” If that is what needs to be done, historians hardly seem likely galvanizers. At least as historians: think of E.P. Thompson, who 40 years ago threw himself into the campaign against the nuclear arms race, putting aside his astounding historical work – although he did forge “exterminism” during this period, a notion that remains useful, even though warheads no longer top the list of threats to humanity. Short of dropping our own astounding work, and after having given hard thought to our personal contribution, both to climate change and to the struggle to reign it in, there remains the question: what historical narratives for this apprehended future? In 2003, François Hartog attributed to a weakening sense of progress in Western societies (a destabilized temporal AMOC?) the rise of what he called “presentism”. In the later twentieth century, he argued, an increasingly “opaque and threatening” future encouraged Westerners to adopt a precautionary attitude, along the lines of philosopher Hans Jonas’s “imperative of responsibility”, making avoidance of future harm the supreme criterion of present action. When looking backward, they waxed commemorative, making the past resurface in the present in the form of heritage or memories of historical injustices. Hartog concluded a touch regretfully that “today, enlightenment has its source in the present, and in the present alone” and that his fellow historians, at least those who continued to view the past “from afar,” faced marginalization. “Presentism” has been much debated, up to and including environmental historian Grégory Quenet’s recent suggestion that the climate emergency has jolted us out of it. However that may be, it seems useful in this context to recall what goes without saying for environmental historians and their readers: that a precautionary approach to the future, reflecting in this case ecological and climatic concerns, necessarily influences one’s approach to the past. That applies most obviously to environmental history’s eminently precautionary mission of fostering ecological – and increasingly, interspecies – consciousness, in an attempt to chip away at humans’ sense of entitlement. In its more combative form, environmental history can nourish activism more directly, while still avoiding the search for heroic ancestors, another, problematic form of presentism. A recent, stimulating example comes to mind: Jean-Baptiste Fressoz and Fabien Locher’s Les révoltes du ciel (2020). The study explores some five centuries of discourse and initiatives on climate change in Europe (often France) and other places variously appropriated by Europeans. Aside from demonstrating that climate change has long been a preoccupation in a surprising range of contexts, the authors show how tenaciously, over the centuries, a supposedly beneficial effect on climate was used to justify European colonization (including in New France, my specialty).[1] There and elsewhere, controlling nature was intimately bound up with controlling humans and hence with power and inequality. Which enables the authors to argue that however unprecedented our current situation, climate change is a political phenomenon, past, present, and future. That observation reads like a call to arms. What is particularly galvanizing about work of this sort – about nature, ironically – is its insistence on denaturalizing present conditions. If such is history’s main purpose – to show the seemingly inevitable as contingent, opening a space for alternatives and political struggle to attain them – perhaps a broader range of histories, beyond the environmental, qualify as precautionary. I’m thinking more specifically of counterfactual history: less of the experimental, playful, what-would-have-happened-if-Hitler-had-been-admitted-to-art-school variety, than of one more broadly interested in historical actors’ options, perceived or not, and in roads not taken. Implicit in much historical reasoning, the approach surfaces not just in counterfactual history per se, but also in historians’ critique of often national teleology, for example, and cultural history’s insistence on individual subjects’ views of the world and of the future. A recent survey of history in this vein sees as a sign of uncertain times a kind of counterfactual sensibility that has emerged over the last few years. Precisely! A history giving more thought to futures past depicts our predecessors or near-contemporaries exploiting their maneuvering room, weighing their options as they see them, and dealing with contingency. Precautionary, it keeps open this space for action in the future. It offers encouragement, as the climatic chickens come home to roost. Thomas Wien teaches the history of New France and the French Atlantic World at the Université de Montréal, including the course on “Crises et catastrophes” that has inspired this post. He is currently editing for publication an account of the cooper J.P. Reichart’s visit to Canada (1723-4). This is the ninth post in the series Historians Confront the Climate Emergency, hosted by ActiveHistory.ca, NiCHE (Network in Canadian History & Environment), Historical Climatology, and Climate History Network. Dr. Philip Gooding, McGill University 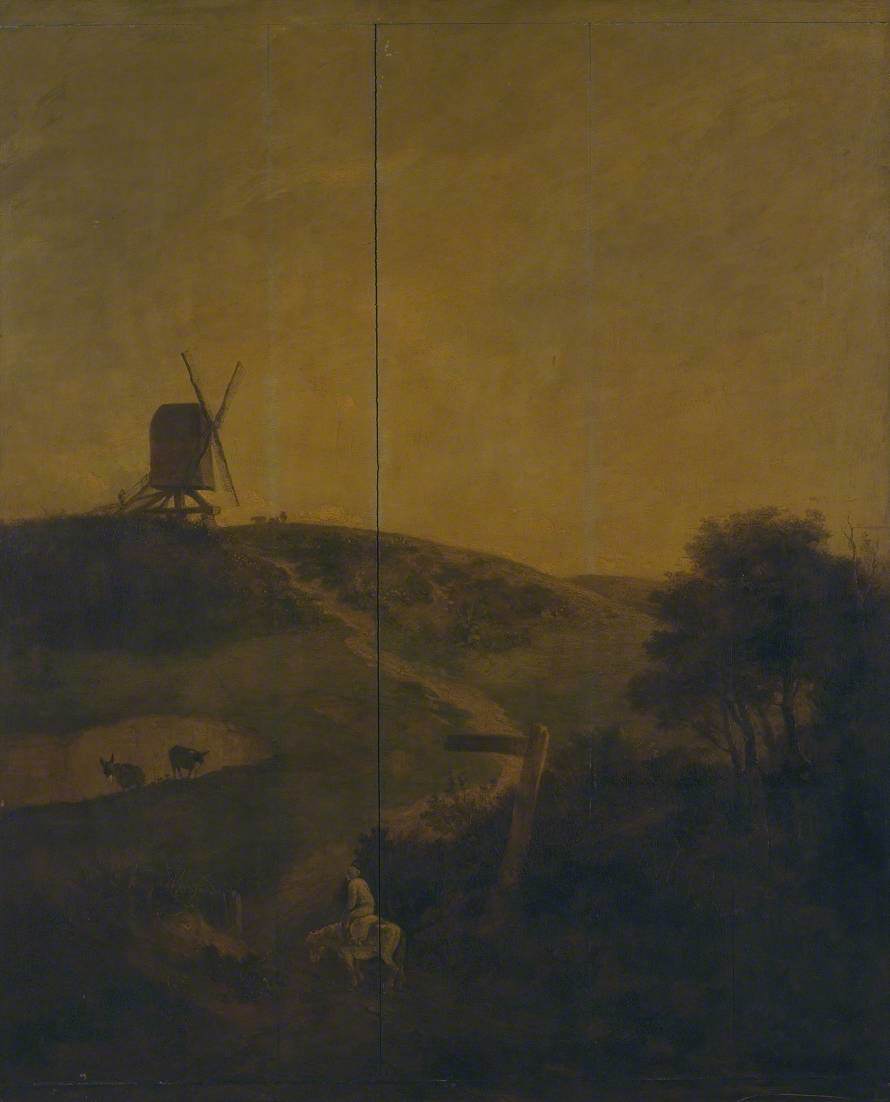 John Crome, A Windmill near Norwich, 1816, Wikimedia Commons. The style of this painting is characteristic of the Romantic movement, whose dates (c.1790-1850) roughly correspond to those of the late Little Ice Age (c.1780-1840). Crome painted this image in the 'Year Without Summer,' a year of severe cold in Europe and other global regions following the eruption of the Tambora volcano, in present-day Indonesia, in 1815. [1] I recently taught a remote, intensive Summer course entitled ‘Themes in World History’ at McGill University. This course was aimed mostly at second- and third- year undergraduate students. I chose as my theme ‘Climatic and environmental change.’ This provided me with many opportunities, one of which was to teach students a historical perspective on the current climate emergency. What follows is a description of the thought processes behind my course design and its objectives, as well as a reflection on its successes and shortcomings. World history and the climate emergency are highly compatible subjects for two core reasons. First, the climate emergency has no respect for human borders, and so, like world history, it transcends traditional spatial paradigms in the humanities and the social sciences, such as nation states and area studies. Second, world history courses tend to attract students with vastly different disciplinary backgrounds, not just history majors and minors. A historical perspective on the climate emergency, which students are generally conscious of and interested in, therefore, can act somewhat as an entry point into the study of history more broadly. Additionally, understanding the role of climate in history necessitates a high degree of interdisciplinarity, incorporating climatological and other perspectives from the natural sciences. Students can engage with climate history from a variety of disciplinary standpoints. At the outset, I posed two core questions to my students, which we returned to throughout the course. These were, first: If the present and future of humanity are to be indelibly shaped by how it responds to the current climate emergency, how have past human societies also been affected by climatic and environmental changes? And second: How can historians and historical methods help to build strategies to mitigate against the effects of global warming in the present and future? Exploring answers to these questions formed a core feature of the course. This exercise emphasized the urgency of the endeavor undertaken in the course and encouraged students to think about the wider (inter-)disciplinary implications of the topics they studied. The course, being an intensive summer course, took place over five weeks. This meant that it naturally broke down into five sub-topics. The first sub-topic was thematic in focus. It asked students to examine the origins of the current climate emergency. This led them to encounter critical approaches to the popularized Anthropocene, first conceived of in the early 2000s by natural scientists, Paul J. Crutzen and Eugene F. Stoermer. Students read articles on the Capitalocene and listened to a podcast on the Plantationocene (developed by Donna Harroway, a scholar of feminist studies, and Anna Tsing, an anthropologist). Students were asked to think about what processes have contributed to the current climate emergency over the long-term. This demonstrated that the climate emergency cannot solely be understood as a ‘modern’ problem, illustrating the need for historical and other interdisciplinary perspectives. The subsequent four sub-topics focused on different periods in world history during which global climatic factors were particularly adverse, often leading to turning points in several societies’ histories. The aim was to show how states and societies adapted (or failed to adapt) to periods in history during which global climate was particularly extreme or erratic, such as which is projected to characterize conditions under current global warming. These periods were respectively: c.1585-1610, c.1585-1715 (the seventeenth-century general crisis; there was clear overlap with the first period here), c.1780-1840 (the late Little Ice Age), 1876-78 (the ‘global famine’). For each, students had to complete two core tasks. Firstly, they were asked to establish what global climatic factors contributed to adverse conditions, such as El Niño Southern Oscillation (ENSO), volcanic eruptions, and solar activity. Secondly, they had to examine in what ways states and societies responded to adverse conditions, exploring factors that contributed to vulnerability or resilience therein. Climatological sources were integral to responding to achieving the first task. Since the 1990s, the climate emergency has inspired a lot of scientific research on past climatic conditions. For earlier periods (pre-mid-nineteenth century), this is largely through analysis of proxy records, such as tree rings, ice cores, and corals. These can give information on, for example, rainfall and temperature in their locales. Moreover, recently, analysis of several of these records has been used to model global climatic oscillations, such as ENSO, which is known to have teleconnections with regional climates as distant as northern Peru and eastern Africa. They give an impression of past global climatic conditions, thus inviting historians to explore their effects on world history. What can historians do with this new climatic information? Students explored answers to this question in their first assignment, a Source Analysis Paper, which asked them to analyse the utility of Joëlle L. Gergis and Anthony M. Fowler’s 2009 article in Climatic Change, ‘A history of ENSO events since A.D. 1525: Implications for future climate change,’ to world historians. Using various proxies, this article provides a timeline for El Niño and La Niña events since 1525. Sub-questions that students thought about included: How do we, as historians, deal with uncertainty in the proxy records? What opportunities do they provide if they are analyzed alongside ‘traditional’ historical material, such as archives or oral traditions? And, how could ‘traditional’ historical methods be used to validate or question Gergis and Fowlers’ conclusions? Critically evaluating the article in the context of historical methods enabled students to think about how and what we know about past climates, and how to integrate that knowledge into an understanding of world history. Case studies formed the basis of the second core task per weekly sub-topic, that is, assessing the effects of adverse climatic conditions in world history. Students answered two essay questions related to this task, always considering the extent of our knowledge of past climates as they did so. Notwithstanding some notable success stories in the face of adverse climatic conditions (for example, the Dutch ‘Golden Age’ coincides almost exactly with the seventeenth-century general crisis), disasters and state collapse were recurrent themes, whether discussing the seventeenth-century Ottoman Empire, the French Revolution, or the 1876-8 ‘global famine.’ Governments and/or rulers were frequently unable or unwilling to mount effective responses to adverse climatic and environmental conditions, despite the urgency of the situation. The themes of the course were frequently morbid, and this took its toll over the course of the five weeks. The relentlessness of difficult material is something that I will account for in advance if I teach this course in such an intensive format again. However, in order to give students (and myself) relief this time around, I re-arranged and re-designed course materials, especially in the final weeks. I organized more break-out sessions, in which students could collectively discuss and digest materials, instead of just absorbing them on their own (isolation in this context was certainly exacerbated by the fact that I taught the course remotely during the Covid 19 pandemic). I also designed a digital methods session in which students used the KNMI Climate Explorer to map the 1876-8 ENSO event and resultant ‘global famine.’ This gave students a hands-on opportunity to explore primary materials and their implications in a digital environment. The maps that students made and the ways some of them deployed them in their final essays were extraordinary. One student (a computer programming major) even went so far as to design and share a tool to make the Climate Explorer’s rain gauge data more accessible and analyzable through conversion of its tables into CSV files. In so doing, they showed the interdisciplinary potentialities of climate history in action. Of course, though, the morbidity of the themes covered in this world history course has direct implications for how we understand the current climate emergency. The climatic conditions under review, whether during the seventeenth century general crisis or the late Little Ice Age, mostly represent relatively minor natural oscillations compared to our current plight in the face of unprecedented global warming. Moreover, the effects of past adverse climatic conditions were frequently exacerbated by imperial and capitalist expansion, especially in the Global South. The course emphasized the urgency of the current climate emergency, especially as, in line with patterns from the past, capitalism is exacerbating vulnerabilities to adverse climatic conditions in several regions, and governments appear unable or unwilling to build effective mitigative strategies. Current responses to the climate emergency were shown partly as a longer-term continuum of ineffective mitigation strategies across large areas in the face of adverse climatic conditions. As a rule, I designed the course with a view to exploring the multitude of ways in which different people(s) have experienced adverse global climatic factors in world history. This meant not just teaching about empires and states, but also about ‘stateless’ societies, such as indigenous populations in present-day Alaska in the aftermath of the 1783 eruption of the Laki Volcano in Iceland. I also exposed students to variations across socio-economic class, examining how it was frequently the poor and/or bonded/enslaved who experienced the worst effects of adverse climatic conditions. But there is more that I could and should have done here. Gender and generation were themes that I neglected – a significant oversight given that several studies show that it will be women and children (especially girls) who are bearing the brunt of the current climate emergency. Thus, while climatic and environmental change lends itself to teaching a thematic course on world history for the ways it transcends borders, there is a need to also bear in mind what is going on within those borders as well, and to not smooth over social and other differences within them. This will be a challenge when teaching the climate emergency in (world) history moving forward. Dr. Philip Gooding is a postdoctoral fellow at the Indian Ocean World Centre, McGill University working on a SSHRC-funded Partnership project led by Prof. Gwyn Campbell: ‘Appraising Risk, Past and Present: Interrogating historical data to enhance understanding of environmental crises in the Indian Ocean World’. He is also the recipient of a SSHRC Insight Development Grant for his own project: ‘Climate History and Human-Environment Interaction in Equatorial Eastern Africa, c.1780-1900.’ A syllabus of the course can be found here. [1] According to Zachary Hubbard, 'Crome’s attention to the skies allowed him to give an accurate view of the “year without a summer.”... Within this work, the view is blocked by a lingering darkness. The sky is unquestionably dim and heavy with haze. The volcanic sulfates surrounding the world at this time obstructed the view. Looking at the art as it is now, an observer will notice that not only is the sky dark, but the entire picture is bleak. Crome illustrates a dismal time with the darkness of starvation, poverty, and lingering death, instilling a feeling of dread in the viewer' (Zachary Hubbard, ‘Paintings in the year without a Summer,’ Philologia (2019)). In my course, students studied such images and their representations as examples of the effects of global climatic anomalies on human societies, the kind of which are projected to become more frequent and severe during the ongoing climate emergency.
This is the eighth post in the series Historians Confront the Climate Emergency, hosted by ActiveHistory.ca, NiCHE (Network in Canadian History & Environment), Historical Climatology, and Climate History Network. Emma Moesswilde, Georgetown University 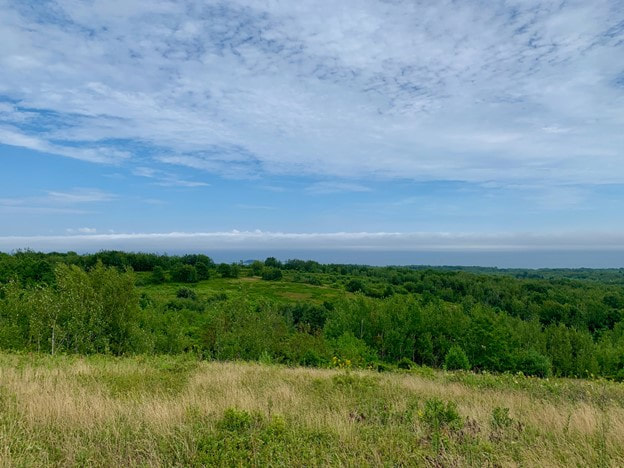 Formerly farmed land, overlooking Penobscot Bay. Photo by author. This summer, the raspberry crop at Daisy Chain Farm was much smaller than usual. The variable winter weather meant that abnormal freeze-thaw cycles caused the raspberry canes to lose their resistance to cold in periods of thaw, making them more susceptible to damage when the weather turned icy again. In comparison to last year’s bumper crop, whose flavor and color filled my family’s freezer and lifted our spirits through a pandemic winter, this year’s raspberries were nowhere near as abundant.
Thanks to the observations of farmers and other food-producing folks, and to the work of climate scientists, we know that such variable weather and its impacts on agriculture and food production are consequences of human-created, or anthropogenic, climate change. For decades, despite insidious efforts to suppress the overwhelming scientific consensus on human-caused greenhouse gas emissions and their impacts on the earth’s systems, it has been clear that changing ecological realities due to climate change have the potential to severely disrupt the systems that provide humanity with sustenance, from industrial-scale grain cultivation to small family farms to fisheries to my local raspberry crop. Like many other aspects of the climate emergency in which we find ourselves, such disruption is a daunting prospect. When I grew up in midcoast Maine, in a rural community in a rural state, the rhythms of the seasons and changes in land- and seascapes were reflected, first and foremost, on the table. To witness agricultural disruptions and to hear about future agricultural threats in a rural state is to acknowledge a shifting cultural and economic landscape that goes far beyond a field, orchard, or lobster boat. My own experiences with environmental and agricultural policy have underscored the importance of a resilient food system and agroecology to ensure a sustainable and equitable future which has the potential to be severely disrupted by the impacts of climate change. Maintaining the integrity of soils, woods, and waters, supporting a new generation of young farmers, and working towards a low-carbon future should continue to take top priority for policymakers at regional, state, and local levels. Such policies and community projects, some of which I have had the privilege to be involved with, deal mostly with the present and the future. Yet for decades, climate historians have also looked to the past to more fully understand the relationship between human history and the Earth’s climate systems. Agriculture has been at the center of many of these studies, as many pre-industrial societies relied on largely on arable crop outputs whose success was contingent on specific meteorological and ecological conditions. All methods of food production, from farming to hunting, fishing, and foraging, were intimately linked to seasonal, annual, and decadal variations in weather and climate. For agrarian societies who relied on arable staple crops such as wheat or rice, the success or failure of a harvest had multifold ramifications for individuals, communities, and economic systems. Many climate historians have therefore focused on the fluctuations of these staple crop yields, considering them in the context of climate variability documented in “proxy” sources such as tree rings, ice cores, or lake and ocean sediments which preserve a record of past changes in Earth’s systems that “signal” variations in the climate. Staple crop yields, such as wheat, can provide a similar signal that demonstrates an abundance or shortage of grain, which in turn can be connected to a failed harvest. A great deal of scholarship has examined the relationship between well-documented grain prices and meteorological shocks which may provoke harvest failures and even – some argue – trigger devastating episodes of, for example, famine or civil unrest. This is especially common for the period known as the “Little Ice Age,” where the global climate system experienced widespread disruption due to the interaction of volcanic eruptions, decreased solar activity, and atmospheric circulation shifts. These climatic disruptions manifested in different ways and at different times between 1300 and 1800 CE, and were especially notable in the Northern Hemisphere, where cooler-than-average temperatures and unpredictable, often extreme storms and weather patterns characterized much of the period. As influential and valuable as some of these perspectives are, I find it difficult to make connections between the rise and fall of pre-industrial grain prices during past episodes of climatic extremes, and the realities I’ve witnessed in agricultural communities today. Such analyses offer, at best, a bird’s-eye view of complex processes of ecological change, agricultural work, and large-scale economic shifts. Often, though, this kind of simplification obscures many of the nuances of the relationships between climate and agriculture, including local processes of adaptation in the past which can offer perspectives on the impacts of climate change on our present and future. It also focuses historical perspectives on periods of extreme climate change, crisis, and disaster, when research has shown that unpredictable, variable weather patterns, rather than isolated events, often presented the greatest ongoing challenge to farmers. Today, as in the past, farmers, food producers, and communities that depend on agricultural and rural work are coping with the consequences of a warming climate and disrupted earth systems that impact countless local agroecological factors. Efforts to mitigate immediate risk, build a climate-resilient agricultural system, and remain financially viable all require time, expertise, and resources. The realities of food and economic systems today mean that it is enormously challenging to meet all these goals, let alone in the same way and at the same time. As has become abundantly clear over this past summer of extremes – in case it wasn’t evident enough before – the impacts and consequences of the climate emergency are multifold and sometimes difficult to distill into price series or other quantitative data. An over-emphasis on markets, rather than human beings and ecosystems, is an abstraction of the complicated role of climate change which can often be illuminated more effectively through storytelling projects and firsthand experiences. As a climate historian living in the climate emergency with deep concern for its impacts on the rural places and people most dear to me, my research on the impacts of climate change on agriculture is personal as well as academic. The questions I ask of my sources in the past are the same ones that I and many others ask in the present and future: What changes can we make? How can we restore what has been lost? What does adapting for next year look like? How about the following year, or ten or twenty years after that? These answers have layers of urgency: my own scholarly curiosity, my concern for my own communities and the many others like them, and my hope for policy agendas that foster the adaptations needed to ensure the safety and resilience of agricultural land and those who live and work with it. My recent research into the long-term consequences of extreme weather on English agriculture has been conducted in two modes. In the first, I look for stories, not of loss, but of gain: the experience of farmers that encouraged them to diversify the crops they sowed, change the recipes of the bread they baked, and recognize the impacts of frigid temperatures on soil fertility to change their sowing and harvest schedules accordingly. In the second mode, with an eye on today’s unseasonable weather and an ear to the often-bleak news cycle, I look for hope; a reminder that agricultural communities have often persisted, in the past, with flexibility, commitment, some loss, and some luck, in the face of adverse climatic conditions. I am under no illusions that agricultural techniques from pre-industrial England are a panacea for the challenges facing my own community – nor does my research into adaptation strategies offer an exact roadmap for agricultural policy in New England. The stakes are very, very high – we stand to potentially lose much more than a year’s raspberry crop. But the research that I and others are conducting now, oh-so-urgently, also offers examples of local adaptation supported by widespread participation on multiple scales to create resilient communities and food systems. There are more variable frost and thaw cycles to come; challenges to climate resilience seem to be around every corner. But next year’s harvest is not yet determined – new irrigation strategies, hardier crop varieties, and carbon-sequestering till methods are just some of the strategies Daisy Chain Farm and others like it has been introducing to mitigate the effects of a changing climate. When the problem of climate change seems too large, I think of stories like this one, where two years’ worth of raspberry crops illuminate the challenges we face in the climate crisis as well as the resilience of humans and agricultural ecosystems in the face of change. In my own research, I look for more stories that highlight the expertise, adaptation, and hard work of rural communities during periods of climate change in the past. I know these stories exist because I grew up in such a community myself, and history is rich with others like it. Bringing the intertwined histories of rural life and climate resilience forward offers not only potential adaptation strategies for agricultural communities today, but the hope needed to continue working for good harvests of all kinds in the years to come. This is the seventh post in the series, “Historians Confront the Climate Emergency,” hosted by ActiveHistory.ca, NiCHE (Network in Canadian History & Environment), Historical Climatology and Climate History Network. Dr. Alan MacEachern, Western University 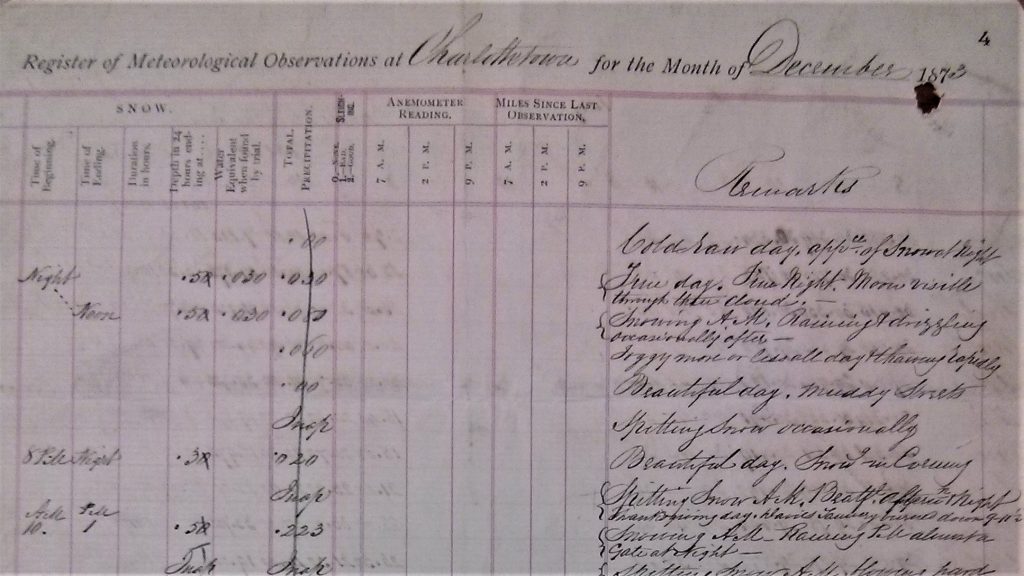 Environment Canada meteorological observation, Charlottetown, PEI, December 1873. They say that climate is what you expect but weather is what you get. Or they used to say that. Now, the climate seems to be changing as quickly and unexpectedly as weather. When New York’s Central Park receives a record 48 millimetres of rain in one hour and then, just ten days later, a different storm system dumps 79 millimetres in one hour, it feels as though more than just weather is at work. And why wouldn’t climate be changing rapidly? It used to take millennia for atmospheric carbon dioxide levels to fluctuate just ten parts per million. Now it takes five years. That cannot be good news for anyone. I taught environmental history for twenty-plus years before developing a course in climate and weather history. It had taken me a while to recognize the centrality of climate change to environmental affairs, longer to become well-informed on the topic, longer still to feel competent enough to teach it, and longer still to determine how to structure such a course and what I might contribute. But in 2014, having helped bring Environment and Climate Change Canada’s extant historical weather observations to my university’s archive on long-term loan, I knew it was time to take the plunge. I developed a course around the meteorological collection, used its material in lectures and seminar activities, and devoted full assignments to it. And the course was a bust. As impressive as the Environment Canada collection is – the continuous record of a single, long-running and still-operating meteorological service across one of the largest countries on earth – it simply did not work as the course’s foundation. I had hoped to connect nineteenth century nations’ commitment to “inventory science," including the gathering of information about weather, to our gradual understanding of climate, then climate change, and then the fact that we are changing it. But I was largely unable to help students make the leap from the prosaic, daily, local observations of weather to the vital, long-term, global matter of climate. Whereas, for example, the story of one soldier can stand in for an entire battle or army or war when teaching, a single weather observation or observer or station can hardly do the same. If anything, weather got in the way of climate. Students may well have felt that climate was what they expected, but weather was what they got. 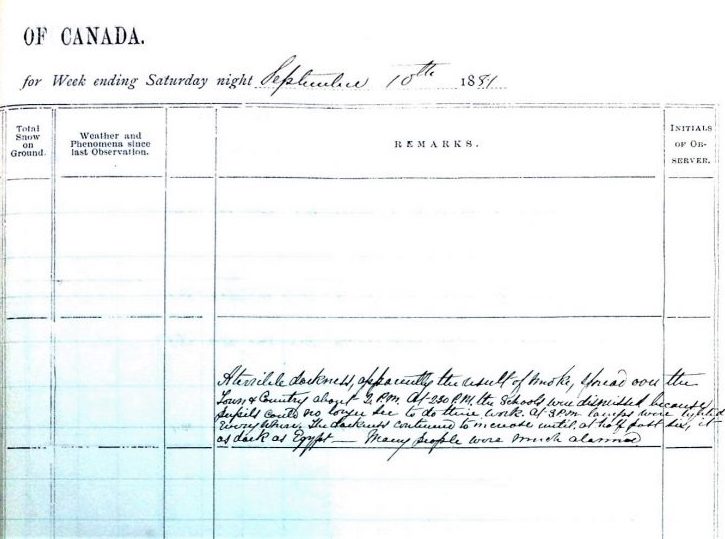 Environment Canada meteorological observation, Kincardine, ON, September 1881. So I switched to teaching a new course on the Anthropocene, the idea that humans are now having such an unprecedentedly massive and for all intents and purposes permanent effect on the planet that it constitutes a new epoch not just in human history but in Earth history: we are in a new geological age. Climate plays a major role in the course, but it is joined by discussion of biodiversity loss, land use change, population, resource extraction, and much more. This has been a far more successful course and has attracted more students. What students appreciate, I think, is that the course calls on them to consider the dramatic changes in how people have lived in the recent past, and the dramatic changes that has had on the planet, but also how individual people, objects, and moments have contributed to or illustrate these changes. What I appreciate is that history arrives as something of a Trojan horse: if we accept that we are now in the Anthropocene, when did it begin, what has sent us down this path? Teaching the Anthropocene has proven a useful way to introduce history to environmentally minded students from across the university.
But no matter how much discussion of climate the Anthropocene course contains, there is little room in what is essentially a jam-packed history of the world for discussion of weather and meteorology. What I love about the Environment Canada meteorological collection, and what I had hoped to share with students, was the chance to observe Canadian weather observers volunteering to regularly and faithfully maintain and submit environmental information about their hyper-local circumstances, with only the promise of the most nebulous long-term national and societal goals to sustain them. And I wanted students to see how Canadians of the past knew weather and nature, what they found worth mentioning, and how they expressed it. But such topics have not fit easily into the Anthropocene course, and have been relegated largely to my research. I wonder if, in essence, my experience teaching climate and weather has ended up mirroring the topics themselves. With climate moving at the speed of weather of late, there has been far more interest in climate and weather – but in weather (other than in terms of the immediate effects of extreme events such as hurricanes) largely because of its relationship to climate. As journalism is said to be the first draft of history, weather is the first draft of climate, and has become of general interest largely because of that, not as a subject to be explored and understood in and of itself. And that’s a shame. This is the sixth post in the series Historians Confront the Climate Emergency, hosted by ActiveHistory.ca, NiCHE (Network in Canadian History & Environment), Historical Climatology, and Climate History Network. Molly Swain, University of Alberta  Molly Swain is a Métis woman, or otipêmsiw-iskwêw, from Calgary, Alberta (otôskwanihk), in Treaty 7 territory, Métis Nation of Alberta (MNA) Region 3, currently living in amiskwaciwâskahikan (Edmonton), MNA Region 4, Treaty 6 and Nehiyaw-Pwat (Iron Confederacy) territory. A PhD student in the Faculty of Native Studies at the University of Alberta, Molly also co-hosts otipêyimisiw-iskwêwak kihci-kîsikohk (Métis in Space), an Indigenous feminist science fiction podcast, along with Chelsea Vowel. She is part of the directorship of the Métis in Space Land Trust and a member of Free Lands Free Peoples, an anti-colonial penal abolition group. Politically, Molly describes herself as an Indigenous, specifically Métis, anarcha-feminist, with the goal of “total anti-colonial liberation,” including “the destruction of white cis-hetero-patriarchal supremacy, colonialism, capitalism, ableism, and states, as well as the regeneration of both new and remembered ways of living together with the land and with one another,” humans and other-than-humans alike. Series co-editor Edward Dunsworth spoke with Molly over Zoom on 14 July 2021. Transcript edited for clarity and length. Edward Dunsworth: Thank you, Molly, for speaking with ActiveHistory.ca. We are thrilled to have you participate in this series. To begin, could you tell me a bit about Back 2 the Land: 2 Land, 2 Furious? But before we get to that, you must tell me: are you excited for the release of F9? Molly Swain: So, full disclosure, the Fast and Furious franchise is very much my co-host [of Métis in Space] Chelsea’s jam. I can’t really watch car crash movies. Back 2 the Land: 2 Land, 2 Furious is sort of an extension of our science fiction podcast. They may seem very different, but in our minds, they’re quite intimately connected. When Chelsea and I started the podcast in Montreal back in 2014, one of the things that we wanted to do was to get back to our home territories in Alberta, which finally was able to happen in 2016. Our initial plan was to live outside of Edmonton, in Chelsea’s community of Lac Ste. Anne (manitow-sâkahikan). And things didn’t really work out that way. But it’s something that always sort of stuck in our minds, that it’d be great to have land that we could bring people out to, especially folks who live in the inner city of Edmonton, who maybe don’t have access to non-urban spaces to do traditional activities, learn skills, to form those kinds of relationships that are often harder to do in urban spaces – especially in the inner city which is so heavily policed, both by actual cops as well as by settlers. So we talked about it and said, “Let’s just put it out into the world and see what happens.” We started a fundraiser, thinking that it would take probably two to three years to approach the amount of money that we would need to buy a piece of land. And lo and behold, a couple of weeks later, a guy from the States, who we call our “sugar settler,” got in touch and said, “Hey, I have tons of money. And I would like to give you money to buy a piece of land.” And we said, “Okay, buddy, tell us another one. Like, we’ll send you our credit card information, we’ll give you our social insurance numbers, right?” We were like, “it’s a scam.” But as it turns out, he was completely serious. So our two- to three-year timeline shrunk to about three months, and we found a piece of land that is absolutely incredible. Chelsea calls Lac Ste. Anne County an exercise in futility to make it really productive agricultural land. It’s sort of semi-muskeggy, semi-forested – just not the best for agriculture, but it’s perfect for what we’re interested in. So we have most of a small lake, we have sort of a swampy muskeggy area, we have some rolling hills, and we have some forests. The biodiversity is amazing.  ED: How does “land back” relate to the climate emergency? And what role should the return or transfer of land and resources to Indigenous and other historically dispossessed peoples play in climate politics?
MS: The first thing that comes up for me is that well-trod statistic that Indigenous peoples protect 80% of the world’s remaining biodiversity. I think that’s a good place to start when we’re thinking about land back in relation to climate change and the climate crisis. But the other thing that we miss out on, thinking about this from a historical perspective, is that while Europe was stripping its land base of things like arable soil, forests, fish, other resources, Indigenous peoples in the Americas were living lives of incredible abundance in balance with the land. You read old missionary journals, and the missionaries are stunned at the abundance and the wealth that they’re encountering. They’ll write about how they can just pick food up off the ground, it’s just lying there ready to eat, right? So we have to understand that Indigenous peoples continue to protect biodiversity and biodiversity is also, in a lot of ways, a form of wealth and abundance. And that so much of European history, particularly in the modern and colonial periods has been about extracting that abundance and that wealth and moving it because they’ve already stripped their own lands of those resources. Indigenous peoples are [engaging with the land] in balance. There are instances where an imbalance occurs, but you also hear about how Indigenous peoples took active steps to correct imbalances right away, which requires a level of scientific and relational knowledge that really continues to elude Euro settlers and these contemporary settler states. Dr. Paul Gareau has referred to this as the technology of relationality. I think it’s really important that we understand this knowledge as something that’s spiritual and cultural, but that is also scientific and technological. [On the other side], to me, it really boils down to what Aileen Moreton-Robinson has called white possessiveness. Her theory is that whiteness exists in order to possess, to transform relations into possessions, into things to be owned, used, exploited, etc. And so we can really see white possessiveness as this foil to a more relational way of understanding the world and all of the beings in the world. One of the questions that I have and have been thinking about in relation to this recently is: can we start building relationships with settlers? Can settlers start to do the work of relationality without dismantling whiteness? What are we, as mainstream society, willing to do in order to bring the way that we live in the world back into balance? That’s a big question. But I think one of the tried and true, proven methods of doing that is land back, the literal return of the land. And not just this idea of traditional territories. All of the land is Indigenous land, and all of the land needs to be returned to the sovereignty of Indigenous peoples. That also means the return of Indigenous capacity to make decisions regarding the well-being of the land, and the peoples and other-than-humans that live on the land, right? A lot of the critiques of land back that I’ve seen are like, “Oh, you just want to have Indigenous ethno-states” and this and that. And, of course, the answer is no. What it’s about is the righting of historical injustice, and about recognizing that Indigenous peoples have the scientific knowledge and technologies to address this massive imbalance that settler colonialism has created. ED: You speak sometimes on your podcast Métis in Space and elsewhere about “Indigenous futures.” Can you explain what you mean by this, and how the climate emergency informs your perspective on Indigenous futures? MS: Métis in Space, is an Indigenous feminist science fiction podcast. Well, we do speculative fiction, which is sci fi, fantasy, and horror. But science fiction is our original love in a lot of ways. And science fiction is really all about imagining futures and imagining other ways of being. It asks some of the big questions, like, what is the nature of life? Of being human? How can we solve our biggest crises? How can we relate to one another better? The genre answers those questions through world building, building worlds where these conflicts and questions can be staged. And both the worlds and what populates those worlds – cool technologies, novel forms of governance, interesting aliens, all of that – has really tended, in the mainstream, to reflect white colonial visions, anxieties, and ideas about what the future can and should look like. So what we’re interested in doing with the podcast is in part to intervene in these narratives and to offer alternatives by doing world building ourselves. We do that through Indigenous futurism, a term coined by Anishinaabe scholar Grace Dillon that my co-host Chelsea Vowel has adapted to the Métis through her work on Métis futurisms. So, Indigenous futurisms are basically about reading Indigenous people back into the future. So much of what settler colonialism is about, so much of what this mythology is built on, is that Indigenous peoples are disappearing, dying out, not suited to modernity, not able to survive in the future because we’re stuck in the past, etc. Indigenous futurism has this radical idea that Indigenous people will exist in the future, and that our futures can look Indigenous. We’re not going to be assimilated. We’re not just going to exist on the margins, hyper-dispossessed. Radical transformation is possible, and Indigenous peoples can lead that with cool Indigenous technologies, with cool Indigenous forms of governance and ways of relating, by interacting with alien species in a way that is not necessarily about conquering or about being threatened or threatening (thinking about the invasion narrative as a settler anxiety of encountering a species that is going to do to them what they have done to Indigenous people). So I think Indigenous futurisms are a form of what Daniel Heath Justice has called “imagining otherwise,” but also a form of remembering otherwise. It’s calling back to the relational networks and obligations of our ancestors, to build towards futures for everybody. There are a few areas where I think where this intersects with the climate emergency. The first is Elizabeth Povinelli’s idea of toxic sovereignty, where no matter what happens, Indigenous relationships to the land are such that we will be on the land and with the land no matter what. She uses the example of uranium extraction sites in Australia that have been essentially abandoned by the state. Nobody’s really supposed to live there. But Indigenous people still go to that land, they’re still on that land, they still live with that land. And they exercise sovereignty in a way that they weren’t previously able to, because the state has basically abandoned it. That’s a form of toxic sovereignty. As the climate crisis intensifies, there are probably going to be similar spaces where the state does not have the same kind of grip on the land and on the people. So toxic sovereignty, I think, is one really interesting thing to think through, not just for Indigenous people, but about how everybody is going to live on and relate to the land in the future. I think another key piece is the recognition of the personhood and autonomy of other beings, including those in the spirit world. Eden Robinson’s work – her Trickster trilogy – is fabulous for that. My co-host Chelsea Vowel is releasing a book of Métis futurist short stories, Buffalo is the New Buffalo that I really recommend folks check out when it comes out in April 2022. Another piece is going to be about recentering and honouring Indigenous queer, trans and Two Spirit people in our societies and in our futures. Joshua Whitehead’s Love after the End anthology is so fabulous for that if people are interested in an Indigenous futurist take on that. ED: Fascinating – I’ve never heard of the concept of toxic sovereignty. It seems like almost like the flip side of the coin of environmental racism. With environmental racism we typically think of people being shunted onto degraded lands, or being restricted to them, whether through government policy or market forces. This is kind of the flip side of that, with lands being damaged by colonial extraction and capitalist activity, and people being linked to those lands not through coercion but because these are their homelands. MS: I think it’s really important to recognize that toxic sovereignty is something that has, to a certain extent, some liberatory potential but still exists within this framework of intense environmental racism and violence. Toxic sovereignty can only exist through colonial violence, which doesn’t make that okay. But I think that toxic sovereignty helps us to imagine what it means to live on a planet that is not ideal for human life and thriving. In the context of state abandonment, who do we turn to? How do we exercise sovereignty? And by that I mean, how do we fulfill our relational obligations? Thank you to Megan Coulter for her work transcribing this interview. This is the fifth post in the series Historians Confront the Climate Emergency, hosted by ActiveHistory.ca, NiCHE (Network in Canadian History & Environment), Historical Climatology, and Climate History Network. Dr. Barbara Leckie, Carleton University 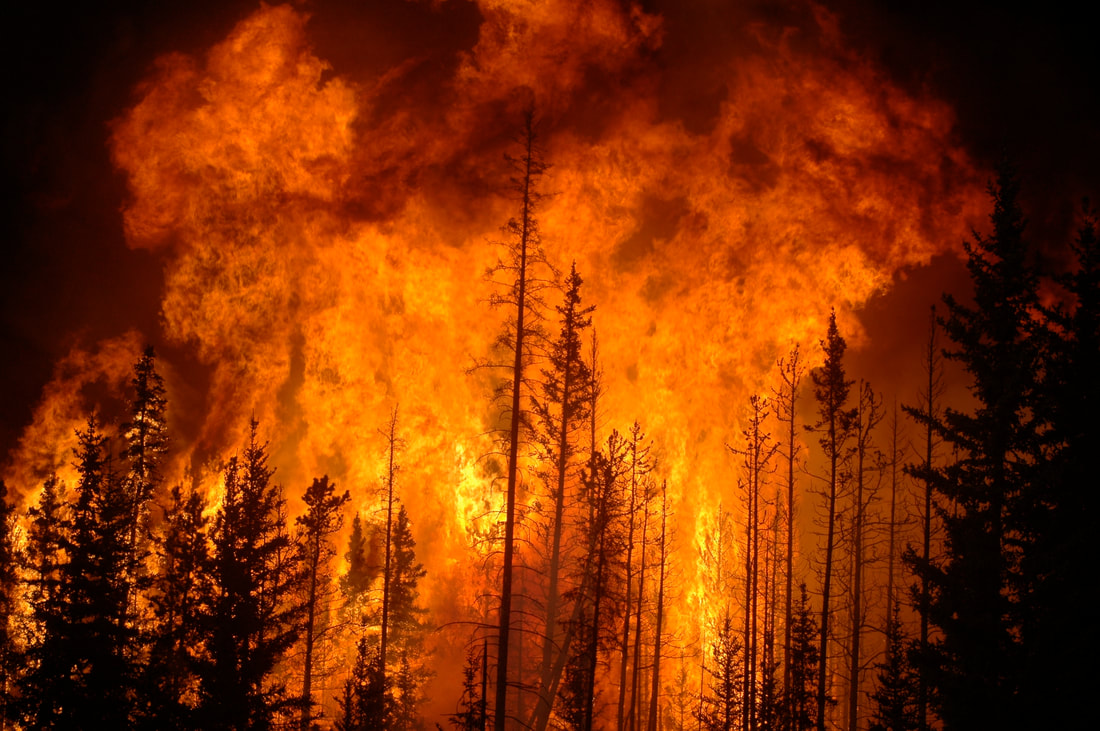 Cameron Strandberg from Rocky Mountain House, Alberta, Canada, CC BY 2.0 The rhetoric of warning, emergency, and alarm is everywhere in climate change coverage. Headlines flag the recent release of the IPCC-1 as our “starkest warning yet,”[1] cities and institutions around the world announce climate emergencies, and academic studies draw on the metaphor of the fire alarm in an effort to convey the urgency of the crisis.[2] As different as each of these registers are, they all invest in the view that warnings are not idle but activating: that they will do something. Greta Thunberg is perhaps the best-known public commentator to combine all three of these rhetorical terms—warning, emergency, and alarm—in her many calls for climate action. Consider her speech to the World Economic Forum in Davos, Switzerland on 25 January 2019 in which she focuses on the latter, the fire alarm. “Our house is on fire. I am here to say, our house is on fire.” In the conclusion to her speech, she returns to the metaphor of the house on fire: “I want you to act as if our house is on fire. Because it is.” I agree that the climate crisis is an emergency. I agree with the warnings and alarms. But I also wonder if there is a saturation point on climate warnings and alarms? And, worse, I wonder if they might thwart the very action for which they advocate. To be sure, immediate and sustained climate action is necessary and it has never been more urgent than now. News media have translated the science into terms that gain the attention of a general reading public. And Thunberg’s mobilization of phrases like “our house is on fire” have catalyzed action, contributed to a worldwide youth movement focused on climate action, and inspired global movements like Extinction Rebellion. They’ve also given ballast to the Green New Deal and related proposals for a green economy less wedded to sustainability discourses. One would be hard-pressed to say that her rhetoric of warning, emergency, alarm, and warning has had no impact. But has this rhetoric had other, less inspiring, impacts as well? Consider J. L. Austin’s work on speech act theory. His elaboration of the warning as a performative—a speech act that performs what it says—in How to Do Things with Words maintains that warnings need to meet three requirements: they should signal an immediate danger, they should be plausible, and there should be clear protocols for action.[3] Although most climate warnings meet the first two requirements, many do not meet the last requirement. Because there are few clear protocols for climate action on individual, local, national, global, or planetary scales, the alarm is sounded but often those who heed the alarm are not sure what to do next. There’s a clear sequence for the house on fire scenario: the alarm rings, the inhabitants of the house are alerted, they leave the house, they call the fire department. But how does this metaphor translate for climate action? Not well. To be sure, the alarms may be rung, and people may even leave the real or figurative house (an endangered territory or region or, in some cases, country). But who exactly is the fire department? Is it the government? Corporations? Individuals? The IPCC? Indigenous elders? Policy makers? All of the above?[4] There are lots of impassioned views on where to turn but little agreement. Two things are clear however: there has been no effective resolution thus far; and given that we have only a decade to act decisively, it is highly unlikely that these debates will be resolved in way that yields effective action in that time. We have been warned about the climate crisis, the alarm bells have been ringing for decades, but carbon emissions continue to rise (even with the significant slowing down of the economy during Covid).[5] So, too, do racial and economic injustices, to which the climate crisis is inextricably bound. And so, while warnings have been effective in some ways, they have not been effective in the ways that are most necessary. In fact, they may be counterproductive. They may be bolstering the very neoliberal economy that many climate thinkers hold responsible for preventing action on the climate crisis in the first place. The alarms instill fear. And fear is a powerful vector through which neoliberalism operates. It enables, as we saw in the wake of 9/11, the passing of bills and waging of wars that would otherwise be met with greater resistance and dissent. It enables, as we saw then and continue to see now, the introduction of surveillance systems, the limiting of certain freedoms and the exercise of others, and it provides the rationale for a whole set of regulations, loosenings, and austerity claims that would have been unimaginable without the alarm. The alarms, in short, terrify. When we feel “under tension,” the actions we most desire are those that will reassure us that we should not be afraid, actions that contradict the alarm, throwing its very validity into question. If we are, as a society, investing in oil companies, for example, and bailing them out in the pandemic, then surely the climate crisis is not as bad as we think. If our friends are flying and living as they usually do and, importantly, if we do too, then surely the calls to alarm are not merited. For as Bruno Latour notes, climate projections are descriptions (constatives) that are also warnings (performatives). The problem is that because they do not dictate specific actions adequate to the climate predicament (and, I would argue cannot), we seek solace elsewhere. It is a situation designed to make us all climate deniers for the welcome relief that such denial brings.[6] We want to believe that those projections do not mean what they seem to mean. What is the alternative? Here I find Walter Benjamin’s commentary on the rhetoric of the fire alarm in the interwar years helpful. It offers insight into both why warnings to date have been unsuccessful and how, inflected differently, they might succeed. In the years leading up to the Second World War, Benjamin presciently remarks that the continuous alarm is the catastrophe. What is needed in its place, he argues, is not the state of emergency that a constant ringing of the alarm registers but rather a “real state of emergency” spurred by what he calls “interruption.”[7] Alarms, warnings, and emergencies should interrupt our lives. They should ask us to stop what we’re doing and to respond to the alarm. In the absence of a clear course of action, what might it mean to hold open the interruption? Benjamin’s call for interruption, variously defined, is tricky precisely because it is performed. Its performance resists representation in language just as it also resists the temporal models to which we’re often accustomed in the Global North (and, notably, on which the alarm relies).[8] Benjamin’s rethinking of temporality in tandem with his materialist history draws out a point that anatomies of alarm often neglect: the privileging of interruption as a critical mode to address social and political crisis. In doing so, Benjamin divides the potential work of the alarm between a call to action, an anxious awareness of danger (being “under tension,” panicking, the ongoing emergency), and a real state of emergency. The real state of emergency interrupts all of these definitions by interrupting the structure through which they are understood and instead locates action in forms of response that reconfigure existing temporal models in new ways. Let’s return to Thunberg’s remarks cited above: “I want you to act as if our house is on fire. Because it is.” Between the “as if” and the “it is” Thunberg captures the cognitive dissonance experienced by so many living in the Global North today. The climate emergency feels unreal (“as if”) and yet most of us also know the emergency is real (“it is”). Climate warnings uphold a linear timeline that cannot comprehend this sort of dissonance. The warning interrupts the line but instead of being an opening for confronting the crisis, it doubles down on the line and intensifies the emergency (that continuous alarm I referred to above). Benjamin, by contrast, mobilizes the warning to hold together performative contradictions—the “as if” and “it is”—and to create a space for thinking, as he puts it, “quite otherwise”.[9] What this quite otherwise might look like in the days and years to come is for all of us to envision and realize. Doing so, however, will involve a departure from the very temporal structure that the previous sentence, and this post overall, upholds; it will involve a honing in, instead, on a now constellated with co-written and open possibilities that will, in changing the time, change our times. Barbara Leckie is Professor in the Department of English and the Institute for the Comparative Study of Literature, Art, and Culture at Carleton University, Ottawa. She is the author of Open Houses: Poverty, the Architectural Idea, and the Novel in Nineteenth-Century Britain (2018) among other books and articles. She is the editor of Sanitary Reform in Victorian Britain: End of Century Assessments and New Directions (2013); and co-editor, with Janice Schroeder, of an abridged edition of Henry Mayhew’s London Labour and the London Poor (2020). She writes often on climate change and the humanities and is the founder and co-ordinator of the Carleton Climate Commons. [1] There are similar headlines referencing warning in CBC, CNBC, and The Economist. But when one turns to the Report itself, there are no deafening by alarm bells. Indeed, in its 4,000 pages, the word alarm is used only twice, emergency four times (once in a citation and three times in the bibliography), and the word warning thirty-one times (none of which, notably, suggest that the Report itself is a warning. In the case of warning, the references are to either heat warnings or early warning systems and, as noted, none issue an overall call to warning. Over half of these references, moreover, are in the bibliography.
[2] See Naomi Klein’s This Changes Everything and On Fire: The Burning Case for a Green New Deal, Andreas Malm’s Fossil Capital and The Progress of This Storm, and Bruno Latour’s Facing Gaia to name only a few. [3] J.L Austin, How To Do Things with Words (New York: Oxford University Press, 1962). [4] In response to the IPCC Report, Frank Van Gasbeke notes the following in Forbes: “And yet, the unprecedented IPCC mayday call is nowhere met with a state of emergency declaration. Not in the US nor anywhere else. The paradox is that the threat of quality and loss of life is higher now than it was for any war or plague in history.” The article that follows details one of the few elaborations, albeit brief, of what a declaration of world emergency could set in motion. He concludes, “In essence, a state of emergency would not only constitute a significant act of care to avoid a crime against humanity. It would be a formidable initiative to reclaim global leadership with ensuing benefits for new technologies and industries, including a new standard-setting for quality of life.” Vas Gasbeke imagines a response commensurate to the emergency. What I am outlining in this short post, by contrast, are the calls to emergency and alarm that, in the absence of action, mute the credibility of the alarm system without at the same time muting the danger to which the alarm points. [5] In an interview with Julian Brave NoiseCat, Katy Lederer comments: “I read that the Yale Program on Climate Change put out a poll saying that the number of Americans who are “alarmed” about climate change has doubled in the last five years, to 24 percent. But it doesn’t always feel like being alarmed really makes much difference as a political actor.” [6] See Jonathan Safran Foer for a discussion of his own climate denial, Kari Marie Norgaard for a discussion of its impact on a Scandinavian community, and Allen MacDuffie for an excellent pre-history to this structure of denial in the nineteenth century. [7] Walter Benjamin, “Theses on the Philosophy of History,” Illuminations, translated by Harry Zohn (Harcourt, 1968), 257. [8] Many Indigenous views also convey richly layered temporal models that depart from the default linearity of the Global North. See, for example, Nick Estes, Robin Kimmerer, and Kyle Whyte among others. My point in this brief post is not to single out only one possibility for the articulation of new temporal modes, but rather to recommend the multiplication of possibilities. I offer Benjamin’s work, accordingly, as one example among others. [9] Walter, Benjamin, Selected Writings, edited by Howard Eiland and Michael W. Jennings (Harvard UP, 2003), Selected 4: 402. This is the fourth post in the series Historians Confront the Climate Emergency, hosted by ActiveHistory.ca, NiCHE (Network in Canadian History & Environment), Historical Climatology, and Climate History Network.  Ingrid Waldron is the HOPE Chair in Peace and Health in the Global Peace and Social Justice Program in the Faculty of Humanities at McMaster University and the author of There’s Something In The Water: Environmental Racism in Indigenous & Black Communities (Fernwood, 2018). Dr. Waldron spoke with series co-editor Edward Dunsworth over Zoom on 30 June 2021. Transcript edited for clarity and length. Edward Dunsworth: Thank you, Dr. Waldron, for speaking with ActiveHistory.ca today. Your 2018 book, There's Something in The Water, about environmental racism against Black and Indigenous communities in Nova Scotia, has done exceptionally well. Currently in its third reprint, it also was the inspiration for the documentary film of the same name, co-directed and -produced by movie star Elliot Page, that premiered at the Toronto International Film Festival in 2019 and is now streaming on Netflix. Could you tell us a bit about how the book came about?
Ingrid Waldon: I had planned on writing a book, but perhaps not so soon. Since starting the Environmental Noxiousness, Racial Inequities & Community Health Project (ENRICH) project in 2012, I’ve been keeping detailed notes. [Editor’s note: ENRICH is “a collaborative community-based research and engagement project on environmental racism in Mi’kmaq and African Nova Scotian communities.”] So I knew that I would use that at some point, but I was planning on a different type of book that would look at the challenges of doing community based research, in general. I was approached by the publisher of Fernwood about writing a book on environmental racism in Nova Scotia. And I thought about it and said yes. The book talks about the ENRICH project, the challenges of community-based research, and the health impacts of environmental racism, all within the context of settler colonialism, heteropatriarchy, and neoliberalism. An important goal of mine with the book was to give voice to the Black and Indigenous communities I engaged. I wanted their voices to be at the forefront. Many of the chapters include direct quotes from them that articulate their experiences and their thoughts on the issues. ED: Tell me a bit about the response to the book and how it eventually led to the documentary film. IW: Well, finally having the book out was really exciting. I did the typical book launches in Nova Scotia and Montreal. The Montreal book launch in 2019 was huge – like 400 people – and they ran out of books. The book has been selling well, despite the fact that Fernwood is a small publishing company. One morning in late October of 2018, I noticed that I had a new follower by the name of Elliot Page. At the time, I did not realize that it was the actor. So I didn't think anything about it. And then three weeks later, I noticed that the page was extremely busy and that Elliot Page had been promoting my book to his followers. I thought, is this the actor from Juno? From Inception? I said, "No, this couldn’t be.” I've never had any celebrity follow me or anything like that. So this was a bit of a shock. But of course it was the Elliot Page. So I reached out and sent him a direct message to thank him for promoting the book, and we began to exchange messages. Eventually we spoke over the phone and began bandying about ideas about how Elliot could support this work. After meeting with Elliot and the three Mi'kmaq women in the film, the grassroots grandmothers, we decided to create a series of short videos that we could post on social media to raise awareness about environmental racism. So in April 2019, Elliot came up and he travelled to the communities and filmed interviews over six days. When Elliot and Ian Daniel, the co-director, showed me a rough, partially completed version of the film, I said, this is emotional. There are people crying. I don't think we're going to do justice to these stories by posting ten-minute clips online. I said to Ian Daniel and Elliot Page that I really thought we needed to do this justice. This is an important topic. And they all agreed. I started talking about the Toronto International Film Festival - you know, "go big or go home." We almost missed the deadline. But we got it in and the film was of course accepted. In September, we all went down to Toronto for the festival, including most of the women in the film. Elliot was kind enough to bring us all down. And I can't tell you how exciting it was. We spoke with media from around the world. It was just a rush. And I would say that beyond the excitement for me is just the impact that it has had, in terms of people reaching out to me and offering to support the communities in various ways. When I left the premiere of the film at TIFF, I was walking to my hotel and I had literally three people stop me on the street to offer to pay for the well in Shelburne. ED: What were some other impacts of the film? IW: Three main things happened after the film was screened at TIFF. I'm not going to say they were only due to the film – I'm not taking anything away from the [decades of organizing by] Mi'kmaq, Indigenous, and Black community members. But I questioned why these things didn't happen before. It demonstrates the power of the media. First of all, after the TIFF screening, Nova Scotia’s government announced that the pulp mill that had been pumping effluent into Boat Harbour in Pictou Landing First Nation since 1967, would close at the end of January 2020, which did happen. Second, [related to the longtime efforts of Mi'kmaq communities to halt the Alton gas project] in March of 2020, for the first time ever, the Supreme Court of Nova Scotia ruled that consultations with the community regarding the project had been insufficient and ordered the Nova Scotia government to go back and consult the community for 120 days. And third was Elliot Page’s gift of a new community well to the Black community in Shelburne. All these things have transpired since the film, and once again, I'm not taking anything away from the [Mi’kmaq and Black] communities and their grassroots mobilizing, but the power of film, the power of media, the power of celebrity, I think put all of this in place in many ways. Everything that we've all been doing is also significant. Community-based research for me as a professor, community mobilizing, grassroots resistance, marches, petition signings, letter writing campaigns, all of that is important. But what I've learned is that everything has to go hand in hand. And it also has to include legislation. People always say to me, what do you think is most important? Is it the grassroots mobilizing? Is it the policy? I always say it's all of them, it's never one thing. ED: You're not a historian in the strict disciplinary sense of the word. But you have a rich historical perspective in the book: in a broad sense, by bringing in the histories of colonialism and slavery, but also in a more localized sense, engaging with the histories of Afro-Nova Scotian and Mi’kmaq communities and the racism they faced. From your perspective, why is a historical perspective important to understanding environmental racism? IW: The first reason, with respect to environmental racism or any issue, is the tendency for some people, typically white people, to say, "Yeah, but that was in the past. Why can't they just get on with it?" My response to them has always been the past is the present and the present is the past. Using an example from my book, it’s important for people to understand why, for example, Black communities live where they live in Nova Scotia. Nova Scotian Black communities are very different from other Black communities in Canada. They're the oldest Black community in Canada; they've been here for about 400 years. They are descendants of Jamaican Maroons, Black Loyalists from the United States, and others. When they arrived in Nova Scotia, they were given poor quality land, which made it difficult for them to engage in agriculture. And that's the land where landfills and dumps and other environmentally dangerous projects tend to be located. So we have to understand the history of African Nova Scotians in order to understand why they live where they live and why environmentally dangerous projects have tended to be placed in their communities. ED: Turning to the question of the climate emergency, what lessons do the history and contemporary practice of environmental racism in Nova Scotia and Canada hold for how we as a society approach the climate crisis? IW: The disproportionate impacts of the climate crisis on Indigenous, Black and other racialized communities is connected to environmental racism, which people are largely not discussing. When you look at environmental racism, Indigenous, Black, other racialized communities are impacted because of the structural inequities that they already face. They are racialized, they're low income, they live in isolated communities, they suffer from income insecurity and poverty and food insecurity, housing insecurity, public infrastructure inequities. So those social determinants of health actually create exposure, make them more vulnerable, make them less likely to be able to fight back because of their lower socio-economic and socio-political status. Those same social determinants also expose them to the climate crisis. Think back to Hurricane Katrina. You have low-income African American communities who have to stay in hostels for months because they were living in areas with low-quality public infrastructure, roads, housing, and so on. Once I started to look at the framework of climate justice, I realized that environmental racism and climate change should not be discussed independent of the other. But race, whether or not people want to talk about it, is central. Not just race, but also gender, socioeconomic status, poverty, social class – all the social determinants of health are central to discussions on climate change and environmental racism. I respect the environmental scientists who talk about greenhouse gas emissions and so on. We need to hear about that. But what is problematic to me is that we're not hearing the other side which I just talked about. We need to have a conversation in Canada about the fact that central to both environmental racism and climate change are the inequities, the longstanding, historically embedded inequities that racialized communities experience. ED: How are Black and Mi'kmaq communities and organizations in Nova Scotia building the climate crisis into their analysis and political work? IW: Indigenous communities, from my perspective, have always had a holistic understanding of the environment. Indigenous communities have an Indigenous epistemology or ecological knowledge that doesn't see a separation between human beings, animals, plants, water, air. So, an Indigenous epistemology understands that if you desecrate the land by placing environmentally hazardous projects in their communities, then you negatively impact the emotional, mental, spiritual and physical health and well-being of individuals. Everything is viewed as interconnected in Indigenous epistemology. Traditional African philosophy also has a holistic understanding of the world. Although it has been challenging to engage Black communities in environmental issues, that is starting to change as I am seeing more Black youth joining and starting initiatives focussed on environmental racism and climate justice. Climate change is going to impact all of us. So I'd like to see more Black communities, not just in Nova Scotia, but across the board, be more engaged in this issue. And I think part of the reason why they haven't been is that the movement is very white. [With both environmental racism and climate change], the scholars are typically white, the people who write books on these issues are white, and for Black people looking at this, they're like, “I don't think I have a place in this.” So that's why I've done the work that I've done. I don’t think mainstream environmentalists’ focus on greenhouse gas emissions is engaging to a lot of people. People don’t understand their place in that issue. It pushes people away to some extent; even those who are highly educated. [Dr. Waldron and I closed our conversation by talking about climate change adaptation in Black communities in Nova Scotia. Dr. Waldron explained that despite all the intersecting vulnerabilities faced by Afro-Nova Scotians, other characteristics of those communities position them well to adapt to changing environmental conditions.] IW: The Black communities I have met over the years in Nova Scotia love their community. There is a great sense of community solidarity, which I admire. That sense of solidarity often comes from a place of marginality. Out of marginality comes great things. In my work, my goal is always to build on community spirit and resilience to develop capacity in communities that have long been on the margins. Thank you to Megan Coulter for her work transcribing this interview. |
Archives
March 2022
Categories
All
|
 RSS Feed