|
Dr. Bathsheba Demuth, Brown University. 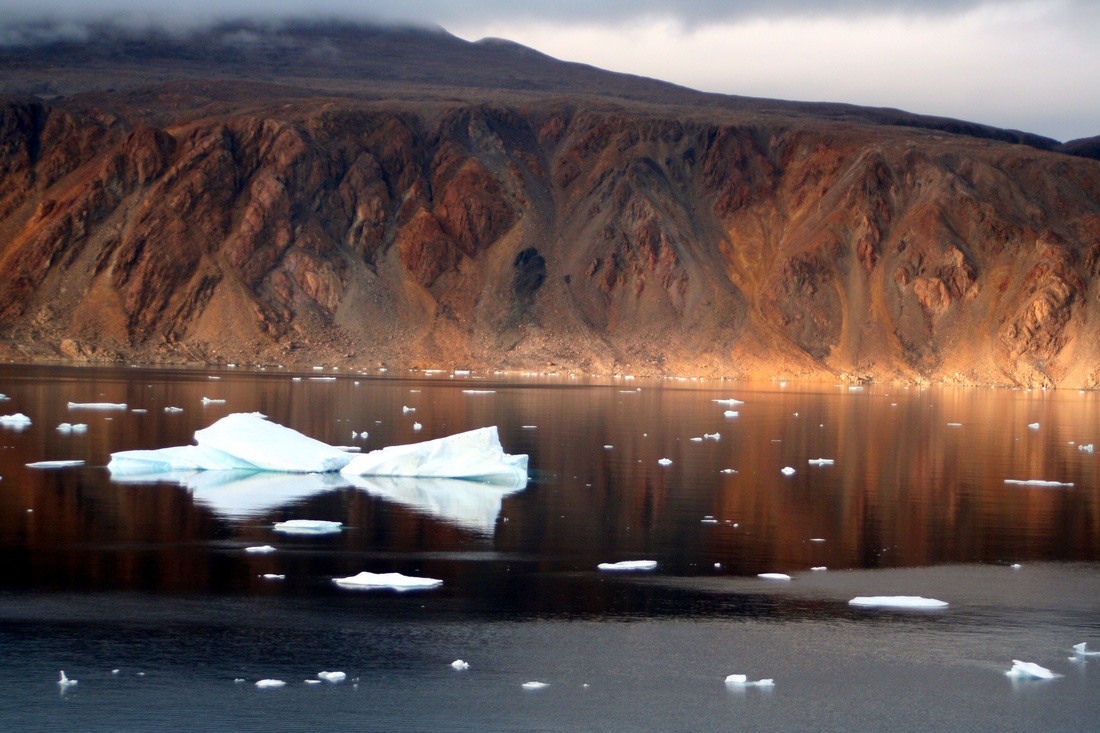 The Greenlandic coast. Source: TheBrockenInaGlory, Wikimedia Commons, 2005, commons.wikimedia.org/wiki/File:Greenland_coast.JPG In the year 1001 CE, Leif Erikson made landfall in Greenland, and traded with people who “in their purchases preferred red cloth; in exchange they had furs to give.” The Vikings called these people Skraelings. Present-day archeologists and historians call them the Thule. At its height, Thule civilization spread from its origins along the Bering Strait across the Canadian Arctic and into to Greenland. The ancestors of today’s Inuit and Inupiat, the Thule accomplished what Erikson and subsequent generations of Europeans never managed: living in the high Arctic without supplies of food, technology, and fuel from more temperate climates. The Thule left archeological evidence of a technologically sophisticated, vigorous people. They invented the umiak, an open walrus-hide boat so large that it was sometimes equipped with a sail. These boats, when used alongside small, nimble kayaks, made the Thule formidable marine-mammal hunters. On land, they harnessed dogs to sleds and built homes half-underground, insulated by earth and beamed with whale bones. People did inhabit the high North American Arctic before the Thule. Their immediate predecessors, called the Dorset by archeologists, were expert carvers, and there are signs of other cultures that date back at least five thousand years. But the Thule appear to have been a particularly robust society, one that inhabited thousands of challenging Arctic miles. Eventually, they even traded with Europeans for metal tools, sending walrus ivory as far abroad as Venice. 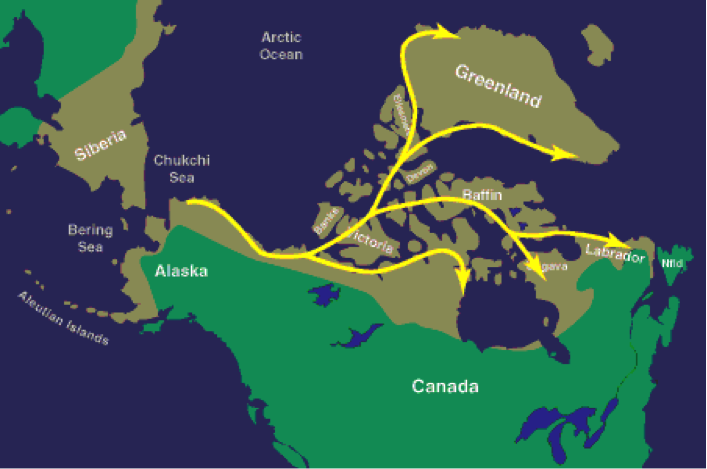 Thule migration routes from the Bering Strait east. Map credit: anthropology.uwaterloo.ca/ArcticArchStuff In the twentieth century, many archeologists linked the success of the Thule to the climate. In this view, rapid Thule expansion coincided with the Medieval Warm Period in the years between 1000 and 1300. The Thule were expert whalers, especially of bowhead whales. This slow species makes for good prey. Their 100-ton bodies can be fifty percent fat by volume, giving people ample calories to eat and burn through long winters. With the slight increase in temperature during the Medieval Warm Period, the theory went, the range of the bowhead whale expanded across newly ice-free waters. Atlantic and Pacific bowhead populations eventually met in the Arctic Ocean north of Canada, offering an uninterrupted banquet of blubber to hunters. The Thule, in this view, were simply whale hunters who followed the migration of their prey in a warming climate. Environmental conditions, not a sophisticated culture, was the key explanation for their success. Emphasizing climate as the cause of migration and social success reduced the achievements of the Thule, essentially, to those of their prey. However, twenty-first century evidence is changing this account of Thule migration. In 2000, Robert McGhee questioned the validity of the radiocarbon dates that helped establish Thule expansion as an eleventh-century phenomenon. He proposed the 1200s as the earliest date of migration. Then, genetic tests by marine biologists showed that Atlantic and Pacific bowhead whales did not mix their populations during the Medieval Warm Period, meaning that there was a substantial gap in whaling possibilities on the Arctic coast. Something more complicated than just following the blubber drove the Thule eastward. McGhee speculated that communities moved for iron, which is short supply in the Arctic. Thule hunters learned from the Dorset people of a deposit left by the Cape York meteorite. They colonized huge territories to secure their access to this precious resource from outer space. Other specialists theorized that population pressure, overhunting, or warfare led the Thule to migrate east. 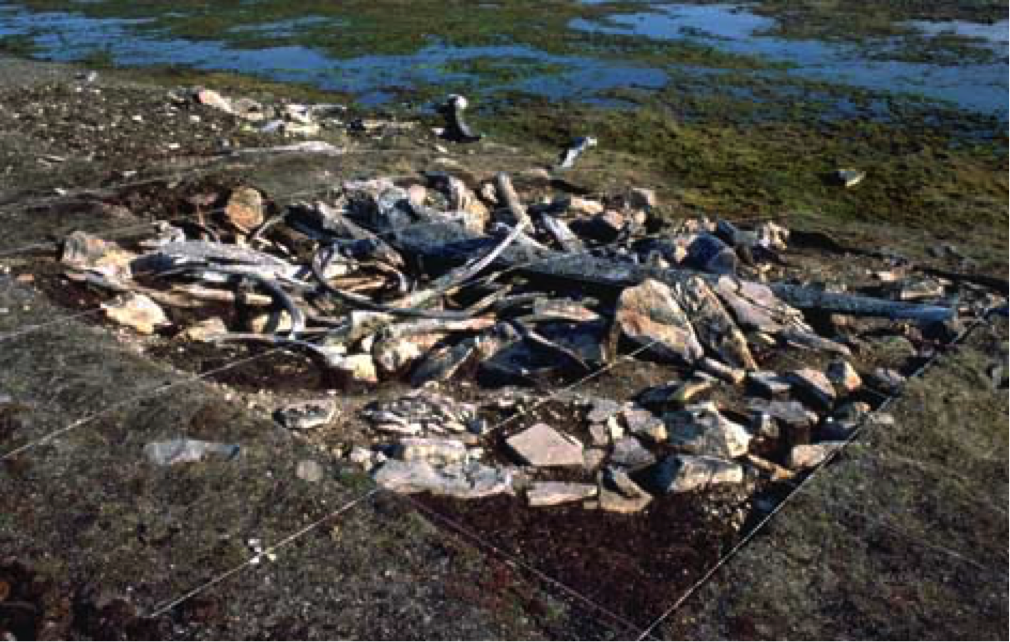 Thule archeological site, with whalebone beams among flooring stones. Photo credit: anthropology.uwaterloo.ca/ArcticArchStuf The ongoing work of Canadian archeologists T. Max Friesen and Charles D. Arnold seems to confirm that we must look beyond simple climatic explanations for the Thule expansion. Working on Beaufort Sea and Amundsen Gulf sites, the pair established that there was no definitive Thule occupation in this part of the western Arctic prior to the thirteenth century. Because any Thule migrants would have had to pass through these points as they moved east, their research indicates that the Thule civilization was only beginning its continental spread around the year 1200, well into the period of warming. The climate may have helped the Thule quickly spread toward Greenland, but the onset of the Medieval Warm Period did not automatically draw people eastward.
Moreover, the work of other archeologists on the Melville Peninsula, along Baffin Bay, indicates that the Mediaeval Warm Period was not always so warm. Some areas of the Arctic saw slight temperature increases, but in general the millennium was cooler than those past. In places, the effects of the so-called Little Ice Age began a century or two before they were evident across the globe, meaning the Thule adapted not to a warmer Arctic, but a colder one. This cooling was more apparent in the west, where the team found fewer Thule sites but also more stability, both in the climate and the record of human occupation. To the east of the Melville Peninsula, where temperatures did warm, the climate was also more variable – adding a new set of complexities to social and economic life. The move into the central Arctic, therefore, reflected forces other than climate. Beginning in the fifteenth century, Thule culture fragmented, specialized, and emerged eventually as distinct contemporary Inuit and Inupiat groups. The Little Ice Age is often the reason given for the disintegration of Thule civilization in the fifteenth century. Yet, the work by Finkelstein, Ross, and Adams indicates that, while the Thule abandoned some sites due to cooling trends, this did not hold in all cases. Other causes, including increased contact with Europeans and their infectious diseases, might have had more to do with the disintegration in some locations. Overall, the new vision of the Thule prominence in the Arctic makes their rise shorter, but even more impressive. And if the Thule began their migration only in 1200, it seems unlikely they spread east simply to find iron. This would have required only smaller-scale movements to precise locations. Instead, the Thule developed a thriving, intricate network of settlements across the Arctic. For Friesen and Arnold, this is evidence that the Thule expanded in order to recreate the ideological and economic lives that they had enjoyed in their origins along the Bering Strait. And in just a century they did, not only by inhabiting land from the Bering Strait to Greenland, but through explorations to the northern edges of the continent. All of this also helps us reinterpret a well-known tale from the Viking exploration of the Arctic. When Leif Erikson’s sister Freydis frightened off a band of Skraelingar in the early eleventh century by striking “her breast with the naked sword” of a fallen Viking, she was likely not fighting the Thule, as scholars have assumed. Perhaps it was the Dorset people that “were frightened, and rushed off in their boats.” The Thule, at least, were likely still a century away from the eastern Canadian coastline. They were not easily daunted either by a shifting climate or by Viking weapons. References Quotes from the Saga of Erik the Red, English translation by J. Sephton, can be found here: http://www.sagadb.org/eiriks_saga_rauda.en Friesen, T. Max and Charles D. Arnold. “The Timing of the Thule Migration: New Dates from the Western Canadian Arctic,” American Antiquity 73 (2008): 527-538. Finkelstein, S.A., J.M Ross, and J.K Adams. “Spatiotemporal Variability in Arctic Climates of the Past Millennium: Implications for the Study of Thule Culture on Melville Peninsula, Nunavut,” Arctic Antarctic, and Apline Research 41 (200): 442-454. McGhee, Robert. “Radio Carbon Dating and the Timing of the Thule Migration,” in Appelit, M. Berglund, J, and Gullov, H.C. eds. Identities and Cultural Contacts in The Arctic: Proceedings from a Conference at the Danish National Museum. Copenhagen (2000): 181-191. Morrison, David. “The Earliest Thule Migration.” Canadian Journal of Archaeology 22( 1999): 139-156. Betts, Matthew, and T. Max Friesen, “Quantifying Hunter-Gatherer Intensification: A Zooarchaeological Case Study form Arctic Canada,” Journal of Anthropological Archaeology 23 (2004): 357-384. Dyke, Arthur S., James Hooper, and James M. Savelle. “A History of Sea Ice in the Canadian Arctic Archipelago based on Postglacial Remains of the Bowhead Whale (Balaena mysticetus)”, Arctic 49 (1996): 235-255. Park, Robert W. “The Dorset-Thule Succession Revisited,” in Appelit, M. Berglund, J, and Gullov, H.C. eds. Identities and Cultural Contacts in the Arctic: Proceedings from a Conference at the Danish National Museum. Copenhagen (2000): 192-205. Dr. Gabriel Henderson, Aarhus University 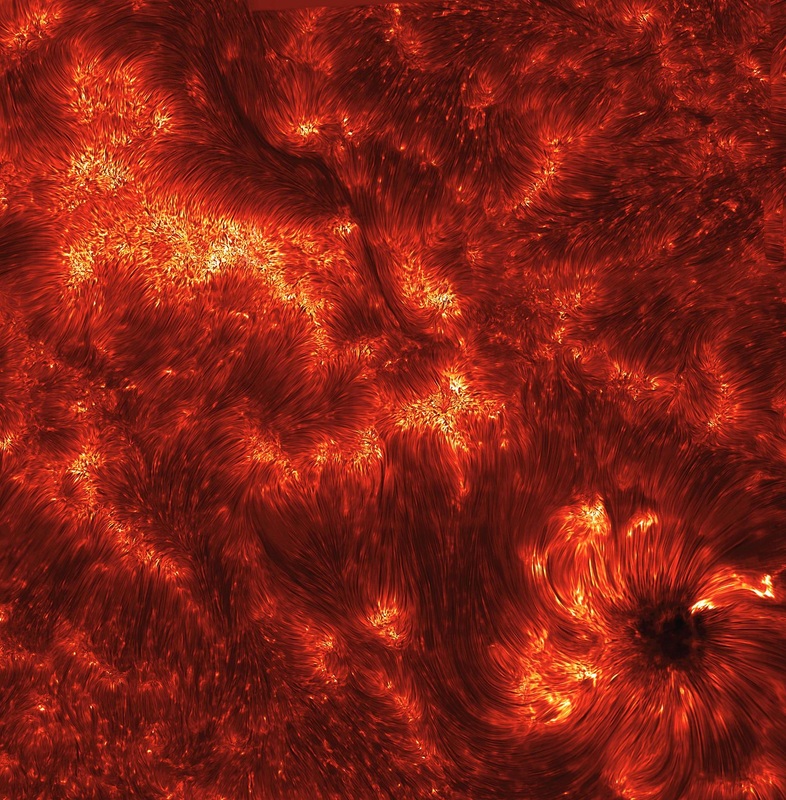 A sunspot on the churning surface of the sun. Source: NASA. Counting in everyday life is a relatively straightforward affair; one, two, three, and on and on. Less simple is the process of reliably counting the number of sunspots on the surface of the sun. Sunspots are darkened areas on the solar surface. In Europe, people knew of their existence at least since the early 17th century, and some of the larger sunspots were probably noted long before Galileo. Elsewhere, sunspot counts were maintained for much longer. Counting these darkened areas is one of the most effective ways to establish a record of the evolution in solar behavior. Not only do sunspot observations provide crucial information about changes in the sun’s magnetic field, they strongly correlate with long-term fluctuations in the amount of energy released by the sun – the so-called solar cycle. Yet, in the 1970s, counting sunspots signified something much more dramatic and nefarious about the history of science itself. In these years, John “Jack” Eddy, an astrophysicist with the National Center for Atmospheric Research, began to scour old, dusty books in library basements to resuscitate a long-forgotten event in the history of solar behavior, behavior that seemed completely at odds with the prevailing orthodox understanding of the sun. Despite what appeared to be the historic and predictable vacillation in the number of sunspots every eleven years, a regularity known to exist since the mid-19th century, Eddy noticed in his records what appeared to be the virtual absence of sunspots between 1645 and 1715. This curious blemish in the solar record was no small discovery. “If it really happened,” Eddy noted in one of his earliest talks on the matter, “we should recognize it as perhaps the most drastic thing that has ever happened to the sun since we began observing it and start including it in our work on the solar cycle." (Eddy, 1974) The implication was obvious: if the sun acted regularly and predictably every eleven years or so, how does one explain the disappearance of sunspots for almost a century? 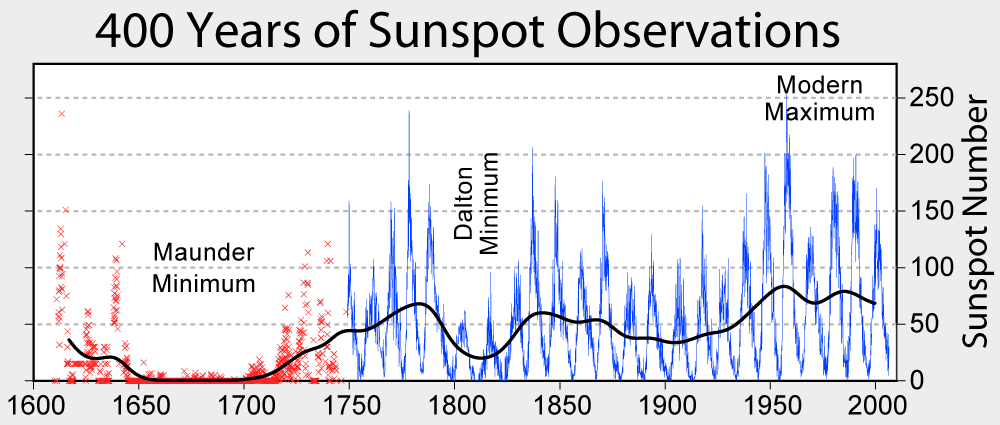 The Maunder Minimum and the Dalton Minimum, another low in sunspot activity named after a nineteenth-century astronomer. Source: Robert A. Rohde, Global Warming Art project. The lack of sunspots was not Eddy’s discovery, at least not in the purest sense. What he called the Maunder Minimum had been observed almost a century earlier by British astronomer Edward Walter Maunder, who began to publish his findings during the 1890s. To Eddy’s consternation, however, Maunder’s discovery appeared to have been forgotten by the astrophysics community. How could this be? Scientific observations and facts don’t just disappear, do they? To Eddy, the answer was yes. A cursory glance at the matter yielded at least one possible reason why: Maunder was not vocal enough about his discovery. But further research yielded a much richer narrative, one that compelled Eddy to examine the deeply held assumptions of his own profession. Eddy’s investigation, as it turned out, showed that Maunder was not forgotten merely because of his inability to properly disseminate his finding about sunspots, but rather because the astrophysical community had – for almost a century – allowed their preexisting assumptions to blind them to new ideas. A conspiracy had taken place, Eddy argued, one based in what appeared to be a universal belief that the sun acted regularly and predictably according to the solar cycle – what he called the principle of solar uniformitarianism. The strength of Maunder’s observations was insufficient to break the universally-accepted canon of solar regularity. Instead of acknowledging and understanding an anomaly in solar behavior, “solar physicists have largely continued to ignore or forget the anomaly, if real,” Eddy insisted in the spring of 1976. “Some have institutionalized the solar cycle and made a profession of extending it into the past and predicting in the future; ignoring, doubting, or intentionally diluting the claims of Maunder of this skeleton in the closet of solar physics." (Eddy, 1976)  John A. Eddy. Source: Barbara Eddy via Wikimedia Commons. This was a dramatic claim, but one that became inextricably interwoven with Eddy’s public admonishment – if not condemnation – of professional orthodoxy within science itself. Eddy wrote about the topic, gave interviews, and addressed scientific and popular audiences – all in the hope that his tempest of activity would lead to Maunder’s long-overdue recognition. But perhaps more poignantly, Eddy portrayed himself as the detective who pulled back the curtain to reveal the biases and prejudices that prevented what he considered to be genuine scientific progress. For him, contemporary astrophysics was a stale and unstable artifice, and only through the work of pioneers like himself – and the forgotten Maunder – could one dispel the fashionable tropes that dictated popular understanding of scientific progress. As he described to an audience within the Boston Museum of Science in May 1978, “In fact, much of what we know, or think we know is not that way at all. And if we have the heart and stomach to look down at it closely, is based upon a shaky and often overextended framework of assumptions – cantilevered scaffolds of bamboo poles and weathered twine.” (Eddy, 1978)
This is an important story in part because it helps to explain why Eddy spoke about sunspots with what historian Kark Hufbauer referred to as “a missionary’s zeal.” (Hufbauer, 1991) But what else does the story show? It certainly does not mean that Eddy’s pioneering work led to a wholesale abandonment of the idea that the sun (for the most part) behaves in a regular, cyclical fashion. That interpretation would be too extreme. However, it would not be too extreme to argue that he used what he considered a crime against Maunder to justify his own predilections as a scientist. Throughout his professional life, he harbored a deep skepticism toward what he saw as scientists’ proclivity for unoriginality and challenged others’ apparent unwillingness to probe the very depths of their own professional, and sometimes erroneous, assumptions. Eddy was comfortable opening the closet. ~Gabriel Henderson Sources: Eddy, John, "The Long Solar Winter," 1974 December 5, Box 2, John Eddy Papers, National Center for Atmospheric Research. Eddy, John, ”Maunder Minimum,” 15 April 1976, Box 3, JEP Eddy, John, ”The Changing Sun,” 28 May 1978, Box 3, JEP Hufbauer, Karl. Exploring the Sun: Solar Science Since Galileo. Baltimore: Johns Hopkins University Press, 1991. It's Maunder Minimum Month at HistoricalClimatology.com. This is our first of two feature articles on the Maunder Minimum. The second, by Gabriel Henderson of Aarhus University, will examine how astronomer John Eddy developed and defended the concept. 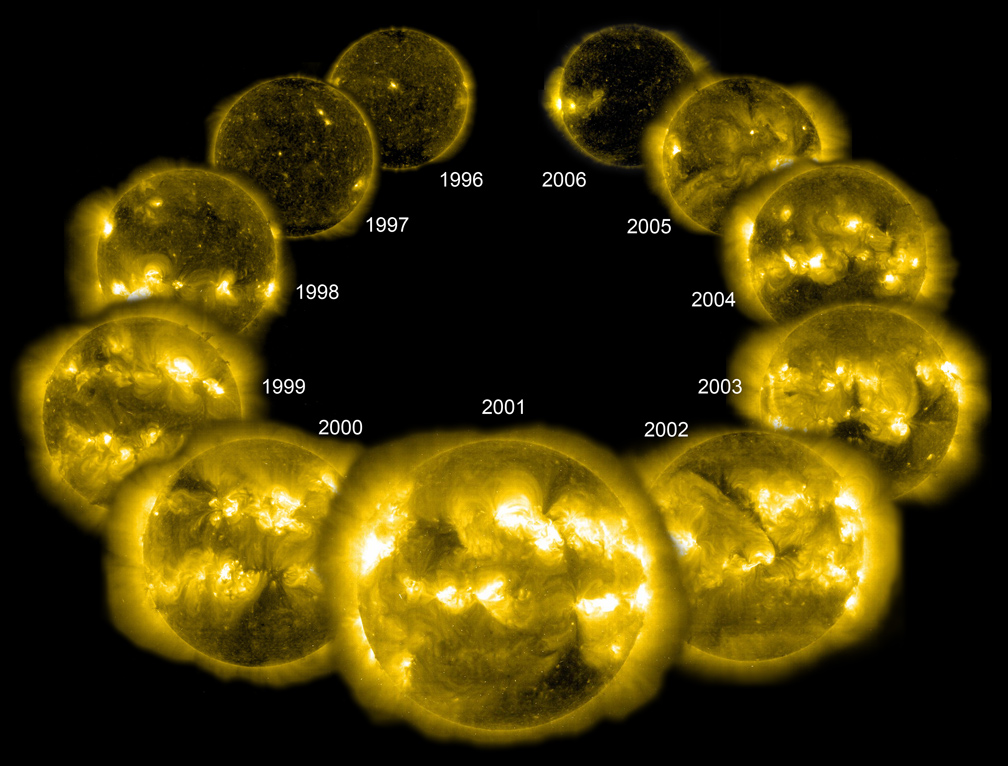 The 11-year solar cycle, imaged by NASA's SOHO spacecraft in extreme ultraviolet light. Source: NASA. Although it may seem like the sun is one of the few constants in Earth’s climate system, it is not. Our star undergoes both an 11-year cycle of waning and waxing activity, and a much longer seesaw in which “grand solar minima” give way to “grand solar maxima.” During the minima, which set in approximately once per century, solar radiation declines, sunspots vanish, and solar flares are rare. During the maxima, by contrast, the sun crackles with energy, and sunspots riddle its surface. The most famous grand solar minimum of all is undoubtedly the Maunder Minimum, which endured from approximately 1645 until 1720. It was named after Edward Maunder, a nineteenth-century astronomer who painstakingly reconstructed European sunspot observations. The Maunder Minimum has become synonymous with the Little Ice Age, a period of climatic cooling that, according to some definitions, endured from around 1300 to 1850, but reached its chilliest point in the seventeenth century. During the Maunder Minimum, temperatures across the Northern Hemisphere declined, relative to twentieth-century averages, by about one degree Celsius. That may not sound like much – especially in a year that is, globally, still more than one degree Celsius hotter than those same averages – but consider: seventeenth-century cooling was sufficient to contribute to a global crisis that destabilized one society after another. As growing seasons shortened, food shortages spread, economies unraveled, and rebellions and revolutions were quick to follow. Cooling was not always the primary cause for contemporary disasters, but it often played an important role in exacerbating them. 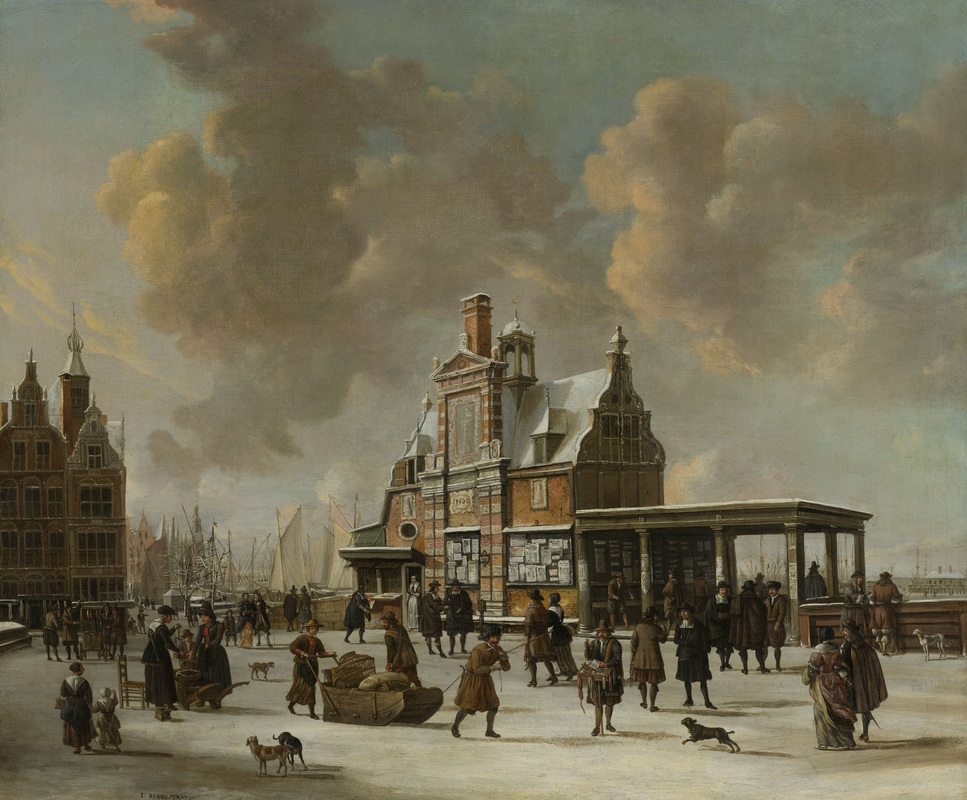 Life on the ice in Amsterdam, during a typically frigid winter in the Maunder Minimum. Source: Jan Abrahamsz. Beerstraten, "Het Paalhuis en de Nieuwe Brug te Amsterdam in de Winter," 1640-1666. Many people – scholars and journalists included – have therefore assumed that any fall in solar activity must lead to chillier temperatures. When solar modelling recently predicted that a grand solar minimum would set in soon, some took it as evidence of an impending reversal of global warming. I even received an email from a heating appliance company that encouraged me to hawk their products on this website, so our readers could prepare for the cooler climate to come! Of course, the warming influence of anthropogenic greenhouse gases will overwhelm any cooling brought about by declining solar activity. In fact, scientists still dispute the extent to which grand solar minima or maxima actually triggered past climate changes. What seems certain is that especially warm and cool periods in the past overlapped with more than just variations in solar activity. Granted, many of the coldest decades of the Little Ice Age coincided with periods of reduced solar activity: the Spörer Minimum, from around 1450 to 1530; the Maunder Minimum, from 1645 to 1720; and the Dalton Minimum, from 1790 to 1820. However, one of the chilliest periods of all – the Grindelwald Fluctuation, from 1560 to 1630 – actually unfolded during a modest rise in solar activity. Volcanic eruptions, it seems, also played an important role in bringing about cooler decades, as did the natural internal variability of the climate system. Both the absence of eruptions and a grand solar maximum likely set the stage for the Medieval Warm Period, which is now more commonly called the Medieval Climate Anomaly. This gets to the heart of what we actually mean when we use a term like “Maunder Minimum” to refer to a period in Earth’s climate history. Are we talking about a period of low solar activity? Or are we referring to an especially cold climatic regime? Or are we talking about chilly temperatures and the changes in atmospheric circulation that cooling set in motion? In other words: what do we really mean when we say that the Maunder Minimum endured from 1645 to 1720? How does our choice of dates affect our understanding of relationships between climate change and human history in this period? To find an answer to these questions, we can start by considering the North Sea region. This area has yielded some of the best documentary sources for climate reconstructions. They allow environmental historians like me to dig into exactly the kinds of weather that grew more common with the onset of the Maunder Minimum. In Dutch documentary evidence, for example, we see a noticeable cooling trend in average seasonal temperatures that begins around 1645. On the surface of things, it seems like declining solar activity and climate change are very strongly correlated. And yet, other weather patterns seem to change later, one or two decades after the onset of regional cooling. Weather variability from year to year, for example, becomes much more pronounced after around 1660, and that erraticism is often associated with the Maunder Minimum. Severe storms were more frequent only by the 1650s or perhaps the 1660s, and again, such storms are also linked to the Maunder Minimum climate. In the autumn, winter, and spring, easterly winds – a consequence, perhaps, of a switch in the setting of the North Atlantic Oscillation – increased at the expense of westerly winds in the 1660s, not twenty years earlier. 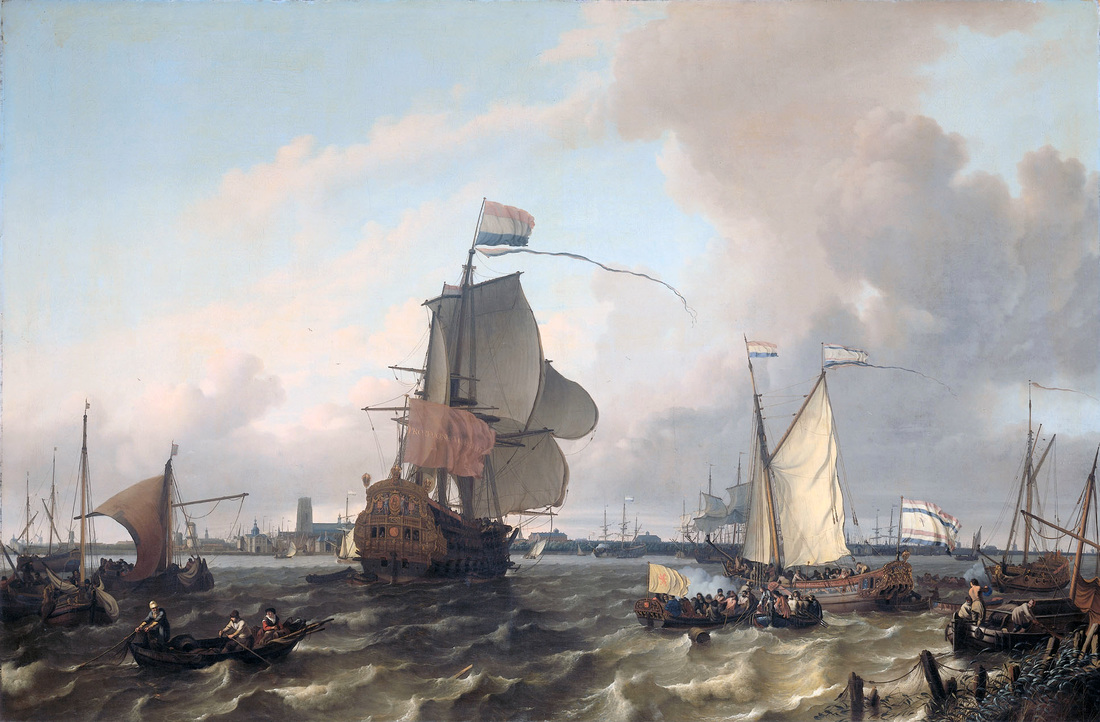 A depiction of William III boarding his flagship prior to the Glorious Revolution of 1688. Persistent easterly, "Protestant" winds brought William's fleet quickly across the Channel, and thereby made possible the Dutch invasion of England. For more, read my forthcoming book, "The Frigid Golden Age." Source: Ludolf Bakhuizen, "Het oorlogsschip 'Brielle' op de Maas voor Rotterdam," 1688. All of these weather conditions mattered profoundly for the inhabitants of England and the Dutch Republic: maritime societies that depended on waterborne transportation. Rising weather variability made it harder for farmers to adapt to changing climates, but often made it more profitable for Dutch merchants to trade grain. More frequent storms sank all manner of vessels but sometimes quickened journeys, too. Easterly winds gave advantages to Dutch fleets sailing into battle from the Dutch coast, but westerly winds benefitted English armadas. If we define the Maunder Minimum as a climatic regime, not (just) a period of reduced sunspots, and if we care about its human consequences, what should we conclude? Did the Maunder Minimum reach the North Sea region in 1645, or 1660? These problems grow deeper when we turn to the rest of the world. Across much of North America, temperature fluctuations in the seventeenth century did not closely mirror those in Europe. There was considerable diversity from one North American region to another. Tree ring data suggests that northern Canada appears to have experienced the cooling of the Maunder Minimum. Western North America also seems to have been relatively chilly in the seventeenth century, although there chillier temperatures probably did not set in during the 1640s. By contrast, cooling was moderate or even non-existent across the northeastern United States. Chesapeake Bay, for instance, was warm for most of the seventeenth century, and only cooled in the eighteenth century. Glaciers advanced in the Canadian Rockies not in the seventeenth century, but rather during the early eighteenth century. Their expansion was likely caused by an increase in regional precipitation, not a decrease in average temperatures. Still, the seventeenth century was overall chillier in North America than the preceding or subsequent centuries, and landmark cold seasons affected both shores of the Atlantic. The consequences of such frigid weather could be devastating. The first settlers to Jamestown, Virginia had the misfortune of arriving during some of the chilliest and driest weather of the Little Ice Age in that region. Crop failures contributed to the dreadful mortality rates endured by the colonists, and to the brief abandonment of their settlement in 1610. 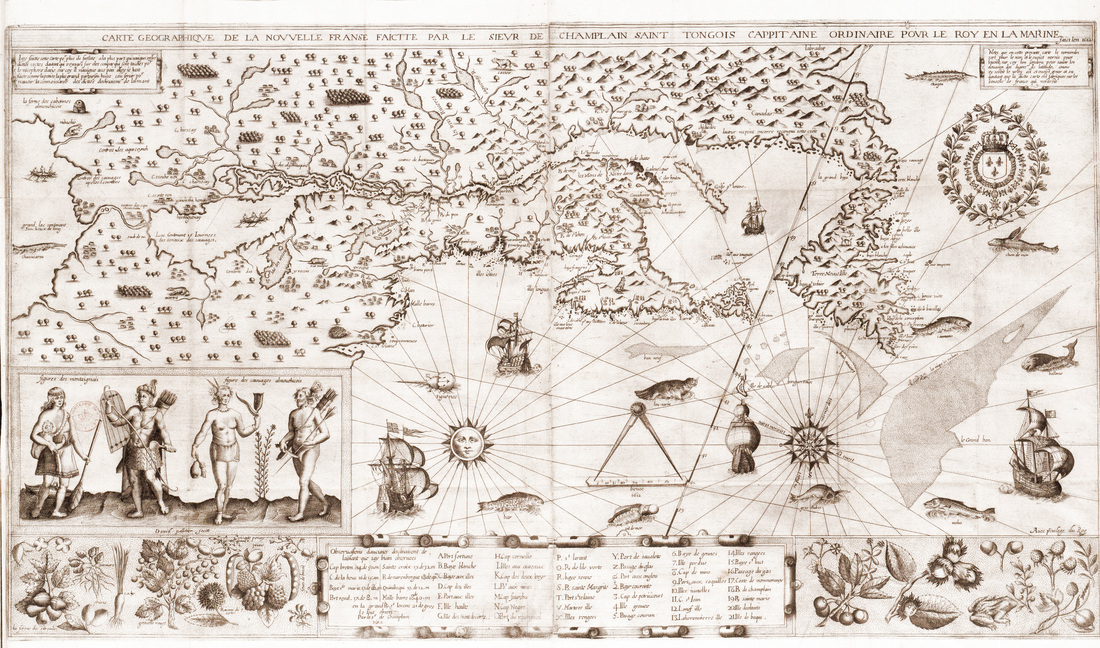 An early seventeenth-century map of New France. Just look at all those trees! Source: Samuel de Champlain, "Map of New France," 1612. Moreover, many parts of North America do seem to have warmed in the wake of the Maunder Minimum, in the eighteenth century. This too could have profound consequences. In the seventeenth century, settlers to New France had been surprised to discover that their new colony was far colder than Europe at similar latitudes. They concluded that its heavy forest cover was to blame, and with good reason: forests do create cooler, cloudier microclimates. Just as the deforestation of New France started transforming, on a huge scale, the landscape of present-day Quebec, the Maunder Minimum ended. Settlers in New France concluded that they had civilized the climate of their colony, and they used this as part of their attempts to justify their dispossession of indigenous communities. Despite eighteenth-century warming in parts of North America, the dates we assign to the Maunder Minimum do look increasingly problematic when we look beyond Europe. If we turn to China, we encounter a similar story. Much of China was actually bitterly cold in the 1630s and early 1640s, before the onset of the Maunder Minimum elsewhere. This, too, had important consequences for Chinese history. Cold weather and precipitation extremes ruined crops on a vast scale, contributing to crushing famines that caused particular distress in overpopulated regions. The ruling Ming Dynasty seemed to have lost the “mandate of heaven,” the divine sanction that, according to Confucian doctrine, kept the weather in check. Deeply corrupt, riven by factional politics, undermined by an obsolete examination system for aspiring bureaucrats, and scornful of martial culture, the regime could adequately address neither widespread starvation, nor the banditry it encouraged. Climatic cooling caused even more severe deprivations in neighboring, militaristic Manchuria. There, the solution was clear: to invade China and plunder its wealth. The first Manchurian raid broke through the Great Wall in 1629, a warm year in other parts of the Northern Hemisphere. Ultimately, the Manchus capitalized on the struggle between Ming and bandit armies by seizing China and founding the Qing (or "Pure") Dynasty in 1644. 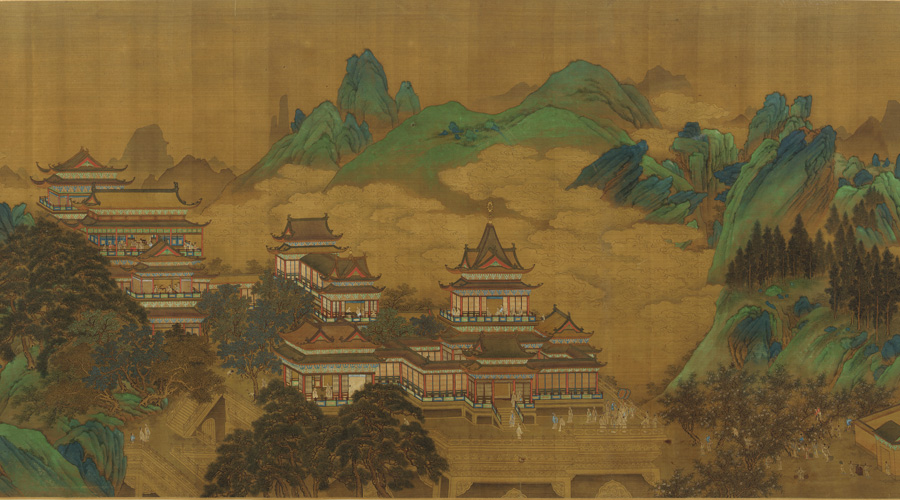 China under the Ming Dynasty was arguably the most powerful empire of its time. Even as it unravelled in the early seventeenth century, its cultural achievements were impressive, as this painting of fog makes clear. Source: Anonymous, "Peach Festival of the Queen Mother of the West," early 17th century. This entire history of cooling and crisis predates the accepted starting date of the Maunder Minimum. Yet, the fall of the Ming Dynasty unfolded in one relatively small part of present-day China. Average temperatures in that region reached their lowest point in the 1640s. By contrast, average temperatures in the Northeast warmed by the middle of the seventeenth century. Average temperatures in the Northwest also warmed slightly during the mid-seventeenth century, and then cooled during the late Maunder Minimum. Smoothed graphs that show fluctuations in average temperature across centuries or millennia give the impression that dating decade-scale warm or cold climatic regimes is an easy matter. Actually, attempts to precisely date the beginning and end of just about any recent climatic regime are sure to set off controversy. This is not only because global climate changes have different manifestations from region to region, but also because climate changes, as we have seen, involve much more than shifts in average annual temperature. Did the Maunder Minimum reach northern Europe, for instance, when average annual temperatures declined, when storminess increased, when annual precipitation rose or fell, or when weather became less predictable? Historians such as Wolfgang Behringer have argued that, when dating climatic regimes, we should also consider the “subjective factor” of human reactions to weather. For historians, it makes little sense to date historical periods according to wholly natural developments that had little impact on human beings. Maybe historians of the Maunder Minimum should consider not when temperatures started declining, but rather when that decline was, for the first time, deep enough to trigger weather that profoundly altered human lives. When we consider climate changes in this way, we may be more inclined to subjectively date climatic regimes using extreme events, such as especially cold years, or particularly catastrophic storms. Dating climate changes with an eye to human consequences does take historians away from the statistical methods and conclusions pioneered by scientists, but it also draws them closer to the subjects of historical research. In my work, I do my best to combine all of these definitions, and incorporate many of these complexities. I date climatic regimes by considering their cause – solar, volcanic, or perhaps human – and by working with statisticians who can tell me when a trend becomes significant. However, I also try to consider the many different kinds of weather associated with a climatic shift, and the consequences that extremes in such weather could have for human beings. As you might expect, this is not always easy. I have long held that the Maunder Minimum, in the North Sea region, began around 1660. Increasingly, I find it easier to begin with the broadly accepted date of 1645, but distinguish between different phases of the Maunder Minimum. An earlier phase marked by cooling might have started in 1645, but a later phase marked by much more than cooling took hold around 1660. These are messy issues that yield messy answers. Yet we must think deeply about these problems. Not only can such thinking affect how we make sense of the deep past, but it can also provide new perspectives on modern climate change. When did our current climate of anthropogenic warming really start? At what point did it start influencing human history, and where? What can that tell us about our future? These questions can yield insights on everything from the contribution of climate change to present-day conflicts, to the timing of our transition to a thoroughly unprecedented global climate, to the urgency of mitigating greenhouse gas emissions. ~Dagomar Degroot Further Reading:
Behringer, Wolfgang. A Cultural History of Climate. Cambridge: Polity Press, 2010. Brooke, John. Climate Change and the Course of Global History: A Rough Journey. Cambridge: Cambridge University Press, 2014. Coates, Colin and Dagomar Degroot, “‘Les bois engendrent les frimas et les gelées:’ comprendre le climat en Nouvelle-France." Revue d'histoire de l'Amérique française 68:3-4 (2015): 197-219. Dagomar Degroot, “‘Never such weather known in these seas:’ Climatic Fluctuations and the Anglo-Dutch Wars of the Seventeenth Century, 1652–1674.” Environment and History 20.2 (May 2014): 239-273. Eddy, John A. “The Maunder Minimum.” Science 192:4245 (1976): 1189-1202. Parker, Geoffrey. Global Crisis: War, Climate Change and Catastrophe in the Seventeenth Century. London: Yale University Press, 2013. White, Sam. “Unpuzzling American Climate: New World Experience and the Foundations of a New Science.” Isis 106:3 (2015): 544-566. Dr. Alan MacEachern, University of Western Ontario. 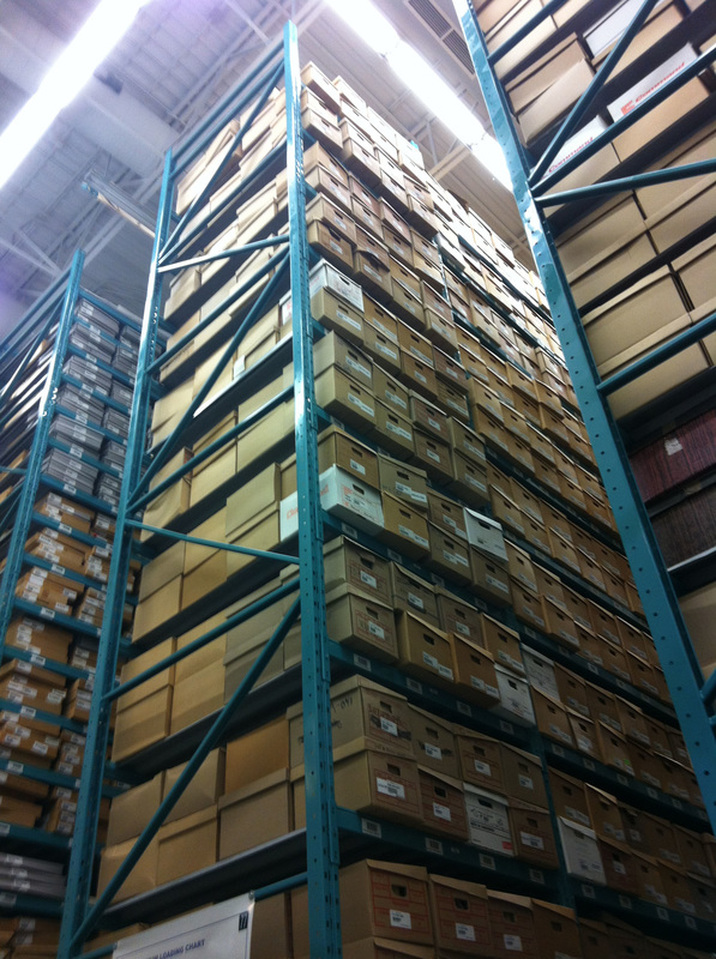 Western's Archives and Research Collections Centre (ARCC) storage room. Photo by Gabrielle Bossy. In 2008, I had a meeting at the Environment Canada headquarters in Downsview, Ontario, and afterward staff gave me a tour. Since I’m a historian, they showed me the old stuff. Down in the basement – not quite the warehouse scene at the end of Raiders of the Lost Ark, but close enough – they led me along row after row of weather observations: all of the original paper forms and registers that since 1840 had been filled out by what would eventually be thousands of observers at thousands of weather stations across Canada. Environment Canada had long ago squeezed the quantitative data they wanted from the observations, and from it created an online National Climate Data and Information Archive. That may have actually put the physical collection more at risk; a teary librarian told of worrying she would return from vacation someday and find it had been thrown out. Staff were maintaining the collection as best they could, but they knew the facility was not up to archival standards – a massive steam pipe loomed menacingly nearby – and they were concerned about the lack of a long-term plan for it. The collection should rightly have gone to Library and Archives Canada (LAC), but in earlier decades the archives had expressed no interest in it and more recently had experienced an acquisitions freeze. So without any real plan, let alone authorization, I offered to take the collection off Environment Canada’s hands. Environment Canada weather stations, 1840-1960. Visualization by Josh MacFadyen, Arizona State University. At the time, I was a dyed-in-the-wool environmental historian increasingly feeling that I had somehow neglected the most pressing environmental issue of our time, climate change. Helping protect a nationally-significant climate history collection seemed like good karma. I went straight from Environment Canada to my university archives. Thankfully, a few years earlier the archives had moved into a new building containing a high density module capable of holding one million volumes. Thankfully, too, University Archivist Robin Keirstead was excited by the idea of having the collection come to Western University, so it could be better preserved, more accessible to researchers, and made available for teaching purposes. Robin and I formally contacted Environment Canada and LAC, expressing Western’s interest in receiving the collection. It took years of negotiation, but what ultimately made the transfer happen was that some folks at Environment Canada thought these old records were priceless and others thought they were worthless, so both concluded it would be great if they were at Western. In 2014, the collection arrived at Western on long-term loan – here is a full listing of it. There are several hundred volumes of correspondence, letterbooks, and journals related to Canadian meteorological and climatological history between 1828 and 1967. But the real jewels of the collection are the almost 900 archival boxes (an estimated 1.6 million pages) containing all of Environment Canada’s extant daily weather observations between 1840 and 1960. From what we could determine, this was the largest archival arrangement ever made between a Canadian university and the federal government. Mission accomplished. …But now what? 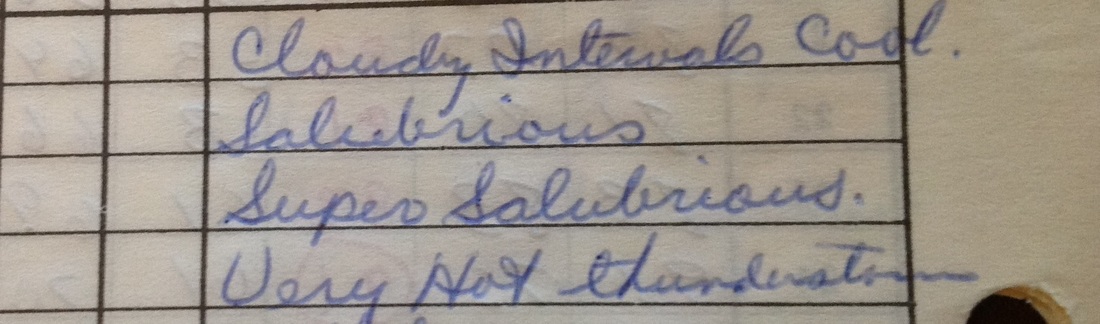 “Super salubrious.” Howard D. Sloat, Jarvis, Ontario, August 1954, EC151, Environment Canada collection. This was already a good news story as far as I was concerned, because the Environment Canada collection will be protected at archival standards indefinitely (presumably, until LAC is in a position to take it). But now that it was at my university, I wanted to see it used. I advertised its availability to researchers across Canada. I developed a climate history course that utilized it. And I considered what contributions neophyte climate history researchers – like my students, like me – could make with it. To begin, we are focusing on the qualitative remarks that observers included alongside their quantitative data. Although Environment Canada long encouraged (or, in some eras, tolerated) observers’ remarks on such matters as extreme weather, farming conditions, and changing seasons, it had never figured out a way to utilize these remarks, including in its climate archive. This qualitative data remained untapped. Students and I are working to change that. In the past year, we have begun creating a database of remarks from the collection. We are transcribing everything the observers thought worth observing (with the important exception that we are ignoring the hundreds of thousands of entries such as “Clear,” “Fair,” or “Rain”). There are many entries on crop conditions and the status of harvests, on smoke from forest fires, on Northern lights, on matters of local political or social interest. There are also many entries that offer insights into the history of the meteorological service itself. 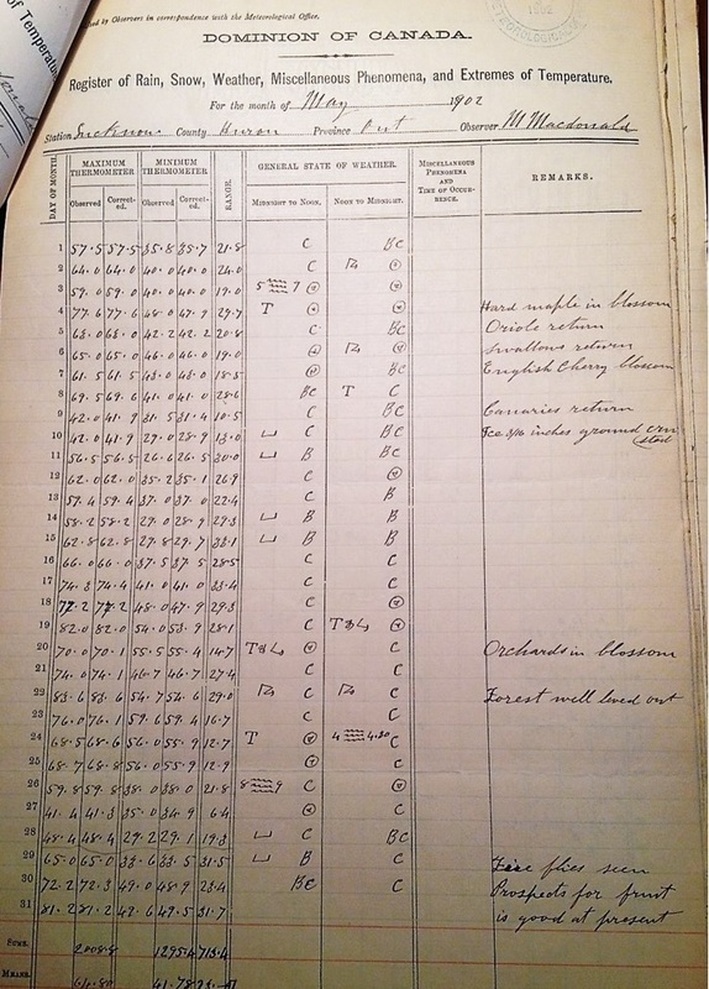 “Hard maple in blossom. Oriole return. Swallows return. English Cherry blossom. Canaries return. Ice 3/16 inches ground. Orchards in blossom. Forest well leaved out. Fire flies seen. Crops all look well except corn it is yellow with the cold and wet.” Malcolm McDonald, Lucknow, Ontario, May 1902, EC172, Environment Canada collection. But of special interest – both to the observers and to us – is phenological information. Phenology is the study of cyclical natural phenomena, and weather observers documented, often over the course of decades, the dates of ice break-up and freeze-up on rivers and lakes, when the first of various bird species appeared, when wildflowers bloomed, when spring peepers emerged. The observers were especially vigilant during what might be called the “phenological moment” of the late 19th and early 20th century, when Canadian individuals and learned societies became intent in gathering such information as a means of gaining biological and meteorological knowledge about their nation. With historians and climate scientists today seeking to verify older meteorological observations and to understand other ways of knowing climate, these observations assume new significance.
The database that Western History students and I are creating already has tens of thousands of tagged entries. In the near future, we will shift to the creation of a website that allows for geographical, temporal, and thematic searching of these observations, at micro- to macro- scales. Interested in Ajax, Ontario or in all of Canada? In your birthday or in a fifty-year timespan? In reports on earthquakes, orioles, or lilacs, or on all extreme weather, all fauna, all flora? We certainly hope to use this for research purposes, but our project’s ultimate goal is to make these observations available to climate researchers, and to the public, so that they make findings of their own. More good karma – climate research requires it. Contact me at amaceach@uwo.ca if you have questions about the Environment Canada collection or research access to it. ~Alan MacEachern Dr. Tim Newfield, Princeton University. 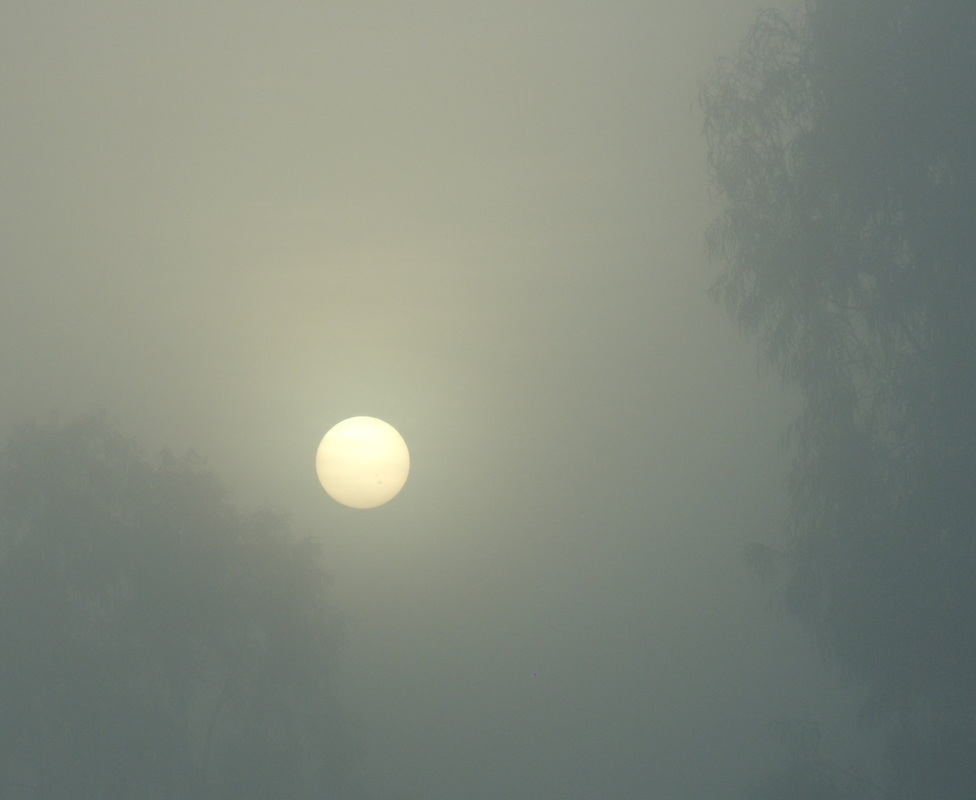 The sun, dimmed by fog. Source: 0xefbeadde.wordpress.com The June 1991 Pinatubo eruption in the Philippines was one of the largest volcanic eruptions of the twentieth century. It is well documented. There are living witnesses, newspaper articles, detailed surveys of the mountain before and after it blew its top, and satellite maps of the ejecta. The eruption was photographed from the ground and the air, and today you can even YouTube it. Pinatubo released up to 20 megatons of sulphur dioxide as many as 35 kilometers into the sky. It turned into fine sulphuric acid aerosol, and, within weeks, enveloped much of the Earth. The aerosols were suspended in the atmosphere for around two years. While there, they "veiled" the sun by absorbing or "backscattering" solar radiation. That heated the stratosphere but cooled Earth's surface. The volcano caused a sudden (but non-uniform) fall in average global temperatures of at least .5 degrees Celsius that was still in effect as late as late 1992. In the Northern Hemisphere, temperatures in summer 1992 fell by about 2 degrees Celsius. 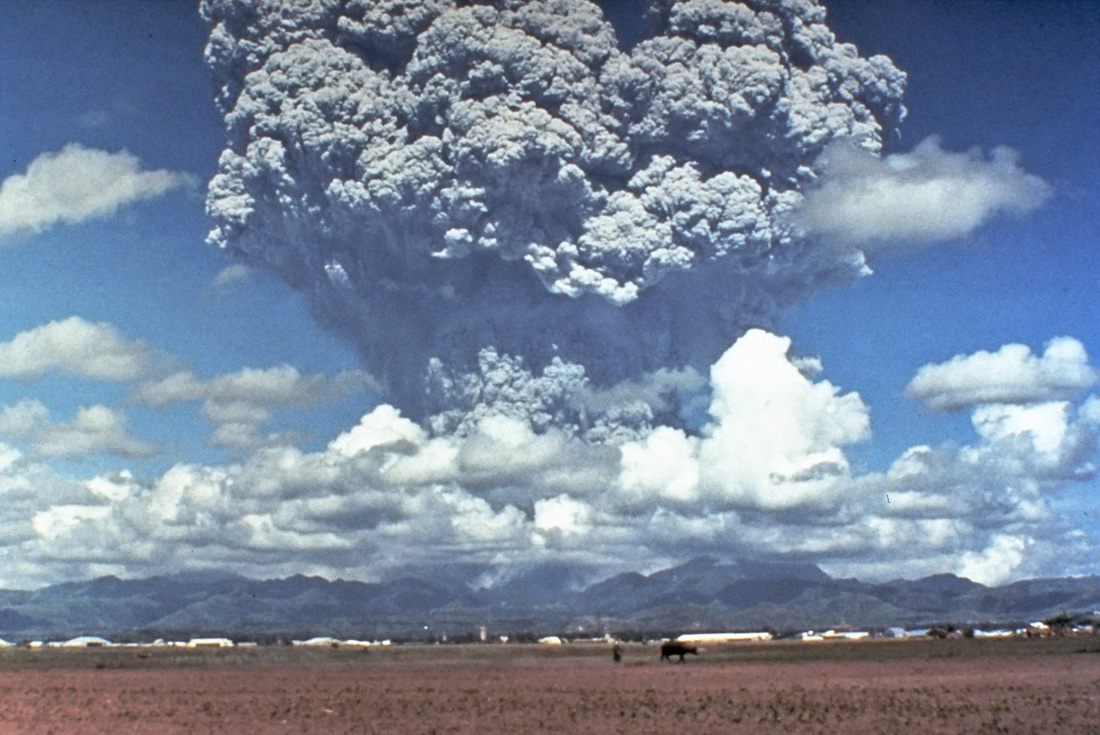 Pinatubo on 12 June 1991, a few days before the big eruption. The mountain shrunk 300 meters in the 15 June explosion. Lonely Planet’s Philippines describes a hike up the mountain as ‘most accessible’, but warns not to attempt it in ‘dodgy weather’. Source: USGS. Earlier and much larger volcanic eruptions in the late Holocene are more obscure. Take Tambora, which erupted in April 1815 and pumped 60 to 110 megatons of sulphur dioxide into the air, leading to one of the most infamous ‘Years Without a Summer’. No volcanologist or climate scientist doubts it dwarfed Pinatubo, but far less is known about the earlier eruption. There are fewer firsthand accounts, and no films or photos (though some argue Joseph Turner and other artists captured its far-reaching atmospheric effects). While the available instrumental data are useful, they are limited and local. Nevertheless, scientists have determined that it was one of the biggest volcanic episodes of the last several thousand years. A recent study estimated that it resulted, in some regions, in 2 to 4 degrees Celsius of cooling from June to August, 1816. There were other large events, deeper in the historical past. Yet these episodes are far more mysterious. Often the culpable volcano (or volcanoes) is not known, and firsthand accounts (if any) are more than vague: they are cryptic. For example, something traumatic appears to have affected the world in around the year 536 CE. The five reports that survive for this "536 event" say nothing of an eruption. They merely describe in vague terms a sort of unusual sun dimming or atmospheric veiling. The Roman statesman Cassiodorus, for example, describes a dim moon, and a sun that lost its "wonted light" and appeared "bluish," as if in "transitory eclipse throughout the whole year." These reports leave room to doubt that the phenomenon they describe was really volcanic in origin. Their mysteriousness, however, has spurred intense interest from scholars and enthusiasts since the phenomenon first appeared in the pages of the Journal of Geophysical Research, in 1983. NASA geoscientists Richard Stothers and Michael Rampino discovered a stratosphere-clouding volcanic episode tucked away in four (but, by 1988, five) late antique texts. They also found it in sulphate in Greenlandic ice, and they discovered pumice-lodged wood they date to 540 ±90 CE (meaning give or take 90 years), on Rabaul, a volcano in Papua New Guinea. Since 1983, much has changed. Rabaul is long gone. Even before it seemed the dust veil witnessed (inconsistently) over the Mediterranean was not a volcanic dust veil, but instead some sort of "damp fog," the mountain was considered an unlikely source. In the 1980s, assessments of Antarctic ice did not turn up major mid sixth-century volcanism, but rather a signal from about 505 CE. That exonerated all Southern Hemispheric volcanoes from causing the 536 event. Rabual’s eruption chronology was re-dated with greater precision at least twice within eleven years, and it was determined that the 540±90 date was, in fact, an uncalibrated mix-up of the ages originally returned for the pumiceous wood. Rabaul actually exploded sometime in the interval of 633-670 CE, or (as of 2015) 667-699 CE. Other volcanoes got their share of attention too. Before Rabaul, the Greenlandic sulphates were associated with the great ‘White River Ash’ eruption of Alaska’s Mount Churchill, which was dated roughly in 1975 to 700 ±100 CE, but in 2014 to 833-850 CE. They were also loosely associated with Iceland’s Eldgjá, which is well-known for erupting in the 930s. After, they were tied to the Chiapanecan El Chichón, Indonesia’s infamous Krakatoa, the now-dormant stratovolcano Haruna, and the El Savadorian Ilopango. The latter received considerable press in 2010, when palaeoecologist Robert Dull asserted its ‘paroxysmal’ Tierra Blanca Joven event, considered the largest Central American eruption of the last 84,000 years, and previously given third- and fifth- century dates, actually caused global cooling in 536 CE. 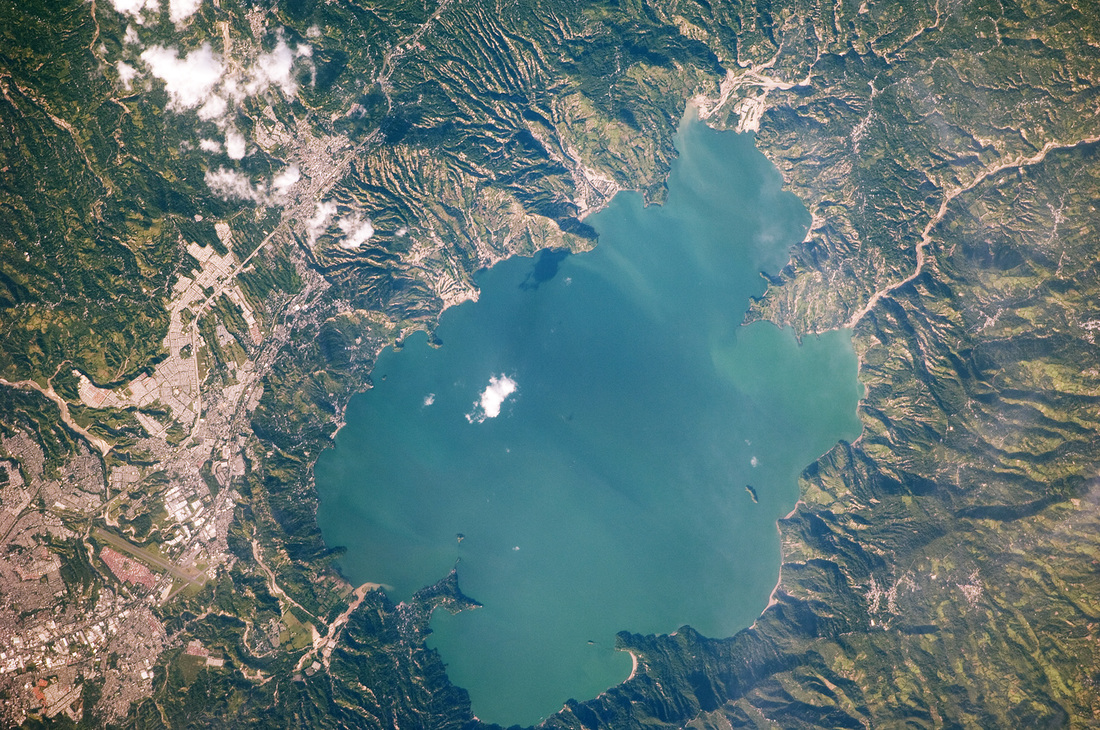 El Salvador’s largest and deepest (crater) lake, Lago de Ilopango. A survey of archaeological excavations suggested a 100-kilometre radius around the site was little- or un-inhabitable for a century after the eruption (whether that happened in 535/536 CE or not). A recent edition of Frommer’s Central America describes a visit to the (always) warm-water caldera as "overrated." Lago de Coatepeque, another volcanic lake 50 kilometres to west, is preferable. Source: NASA Earth Observatory Yet for a while after 1983, scientists could find no eruptions in 536 CE. The original ice dates of 540 ±10 and c. 535 CE that Stothers and Rampino used to explain the abnormal Byzantine veiling were adjusted in 1984, at around the same time that Stother’s second, more influential article on a volcanic 536 event appeared in Science. This does not now seem surprising. The dates that scientists have given for most first-millennium eruptions have shifted back or forward in time at some point or another. Analyses of the remnants of eruptions in eruption-site sediments often produce ages that disagree by a half century or more. Studies of sulphate layers in ice cores also vary: a couple years in some cases, a decade or five in others. For more than a decade after 1983, it seemed that the 536 event had other causes. Explanations were diverse. Some held that the clouding Procopius and his peers had witnessed was tropospheric and regional, not a stratospheric phenomenon of hemispheric or global proportions. Volcanism that was local and remarkable, but globally inconsequential, was the cause of some kind of low-hanging ‘damp fog’. Others held firm: volcano or no volcano, the event was global. Oceanic outgassing, an interstellar cloud, and an asteroid or comet impact event were proposed. The latter, advanced in the early ‘90s, was not immediately popular. Some scholars considered an impactor a "much less likely" explanation for the 536 event than a major volcanic eruption, despite the then-complete lack of evidence for such an eruption. Yet the impact theory eventually gained some credibility. Different types of rocks and impacts were envisioned. A comet might have "air-bursted"’ in the upper atmosphere and ignited one or more vast forest fires, or alternatively a "medium-sized asteroid" struck an ocean and threw marine aerosols into the stratosphere. The impact of a comet less than one kilometer in diameter could have loaded the sky with enough debris to generate multiple successive years of cooling. Even after volcanic eruptions could again be convincingly tied to 536 CE cooling, some scientists argued that an asteroid 640 metres in diameter crashed into Australia, compounding the chilling effect of volcanic eruptions and carving out the Gulf of Carpentaria. The impactor theory failed to convince many for long. Michael Baillie, a tree ring expert (or "Dendrochronologist") who first advocated the theory in a 1994 article, sided with volcanic explanations after glaciologist Lars Larsen and his team found evidence for a major eruption in multiple ice cores at both poles. This big, low-latitude, Tropical event was affixed a date of 533/534 ±2 CE. It seemed to explain why the "sun’s rays," according to John of Ephesus, "were visible for only two or three hours a day" in 536/37 CE. Larsen also drew attention to "an even larger" Northern Hemisphere deposit, which he dated to 529 ±2 CE. This may not have seemed important at the time, since there are no written sources that suggest anything strange about 529 CE. Yet, only months later, Baillie drew on a growing quantity of tree ring data to suggest that both newly discovered eruptions be moved forward by six or seven years. This adjustment offered an explanation for the unusual tree-ring signals he had highlighted in the early 1990s. Tree ring data significantly altered scientific understandings of what happened in the sixth century. Independently of texts and ice, tree rings suggest a major disturbance in 536 CE. Tree ring data, unknown to Stothers and Rampino in the 1980s, give perhaps the best record of the sixth-century event. They give annual information with an objectivity that sixth-century historians cannot match. Together, they have a temporal and spatial "awareness" no written source can rival. Mediterranean texts describe the 536 event as 12 or perhaps 18 months long, but Baillie surveyed trees from Ireland, Germany, Scandinavia and the U.S.A. that clearly show that the event lasted for roughly a decade. Tree rings also demonstrate that the 536 event was not a Byzantine oddity. Rather, it was vast: hemispheric or even global. Trees also reveal not one steady stretch of poor growth but a marked departure from normal growing conditions, with acute troughs and peaks. Some scholars therefore believed that a cluster of stratosphere-clouding phenomena were to blame, not a single cataclysm. The first nadir was in 536-537 CE, while the second, and more pronounced, was in 540-541 CE. More recent tree ring studies have highlighted a third low in 546-547 CE. This one, and another in the early 550s, were already visible in Baillie’s original work, but they were not much discussed. Over the last twenty years, tree ring studies have confirmed that the 536 event was hemispheric, and at a point global, and that it lasted for more than a decade. Multiple tree ring temperature reconstructions have found several of the coldest growing seasons (typically June-August) of the last two (or, in some cases, seven-and-a-half) thousand years fall within the sixth-century downturn. A few examples: a 1993 paper identified 536, 535, and 541 CE as the second, third, and fourth-coldest growing seasons in a 2,000-year-long chronology from Sierra Nevada. A 2001 paper used a Mongolian tree ring series that was nearly as long, and found unusually chilly temperatures from 536 to 545 CE, with low points in 536 and 543 CE. A 2015 study used a composite northern hemisphere chronology stretching back to 500 BCE, and established the successive decades of 536-545 and 546-555 as the coldest and tenth-coldest decades in the series. According to the same series, six of the thirteen coldest years between 500 BCE to 1250 CE happened during the sixth-century climatic downturn. The "Baillie bump," the forward-pushing of Larsen's eruptions (and now most first millennium eruptions detected in ice), placed major volcanism at each of the cooling episodes identified in tree ring data. Michael Sigl and a team of scientists recently included these results within an important synthesis of glacial volcanic eruption chronologies. It is still not clear which volcanoes erupted in 535/536 and 539/540 CE, but a cluster of volcanoes seem to have caused the downturn. Still, there may be room to doubt whether Cassidorus and company took in a hemispheric event in 536 CE. They may well have witnessed a local disturbance. Procopius has Vesuvius bubbling, but not erupting, in 536 CE. Whether this ‘extinguisher or all things green’ erupted around then - or perhaps another nearby mountain - we do not know. Minor, nearby volcanism may have coincided with a much larger, distant eruption. One would have veiled Mediterranean skies, while the other marked the world’s trees. Tree rings from Constantinople’s hinterland may support this theory, since they have failed to reflect a major change in growth from 536 to 550 CE. Of course, it may still be that an impactor near-simultaneously fell to Earth from space. Dallas Abbott and her team have recently found iron oxide, silicate spherules, and other ejecta indicators in the melt-water of a portion of a sixth-century Greenlandic ice core. They interpreted a high concentration of calcium as calcium carbonate, a main component in seashells, and detected tropical aquatic microfossils: a first for Greenlandic ice. It is evidence for an impact at sea, which then sent marine aerosols into the stratosphere. For years, the 536 event or 536-550 CE downturn figured as a particularly cold stretch (in fact the coldest) in a long cool phase that set in more than a century before 536 CE and has many names: The "Vandal Minimum," the "Early Medieval Cold Period," or the "Migration Period Pessimum." Very recently, a multidisciplinary study concluded that that the 536-550 event triggered a longer cold period within this Minimum. They call it the "Late Antique Little Ice Age," and argue that it was possibly even chillier and more unstable than the better-known early modern Little Ice Age. Did this cooling have profound consequences for sixth-century societies? Maybe, yet historians came to the 536 event rather late. In 2005, historian Antti Arjava wrote an interdisciplinary appraisal of the evidence for a sixth-century cooling event. Aside from Arjava, the few historians who have wrestled with the clouding have not attempted a complete or current synthesis of the written and scientific evidence. Arjava's paper has therefore served as the main conduit for historians and archaeologists for the science surrounding the 536 event. However, Arjava wrote his paper in the years when scientists could not match the event with a volcanic eruption. The paper plays up the cloud’s mysteriousness, and diminishes its extent and impact. A reading of John the Lydian’s account, one fuller and closer than that offered by Stothers, led to the conclusion the event was Mediterranean specific, more of a fog than a veil, and damp, not dry. That and the lack of consistent evidence for poor harvests and food shortage in the 530s suggested the cloud had little effect on contemporary societies. Much has changed since 2005. It is more difficult now to diminish the downturn or doubt that it triggered a marked, though temporary, demographic contraction in many regions of the world through its effects on plants. However, minimalist readings remain popular. They are still, if mostly through Arjava, a reaction to a pair of catastrophist books on 536 published in 1999 by Keys (Catastrophe) and Baillie (Catastrophic Encounters with Comets). The books argued for far-reaching and at times unfathomable historical consequences from mystery clouding, from Teotihaucan’s fall to China’s reunification, from Islam’s emergence and Charlemagne’s birth to England’s colonization of North America and Japan’s modern nation state. A reluctance to engage with the palaeoclimate sciences and a willingness to write nature out of history have allowed historians to dismiss the significance of the 536 event for contemporary peoples. Recently, more scientifically-minded historians, such as Michael McCormick, have offered more appropriate (if maximalist-leaning) narratives, in which cooling had moderate implications for sixth-century peoples. A vast, near-unparalleled environmental event need not have cataclysmic consequences to warrant study. Histories of resilience and adaptation to sudden and dramatic climate change should be as important and intriguing as histories of failure and collapse. This is clear in new work on the effects of the downturn, from the Yucatán to Fennoscandia, which emphasizes coping strategies and a certain hardiness in those that lived beneath the veils. 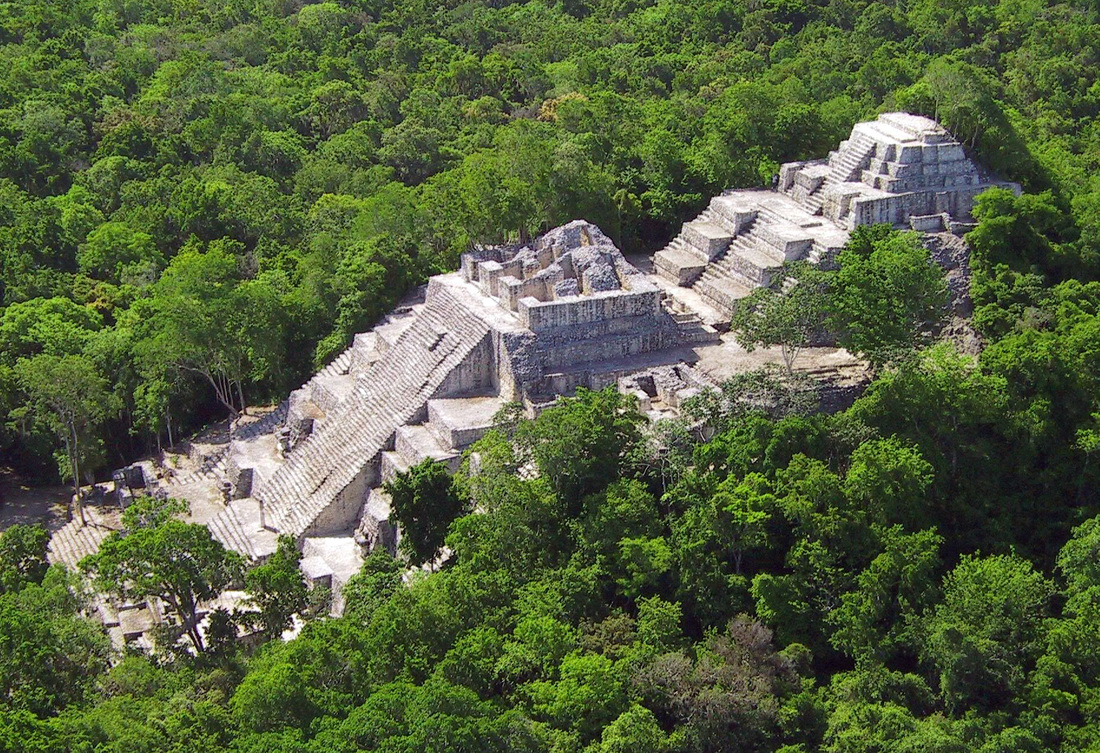 Mayan Calakmul’s largest structure, Structure II. With roughly 6,200 constructions spread out over about 30 square kilometres in the late Classic period, the city of Calakmul (now in Mexico’s Campeche State) experienced rapid growth during the sixth-century "hiatus." This interval of debated tumultuousness between the early and late Classic phases saw a leveling off (or decline) in stelae and monumental building at several Mayan locales as well as (perhaps dramatic) population contraction. Richardson Gill (in his The Great Mayan Droughts) argued the downturn caused this break in activity and drawing on palaeoclimatology (from other world regions) assigned the hiatus a firm start date of 536 CE. Built atop a preclassical stucco-decorated plaza, Structure II was an important building throughout the Classic period. Fodor’s Cancún, Cozumel, Yucatán Peninsula recommends a stop at the ‘vast’ and ‘lovely’ but little-visited Calakmul, which in its "heyday" (between 542 and 695 CE) numbered at least 50,000 people. A climb up the pictured pyramid allows for a "soaring vista." Although not everyone would have come out from under the dust worse off, it is important to not let the pendulum swing back too far. After all, there are indications from across Eurasia of subsistence crises. Read together, these reports suggest a rather uneven occurrence of downturn-triggered crop failure and genuine famine. That clouding density and duration undoubtedly varied, and people were not everywhere equally vulnerable, might account for this patchiness. So too the concurrence of other natural and cultural pressures in some areas. It should be emphasized that large eruptions do not simply chill the world. The effects on weather and climate are non-uniform. They are regional and can differ markedly, as Pinatubo and Tambora have shown. Tropical eruptions, such as the 539/540 event, also exercise a different force on climate than high latitude Northern Hemispheric ones, like 535/536. For instance, major near-equatorial volcanism is known to cause winter warming in North America, Europe, and Russia, but winter cooling in Western and Eastern Asia. Extratropical Northern Hemispheric volcanism cools hot and cold seasons alike. Seasonality matters too. That high latitude eruptions seem to be more impactful if they occur in summer could indicate that the 535/536 eruption happened in that season. A few contemporary reports of despair and devastation seem hyperbolic. Did Italian mothers really eat their daughters? Did three quarters of the population north of the Yellow river really die off? Yet neither they, nor less-sensational descriptions, should be written off as lacking any grounding in the immediate post-eruption reality. Most sixth-century societies were able to absorb one bad year, but very few were able to absorb two or three. Back-to-back(-to-back) years of poor growing conditions, caused by a sharp cooling of average temperatures, were certain to take a toll. An eruption cluster - multiple Tambora-like events within a few years of each other - caused the mid sixth-century downturn. Whether an impactor was roughly coincident is uncertain. The variability of the effects of both eruptions on climate and the extent and regionality of the loss of life are uncertain as well. Sixth-century cooling may well have helped cause the outbreak of the "Plague of Justinian" - the so-called "First Bubonic Plague Pandemic" - with profound demographic consequences. This link, and other enduring mysteries of the sixth-century downturn, will be the subject of a future article on this site. ~Tim Newfield Dr. Newfield will write a synthesis of the scholarship on sixth-century cooling, like this but more complete, in the The Palgrave Handbook of Climate History, edited by Franz Mauelshagen, Christian Pfister and Sam White.
Select Reading D. Abbott et al, ‘What Caused Terrestrial Dust Loading and Climate Downturns between A.D. 533 and 540?’ Geological Society of America Special Papers 505 (2014). A. Arjava, ‘The Mystery Cloud of 536 CE in the Mediterranean Sources’ Dumbarton Oaks Papers 59 (2005). M. Baillie, ‘Dendrochronolgy Raises Questions About the Nature of the AD 536 Dust Veil Event’ The Holocene 4 (1994). M. Baillie, ‘Proposed Re-Dating of the European Ice Core Chronology by Seven Years Prior to the 7th Century AD” Geophysical Research Letters 35 (2008). U. Büntgen et al, ‘2500 Years of European Climate Variability and Human Susceptibility’ Science 331 (2011). U. Büntgen et al, ‘Cooling and Societal Change during the Late Antique Little Ice Age from 536 to around 660AD’ Nature Geoscience 9 (2016). B. Dahlin and A. Chase, ‘A Tale of Three Cities: Effects of the AD 536 Event in the Lowland Maya Heartland’ in G. Iannone ed., The Great Maya Droughts in Cultural Context: Case Studies in Resilience and Vulnerability (University of Colorado Press, 2014). R. Dull et al., ‘Did the Ilopango TBJ Eruption Cause the 536 Event?’ American Geophysical Union Fall Meeting 2010 Abstract V13C-2370. C. Hammer et al, ‘Greenland Ice Sheet Evidence of Post-Glacial Volcanism and its Climatic Impact’ Nature 288 (1980). C. McKee et al, ‘A Revised Age of AD 667-699 for the Latest Major Eruption at Rabaul’ Bulletin of Volcanology 77 (2015). L. Larsen et al, ‘New Ice Core Evidence for a Volcanic Cause of the A.D. 536 Dust Veil Event’ Geophysical Research Letters 35 (2008). J. Luterbacher and C. Pfister, ‘The Year Without a Summer’ Nature Geoscience 8 (2015). M. McCormick et al, ‘Climate Change During and After the Roman Empire: Reconstructing the Past from Scientific and Historical Evidence’ Journal of Interdisciplinary History 43 (2012). E. Rigby et al, ‘A Comet Impact in AD 536?’ Astronomy and Geophysics 45 (2004). A. Robock, 'Perspectives, Pinatubo Eruption: The Climatic Aftermath' Science 295 (2002). A. Robock, ‘Volcanic Eruptions and Climate’ Reviews of Geophysics 38 (2000). M. Sigl et al, ‘Timing and Climate Forcing of Volcanic Eruptions for the Past 2,500 Years’ Nature 523 (2015). R.B. Stothers and M.R. Rampino, ‘Volcanic Eruptions in the Mediterranean before A.D. 630 from Written and Archaeological Sources’ Journal of Geophysical Research 88 (1983). R.B. Stothers, ‘Mystery Cloud of AD 536’ Nature 307 (1984). Dr. Ruth Morgan, National Centre for Australian Studies, Monash University 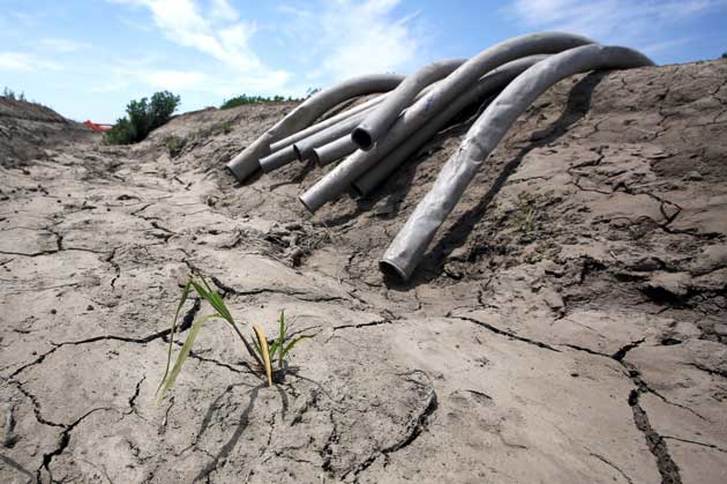 Empty irrigation pipes along a dried irrigation canal near Stockton, California. Source: ProPublica, 25 June 2015. At the 2016 American Society of Environmental History conference in Seattle, I joined Linda Nash (University of Washington), Char Miller (Pomona College), and Libby Robin (The Australian National University) to contextualize Western drought in environmental, historical and cultural terms. ‘Western drought’ in this instance referred to the region that the US Drought Monitor classifies as ‘West’, where some areas are still experiencing ‘exceptional’ drought conditions. Our discussion drew this Western experience into transnational conversation with histories of drought in Australia, further west across the Pacific. By providing a humanistic perspective of drought, the lens of environmental history complements the scientific study of climate conditions and offers valuable insights into how droughts have been understood and experienced over time. 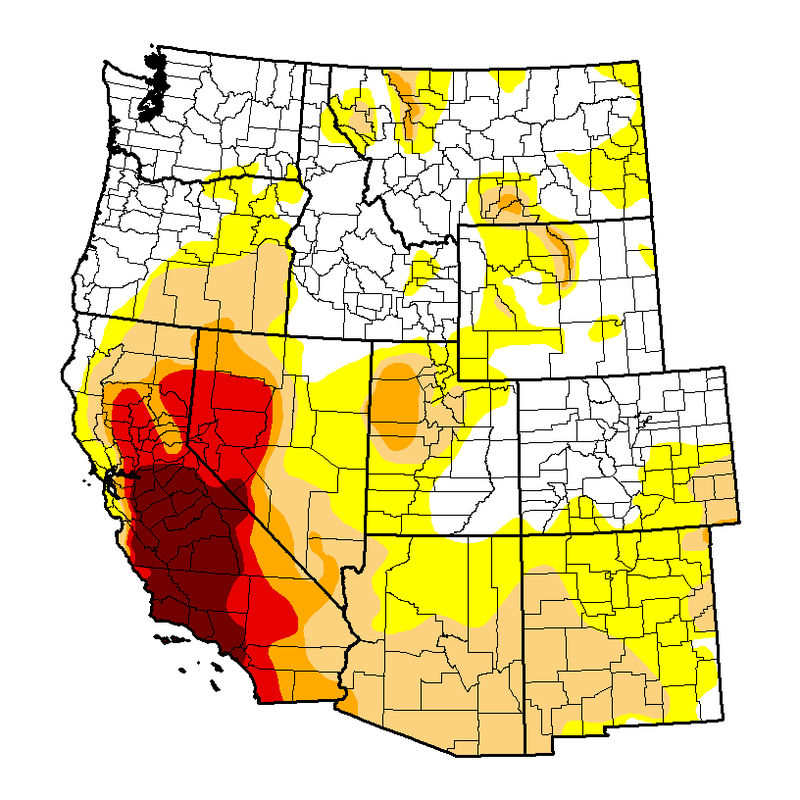 The US Drought Monitor produces a weekly map of drought conditions based on measurements of climatic, hydrologic and soil conditions as well as reported impacts and observations drawn from around the United States. The US Drought Monitor is a joint initiative of the National Oceanic and Atmospheric Administration, the US Department of Agriculture, and the National Drought Mitigation Center at the University of Nebraska-Lincoln. Regional conditions as of April 12, 2016. In late 2015, meteorologists watching the Pacific Ocean saw the signs of what the media described as the ‘Godzilla El Niño’. Ocean waters in the equatorial Pacific were unusually warm, one of the tell-tale signs that a very strong El Niño was brewing – stronger even than the catastrophic event of 1997-98. For the drought-stricken west coast of the United States, this forecast promised storms and heavy rains in California, while Australians feared the onset of worsening drought conditions over the inland areas of Queensland and northern New South Wales. Although this El Niño has yet to live up to the hype, with the Washington Post recently declaring it ‘dead’, its onset highlighted the climate connections between Australia and the American West and their shared experience of extreme weather events.  In August 2015, the Los Angeles Times compared the prevailing strength of the ‘Godzilla El Nino’ to the same time of year in 1997. The red and white patches depict the highest sea-surface heights above average, which indicate how warm sea-surface temperatures are above the average. Graphic: Bill Patzert, Climatologist, NASA Jet Propulsion Laboratory. Prolonged dry spells lay the ecological and hydrological foundations for fires and floods. In the aftermath of the catastrophic Black Saturday bushfires of 2009, which claimed the lives of 173 Victorians, environmental historian Tom Griffiths explained, ‘These are wet mountain forests that burn on rare days at the end of long droughts, after prolonged heatwaves, and when the flume is in full gear. And when they do burn, they do so with atomic power’. Last year, wildfires burned across a bone dry American West and authorities fear what the 2016 fire season might have in store. Alternatively, in the boom and bust climate of the Murray-Darling Basin, historian Emily O’Gorman has shown how a downpour can turn into a flood if it is ‘not “cushioned” by already full rivers’, while historian Jared Orsi explores flood control in the ‘hazardous metropolis’ of Los Angeles. Despite significant differences in population, economy and geography, both political and lay responses to drought over the past two decades reveal settler cultures that are at odds with the highly variable climates in which they live. In both Australia and the United States, drought has been a constant since English settlement: archaeologist Dennis Blanton has argued that Jamestown was founded at the height of an unprecedented dry spell, while environmental historian Richard Grove has shown that the arrival of the First Fleet in New South Wales in 1788 coincided with one of the strongest El Niño events in recorded history. Reconstructions of the pre-instrumental climate in southeastern Australia and California suggest the extent to which climate variability was a feature of colonial life.  Derived from qualitative sources, this table shows drought conditions in southeastern Australia between 1838 and 1860. Column R shows the number of regions affected by drought as a fraction of regions colonized by Europeans. Column M shows the number of months in a year that drought was reported. Source: Claire Fenby and Joëlle Gergis, 2012. Although some part of Australia and the United States is almost always in drought, the visitation of such dry conditions continues to be framed as abnormal, rather than the expression of a variable climate. This water culture, as I and others have argued, is the product of the rise of large-scale public water infrastructure. By separating the means of water production and consumption, this mode of water management helped render invisible the processes of water delivery, thus allowing the illusion of endless water supplies to develop. Our responses to drought continue to favor restoring the illusion of endless water supplies, instead of addressing the cultures that perpetuate this unsustainable vision. Droughts, like all disasters, invite historians to peel away this veneer, laying bare deep-seated tensions relating to land, race, class, and politics that water scarcity only serves to heighten. Like the Millennium Drought (1996-2010) in eastern Australia, the intensity of the recent drought in California (2011-) has been attributed to anthropogenic climate change. The IPCC warns that climate change will increase the likelihood and severity of such events in the future. In the southwest of Australia, meanwhile, climate change is also contributing to the regional drying trend that has been challenging local land and water managers since the 1960s. This drying trend is the result of the westerly winds, which are responsible for winter rains across southern Australia, inching south across the Southern Ocean and leading to greater snowfall in eastern Antarctica.  Australian rainfall projections under low, medium and high emission scenarios for different seasons, modelled by CSIRO and the Commonwealth Bureau of Meteorology based on IPCC scenarios. Source: The Guardian, 18 February 2014. In light of these changing climates, an audience member asked us, what then are the role and value of climate and environmental histories? I argue that in these uncertain times, climate and environmental histories are more important than ever. Our research reveals the histories of past weather and climate events, how they were experienced, and how the experience and interpretation of such events has changed over time. We can also map the connections between climate events; historical patterns of vulnerability; and technological and cultural path dependencies. Environmental historians William Cronon and Tom Griffiths have long counselled their colleagues to tell stories about the past, for narratives have the power to inform and most importantly, engage. Engagement is crucial for historians, not just through our stories but also through our research. Close collaborations with researchers and policymakers can reveal the historical thinking inherent to environmental management, while informing analyses of the present and plans for the future. ~Ruth Morgan BibliographyAustralian Context
Deb Anderson, Endurance: Australian Stories of Drought, CSIRO, 2014. Michael Cathcart, The Water Dreamers: The Remarkable History of Our Dry Continent, Text Publishing, 2010. Tim Flannery, The Weather Makers: the History and Future Impact of Climate Change, Text Publishing, 2008. Bill Gammage, The Biggest Estate on Earth: How Aborigines Made Australia, Allen & Unwin, 2011. Don Garden, Droughts, Floods and Cyclones: El Niños that Shaped Our Colonial Past, Australian Scholarly Publishing, 2009. Joëlle Gergis, Don Garden and Claire Fenby, ‘The Influence of Climate on the First European Settlement of Australia: a Comparison of Weather Journals, Documentary Data and Palaeoclimate Records, 1788-1793’, Environmental History, 15 (3), 2010: 1-23. Tom Griffiths, ‘We Have Still Not Lived Long Enough’, Inside Story, 16 February 2009. Robert Kenny, Gardens of Fire: an Investigative Memoir, UWA Publishing, 2013. Ruth A. Morgan, Running Out? Water in Western Australia, UWAP, 2015. Emily O’Gorman, Flood Country: an Environmental History of the Murray-Darling Basin, CSIRO Publishing, 2012. Stephen J. Pyne, Burning Bush: a Fire History of Australia, University of Washington Press, 1998. Comparative and Global Studies Mike Davis, Late Victorian Holocausts: El Niño Famines and the Making of the Third World, Verso, 2001. Henry F. Diaz and Vera Markgraf (eds), El Niño and Paleoclimatic Aspects of the Southern Oscillation, Cambridge, 1992. Michael H. Glantz, Currents of Change: Impacts of El Niño and La Niña on Climate and Society, 2nd ed., Cambridge, 2000. Richard H. Grove, ‘The Great El Niño of 1789-93 and its Global Consequences: Reconstructing an Extreme Climate Event in World Environmental History’, Medieval History Journal, vol. 10, 2007, pp. 75-98. Richard H. Grove and John Chappell (eds), El Niño – History and Crisis: Studies from the Asia-Pacific Region, White Horse Press, 2000. Ian Tyrrell, True Gardens of the Gods: Californian-Australian Environmental Reform, 1860-1930, University of California Press, 1999. US Context Dennis Blanton, ‘Drought as a Factor in the Jamestown Colony, 1607-1612’, Historical Archaeology, 34 (4), 2000: 74-81. Mike Davis, Ecology of Fear: Los Angeles and the Imagination of Disaster, Metropolitan Books, 1998. William DeBuys, The Great Aridness: Climate Change and the Future of the American Southwest, Oxford, 2011. Norris Hundley Jr, The Great Thirst: Californians and Water, revised ed., University of California Press, 2001. B. Lynn Ingram and Frances Malamud-Roam, The West Without Water: What Past Floods, Droughts and Other Climatic Clues Tell Us About Tomorrow, University of California Press, 2013. Jared Orsi, Hazardous Metropolis: Flooding and Urban Ecology in Los Angeles, University of California Press, 2004. Stephen J. Pyne, California: a Fire Survey, University of Arizona Press, 2016. Marc Reisner, Cadillac Desert: the American West and its Disappearing Water, Penguin, 1993. Marsha Weisiger, Dreaming of Sheep in Navajo Country, University of Washington Press, 2011. Donald Worster, Dust Bowl: The Southern Plains in the 1930s, Oxford, 1979. Donald Worster, Rivers of Empire: Water, Aridity and the Growth of the American West, Oxford, 1992. Almost exactly six years ago, I created HistoricalClimatology.com and co-founded the Climate History Network with professor Sam White, an environmental historian then at Oberlin College. At the time, I was a PhD student at York University in Toronto, Canada. I had recently completed the comprehensive exams that, in North America, qualify PhD students to begin writing their dissertations, and I was fresh from a visit to a Dutch archive. I thought that I could build a platform - this website - that would let me share what I learned as I researched and wrote my dissertation. At the same time, I hoped to build a network that would help me find like-minded scholars, and at the same time provide a new way for my field to grow. After just a few months, I realized that I was onto something, but not quite in the way that I had expected. Sam and I quickly saw that, if the Climate History Network was going to get off the ground, we had to work harder than we had anticipated. We had built a rough framework that allowed scholars of past climates to create fresh online content for themselves. Yet, that is not what most of our users wanted. They needed us to construct a resource that provided information and tools to sustain a new kind of scholarship, while connecting them to like-minded researchers around the world. We understood that it would take a while to build something like that, and we couldn't do it all ourselves. I had a very different challenge with HistoricalClimatology.com. By the end of 2010, it was on course to receive 10,000 hits for the year: far more than I expected for a website with a long domain name, a dated design, and, as yet, very little content. Clearly, there was a thirst, within academia and the broader public, for insights into climate change that drew both from the humanities and the sciences. I had a choice. I could keep the site about me, and thereby increase my name recognition in my field, and among laypeople interested in climate change. Alternatively, I could transform the site into something much bigger than myself: a major resource that could link scholarship on past climates to discussions about our warmer future. That second approach carried big risks. It would require a lot of work to build something credible, and I wasn't sure if I had the necessary time, skills, or prestige. It would also disassociate my name with something I had built, just as it was becoming popular. If you've ever met a PhD student, you'll know that most think obsessively about the advantages they might gain on the academic job market. By changing HistoricalClimatology.com, I worried that I was shooting myself in the foot.  The front page of this website in 2012. After a few weeks of indecision, I changed the site in early 2011. I was going to build a major resource that wouldn't be about me, although I accepted that I would need to do the work that would get it off the ground. By 2012, this site covered the big stories in historical climatology and climate history, with short monthly or bimonthly articles. It also offered links and graphs for laypeople interested in past climates, and a bibliography that was the first of its kind, anywhere on the Internet. In March, the site was referenced in a BBC News article that covered the emergence of historical climatology as a multidisciplinary research field. At around the same time, I started writing articles for other websites that referenced HistoricalClimatology.com. I also added links to Wikipedia pages about, for example, the Little Ice Age or the Medieval Warm Periods. Meanwhile, my articles on this site grew longer and more scholarly. By 2013, HistoricalClimatology.com received more than 50,000 hits annually. That year, I attended a scientific conference in India, and was surprised to discover that some of the scientists there knew me from the website that I had built. In India, I met a young graduate student - Benoit Lecavalier - who shared my interest in tracing climate changes through deep time. Benoit was a Master's student in physics. He worked in time periods, and on scales, that are often inaccessible to historians. I asked him to contribute to HistoricalClimatology.com, and he agreed. Soon after, I started searching for a social media editor who could expand the reach of both this website and of the Climate History Network. Before long, PhD student Eleonora Rohland, then researching the environmental history of hurricanes, accepted the position. When Eleonora was ready to pass the position to someone new, I posted a call for applications that received responses from several excellent candidates. I selected Bathsheba Demuth, then a PhD student who not only explored the environmental history of the Arctic, but had spent several years living there. Last year, Nicholas Cunigan, a PhD student studying the climate history of the Dutch West India Company, joined the Climate History Network as our newsletter editor. I still created almost all of the content at HistoricalClimatology.com, and a good share at the Climate History Network homepage. Yet increasingly, I belonged to a team of like-minded scholars.  The Climate History Network homepage in 2014. A lot of things changed in 2015, not only for me but for the climate history resources I helped create. In August, I joined Georgetown University as a tenure-track assistant professor of environmental history. I won awards from Georgetown that let me expand and redesign HistoricalClimatology.com and the Climate History Network website. Meanwhile, our popularity soared. Last year, this site received around 200,000 hits. The Climate History Network homepage received fewer hits - just under 20,000 - but many of these are from scholars who use our resources to support their scholarship and teaching. We launched the Climate History Podcast, which currently features quarterly interviews with major figures in climate change scholarship.
I view this as the beginning of the end of the process that I started back in 2011, when I transformed this website into something less focused on my own scholarship. Increasingly, our climate history websites will not only continue to reach a broader audience, but also feature insights from a range of senior and junior scholars in the sciences and the humanities. Diverse scholars, at Georgetown and elsewhere, will now help me build our websites, write our feature stories, update our social media feeds, improve our tools, and expand the reach of scholarship into past climates. We will expand offline, by hosting climate history workshops at Georgetown, as well as a major conference dedicated to connections between climate changes and conflict. To that end, we now have a large team of young professors and graduate students in climate history. These are the people who will help develop our resources in the coming years, in no particular order: Dr. Dagomar Degroot: Director, HistoricalClimatology.com, Co-Director, Climate History Network. Assistant professor of environmental history, Georgetown University. Dr. Sam White: Co-Director, Climate History Network. Associate professor of environmental history, Ohio State University. Bathsheba Demuth: Assistant Director, HistoricalClimatology.com and the Climate History Network. PhD candidate in environmental history, University of California, Berkeley, and incoming assistant professor of environmental history, Brown University. Nicholas Cunigan: Newsletter Editor, Climate History Network. PhD candidate in environmental history, University of Kansas, and adjunct professor of history, Calvin College. Faisal Husain: Project Editor, HistoricalClimatology.com. PhD candidate in environmental history, Georgetown University. Matthew Johnson: News Editor, Climate History Network. PhD candidate in environmental history, Georgetown University. Katrin Kleemann: Social Media Editor, HistoricalClimatology.com and the Climate History Network. PhD candidate in environmental history, Rachel Carson Center. Benoit Lecavalier: Contributing Editor, HistoricalClimatology.com. PhD candidate in physics and physical oceanography, Memorial University. If you want to read more about us, you can visit the "People" page of HistoricalClimatology.com, and the "About Us" page of the Climate History Network website. I am delighted to work with such talented and industrious colleagues, and I'm looking forward to seeing where we can go from here. If you have any suggestions, please do not hesitate to contact me. ~Dagomar Degroot Ask most people about climate change, and you will soon find that even the relatively informed make two big assumptions. First: the world’s climate was more or less stable until recently, and second: human actions started changing our climate with the advent of industrialization. If you have spent any time reading through this website, you will know that the first assumption is false. For millions of years, changes in Earth’s climate, driven by natural forces, have radically transformed the conditions for life on Earth. Admittedly, the most recent geological epoch – the Holocene – is defined, in part, by its relatively stable climate. Nevertheless, regional and even global climates have still changed quickly, and often dramatically, in ways that influenced societies long before the recent onset of global warming. Take, for example, the sixteenth century. Relative to early twentieth-century averages, the decades between 1530 and 1560 were relatively mild in much of the northern hemisphere. Yet, after 1565, average annual temperatures in the northern hemisphere fell to at least one degree Celsius below their early twentieth-century norms. Despite substantial interannual variations, temperatures remained generally cool until the aftermath of a bitterly cold “year without summer,” in 1628. Since the expansion of the glacier near Grindelwald, a Swiss town, was among the clearest signs of a chillier climate, these decades are collectively called the “Grindelwald Fluctuation.” It was one of the coldest periods in a generally cool climatic regime that is today known as the “Little Ice Age.” 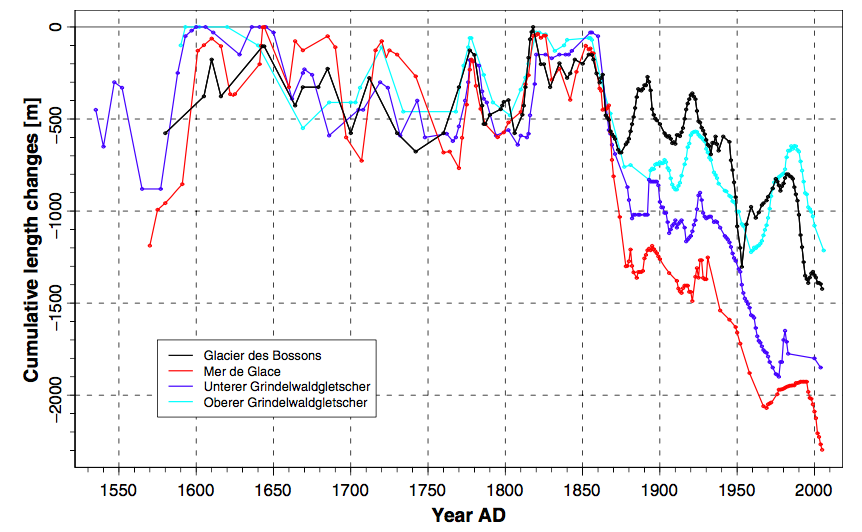 Length changes of four well-documented Alpine glaciers, based on historical sources. Volcanic eruptions undoubtedly caused some of the cooling. In 1595, the eruption of Nevado del Ruiz released sulphur aerosols into the atmosphere, scattering sunlight and thereby cooling the planet. Just five years later, Huaynaputina exploded in one of the most powerful volcanic explosions of the past 2,500 years. Major volcanic eruptions following in close proximity to one another can trigger long-term cooling by activating "positive feedbacks" in different parts of Earth’s climate system. In the Arctic, for example, volcanic dust veils lead to chillier temperatures, which can increase the extent of Arctic ice that, through its high albedo, reflects more sunlight into space than the water or land it replaces. That in turn leads to even cooler temperatures, more ice, and so on. However, the onset of the Grindelwald Fluctuation preceded the eruption of Nevado del Ruiz by some thirty years. Clearly, volcanoes were not the only culprits for the colder climate. Some scientists believe that low solar activity also played a role. Yet, although the sun was less active during the Grindelwald Fluctuation than it is today, it will still more active than it was in most other decades of the Little Ice Age. 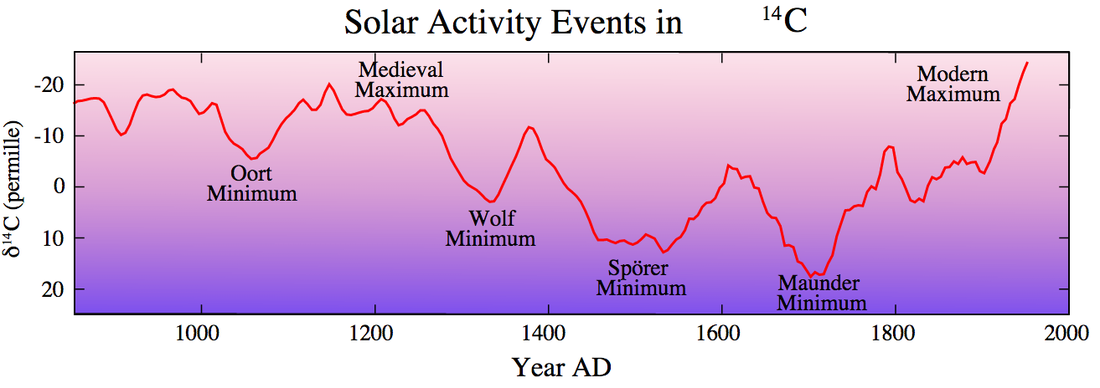 Solar minima and maxima over the past 2,000 years. The Grindelwald Fluctuation divides the Spörer Minimum from the Maunder Minimum. That leads us to our second assumption: the idea that anthropogenic climate change began with industrialization. Most scholars of past climate change would still agree, but that might be changing. Recently, a growing body of evidence has started to suggest that humanity’s impact on Earth’s climate might be much older. Human depravity, it seems, might have been to blame for the cooling of the sixteenth century. Back in 2003, palaeoclimatologist William Ruddiman proposed that humans were to blame for preindustrial climate change, in a groundbreaking article that shocked the scientific community. Two years later, he thoroughly explained and defended his conclusions in book called Plows, Plagues, and Petroleum: How Humans Took Control of Climate. Ruddiman argued that humanity had slowly but progressively altered Earth’s atmosphere since the widespread adoption of agriculture. Some 8,000 years ago, communities in China, Europe, and India made room for agricultural monocultures by burning away forests. According to Ruddiman, the scale of deforestation was enough to steadily increase the concentration of atmospheric carbon dioxide. Then, from around 5,000 years ago, rice farming and, to a lesser extent, livestock cultivation slowly raised atmospheric methane concentrations. Ruddiman concluded that the cumulative effect of these anthropogenic greenhouse gas emissions was to gradually increase average global temperatures, and perhaps ward off another ice age. Ruddiman also argued that, since the adoption of agriculture, temporary fluctuations in atmospheric carbon dioxide concentrations followed from dramatic changes in human populations. During major disease outbreaks, Ruddiman insisted, populations declined to such an extent that agricultural land went untilled on a vast scale. Woodlands expanded, pulling more carbon dioxide out of the atmosphere than the agricultural crops they replaced, and thereby cooling the planet. When populations recovered, farmers burned down forests and planted their monocultures, warming the Earth. 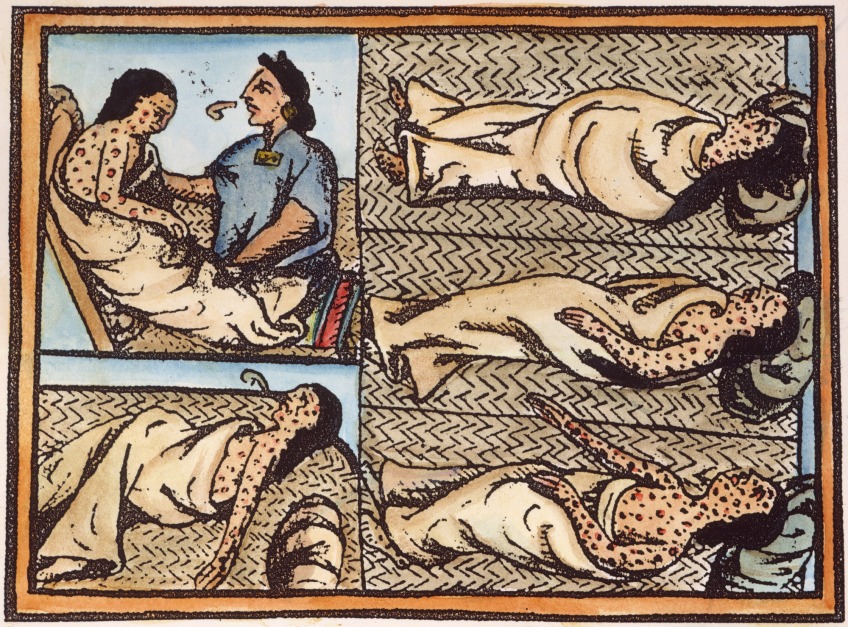 Mesoamerican infected with smallpox, from the Florentine Codex by Bernardino de Sahagún. During the sixteenth century, Spanish soldiers and settlers established a vast empire by waging environmentally destructive wars on the indigenous peoples of central and southern America. They forced many of the survivors into new settlement patterns and gruelling forced labour. They also disrupted indigenous ways of life by appropriating, and often transforming, regional environments. Their animals, plants, and pathogens encountered virgin populations and spread rapidly. Indigenous communities in hot, humid climates were especially vulnerable to outbreaks of Eurasian crowd diseases, which included smallpox, measles, influenza, mumps, diphtheria, typhus, and pulmonary plague. Recent population modelling suggests that the population of the Americas declined from approximately 61 million in 1492 to six million in 1650. By the late sixteenth century, this holocaust was well underway. Land previously colonized by indigenous communities through controlled burning or the planting of agricultural monocultures gradually reverted to woodlands. While all plants inhale carbon dioxide and exhale oxygen, tropical rainforests are much more effective carbon sinks than human crops. In the Americas, reforestation on a vast scale probably lowered atmospheric concentrations of carbon dioxide by 7 to 10 parts per million between 1570 and 1620. Human cruelty may therefore have contributed to the climatic cooling also caused by volcanic eruptions and, maybe, a decline in solar radiation relative to modern or medieval norms. 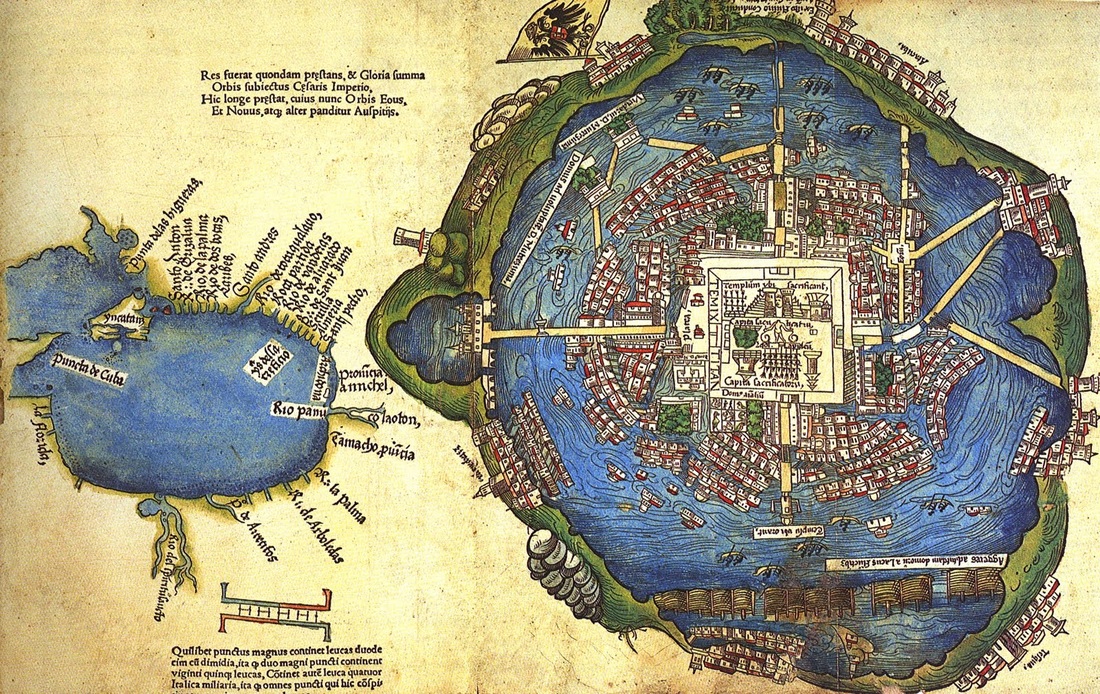 A Spanish depiction of Tenochtitlan, the Aztec capitol, 1524. A growing body of scholarship now provides evidence for these relationships. However, there are many questions that must be answered before we can confidently conclude that depopulation helped trigger the Grindelwald Fluctuation, let alone other episodes of climatic cooling. For instance: did the cooling effect of sixteenth-century reforestation in the Americas overwhelm the warming influence of contemporaneous deforestation in China and India? Were invasive species introduced by Europeans into the Americas incapable of preventing reforestation? Was the pace of depopulation, and in turn reforestation, really so fast and so universal that it could substantially reduce atmospheric carbon dioxide concentrations over the course of a few decades? It will take a while to answer these questions, but some scholars are already drawing big conclusions. Earlier this year, geographers Simon Lewis and Mark Maslin argued that the cooling set in motion by the depopulation of the Americas could be considered the beginning of the “Anthropocene,” the proposed geological epoch dominated by human transformations of the world’s environment. Dating big changes in geological time is tricky business. The changes must be visible in the global stratigraphic record – that is, in rock layers – and they must be traceable to a specific date. Lewis and Maslin lean on earlier environmental histories of the “Columbian Exchange,” the European transfer of plants, animals, and pathogens between the New and Old Worlds. The impact was a global biotic homogenization that, according to Lewis and Maslin, should be visible in the stratigraphic record. That still leaves them without a specific date, however. They settle on 1610, because that was when atmospheric carbon dioxide levels reached a minimum caused, they say, by European depopulation of the Americas. 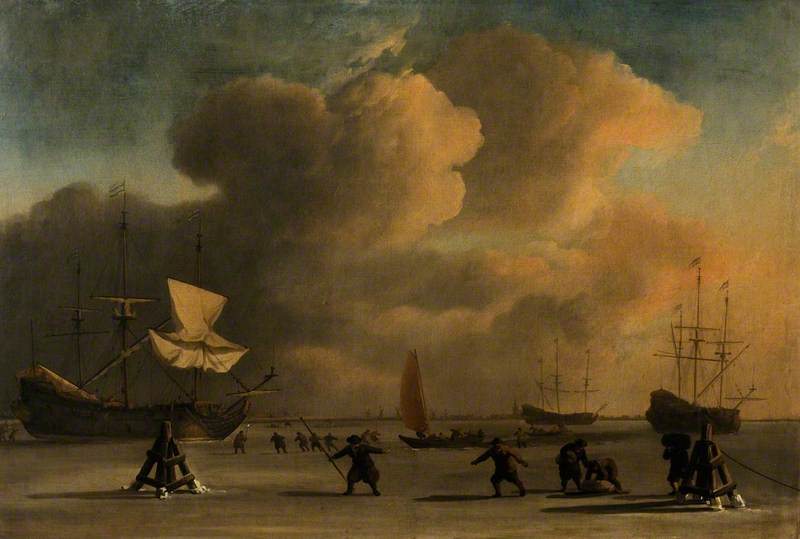 Warships, stuck in the ice during the Dutch Revolt. There may be one more wrinkle to this sad story. In a forthcoming book, I argue that the Dutch revolt against the Spanish empire was provoked, in part, by high food prices that followed from harvest failures during the chilly onset of the Grindelwald Fluctuation. Then, until the early seventeenth century, the Dutch rebellion benefitted from a chilly climate. Dutch fortifications routinely forced Spanish armies to stay in the field during the frigid winters of the Grindelwald Fluctuation. The effect on Spanish soldiers could be disastrous. It is possible, therefore, that Spanish conquests in one part of the world contributed to climate changes that benefitted a rebellion against Spanish rule in another.
If so, the Eighty Years’ War may provide one of the first examples of such a self-defeating climate history of violence. It was certainly not the last. Recently, interdisciplinary researchers have found similar connections at work in the Syrian civil war. In a poorly governed society already destabilized by migrants fleeing the American invasion of Iraq, a severe drought caused, in part, by anthropogenic warming created fertile conditions for rebellion. The countries now at war in Syria and Iraq include those most responsible for the climate change that helped set the conflict in motion. Studying the Grindelwald Fluctuation may provide deep context for these relationships, by rooting them in a long history of violence and environmental transformation. It may also show that both assumptions commonly held about climate change are wrong. ~Dagomar Degroot My thanks to professors John McNeill, Richard Hoffmann, and Sam White for suggesting sources and helping me think through these relationships. Graph Source: Nussbaumer, Samuel U. and Heinz J. Zumbühl, "The Little Ice Age history of the Glacier des Bossons (Mont Blanc massif, France): a new high-resolution glacier length curve based on historical documents." Climatic Change 111 (2012): 301-334. On Volcanic Cooling: Sigl, Michael, M. Winstrup, J. R. McConnell, K. C. Welten, G. Plunkett, F. Ludlow, U. Büntgen, M. Caffee, et al., “Timing and Climate Forcing of Volcanic Eruptions for the Past 2,500 Years,” Nature 523 (2015): 543–49. On Anthropogenic Cooling: Dull, Robert A., Richard J. Nevle, William I. Woods, Dennis K. Bird, Shiri Avnery, and William M. Denevan. “The Columbian Encounter and the Little Ice Age: Abrupt Land Use Change, Fire, and Greenhouse Forcing.” Annals of the Association of American Geographers 100 (2010): 755–71. doi:10.1080/00045608.2010.502432. Etheridge, D. M., L. P. Steele, R. L. Langenfelds, R. J. Francey, J.-M. Barnola, and V. I. Morgan. “Natural and Anthropogenic Changes in Atmospheric CO2 over the Last 1000 Years from Air in Antarctic Ice and Firn.” Journal of Geophysical Research: Atmospheres 101, no. D2 (1996): 4115–28. doi:10.1029/95JD03410. Ganopolski, A., R. Winkelmann, and H. J. Schellnhuber. “Critical insolation–CO2 Relation for Diagnosing Past and Future Glacial Inception.” Nature529 (2016): 200–203. doi:10.1038/nature16494. Hunter, Richard, and Andrew Sluyter. “Sixteenth-Century Soil Carbon Sequestration Rates Based on Mexican Land-Grant Documents.” Holocene 25 (2015): 880–85. doi:10.1177/0959683615569323. Kaplan, Jed O. “Holocene Carbon Cycle: Climate or Humans?” Nature Geoscience 8 (2015): 335–36. doi:10.1038/ngeo2432. Lewis, Simon L. and Mark A. Maslin. “Defining the Anthropocene.” Nature 519 (2015): 171-180. Mitchell, Logan, Ed Brook, James E. Lee, Christo Buizert, and Todd Sowers. “Constraints on the Late Holocene Anthropogenic Contribution to the Atmospheric Methane Budget.” Science 342 (2013): 964–66. doi:10.1126/science.1238920. Nevle, R.J., D.K. Bird, W.F. Ruddiman, and R.A. Dull. “Neotropical Human–Landscape Interactions, Fire, and Atmospheric CO2 during European Conquest.” The Holocene 21 (2011): 853–64. doi:10.1177/0959683611404578. Pasteris, Daniel, Joseph R. McConnell, Ross Edwards, Elizabeth Isaksson, and Mary R. Albert. “Acidity Decline in Antarctic Ice Cores during the Little Ice Age Linked to Changes in Atmospheric Nitrate and Sea Salt Concentrations.” Journal of Geophysical Research: Atmospheres 119 (2014): 5640–52. doi:10.1002/2013JD020377. Ruddiman, William. “The Anthropogenic Greenhouse Era Began Thousands of Years Ago.” Climatic Change 61 (2003): 261–93. Ruddiman, William. Plows, Plagues, and Petroleum: How Humans Took Control of Climate. Princeton, NJ: Princeton University Press, 2005. Ruddiman, William, Steve Vavrus, John Kutzbach, and Feng He. “Does Pre-Industrial Warming Double the Anthropogenic Total?” The Anthropocene Review 1 (2014): 147–53. doi:10.1177/2053019614529263. Wang, Z., J. Chappellaz, K. Park, and J.E. Mark. “Large Variations in Southern Hemisphere Biomass Burning During the Last 650 Years.” Science330 (2010): 1663–66. This semester, I taught my first course devoted exclusively to the environmental history of climate change. The course was, as one of my senior auditors pointed out, unusually ambitious. Luckily, I had a group of brilliant, hard-working students who embraced its challenges. Their coursework included a fifteen-page essay that connected a change in past global or regional climates to an episode in human history. They had to find a topic and then use a primary source to make an argument about that topic. They needed to support their argument using a blend of scientific and humanistic scholarship. The results were impressive, and you can read some of the abstracts here. As my course reached its conclusion, I started thinking about how it could be improved for my next group of passionate Georgetown undergraduates. Courses dedicated largely or exclusively to climate history are only now becoming possible, so teaching guides are difficult to come by. With that in mind, I reached out to some of the environmental historians I respect most. I asked them some questions about teaching climate history to students, and I have copied their responses below. I have included my own reflections.  1. What is the biggest difference between teaching climate history and teaching other kinds of history? Professor Richard Hoffmann, York University: I have always taught climate history in the context of broader environmental history or even general survey courses. The introduction to history students of a new ‘historical agent’ and unfamiliar methodologies distinguishes climate history and several other aspects of environmental history (disease, agroecosystems). Perhaps oddly, undergraduates seem to me to take to the notion of climate having impact (but also assume a lot of determinism) much more readily than they grasp the need to understand palaeoscience.  Professor Alan MacEachern, Western University: There are more graphs, I would say only somewhat facetiously. Keeling curve, pie charts, carbon cycle, etc. -- some History students struggled early on with the tables, graphs, & illustrations that a course in climate history requires. And we jumped right in, with a first class entitled “The Earth’s Climate Made Easy (I hope).” But students got a lot out of learning to read them – reading them for the narratives & for the limitations of those narratives. For example, to see how much the graphic representation of the Medieval Warm Period and Little Ice Age had changed from the 1990 IPCC to the 2007 IPCC is to see what’s gained and lost in a simplified narrative.  Professor John McNeill, Georgetown University: In my case the biggest differences were that I team-taught with an earth scientist. He handled all lecturing on the physics of the climate system, and some of the changes in paleoclimate. I handled some of the latter, and all the impacts of climate shifts and shocks on human affairs. That made it a lot easier for me, because I did not have to answer questions about atmospheric Rossby waves. However, it also made for some discontinuity in the class, as we shifted back and forth from climatology to climate history. I also felt the course was spottier, more episodic than my usual undergraduate classes. We began the chronological sequence 7 million years ago, with occasional backward glances to deeper time, and touched down at about two dozen moments between then and now. We employed a strong bias in favor of moments of climate change or extreme climate shocks and ignored almost everything in between. And I felt the course was more constrained by paucity of data from some parts of the world. Historians collectively have done a great job in the past 50 years of attending to the history of formerly neglected parts of the world. Climate history data are still rather thin for some regions, and it will take time, and possibly new forms of proxy evidence, to remedy that.  Professor Dagomar Degroot, Georgetown University: For me, the immense temporal and geographic scales that climate history invites us to explore. My course began by showing why and how global climates fluctuated across tens and even hundreds of millions of years. It then connected climate changes to human evolution on 100,000-year scales. On the one hand, climate history provides a rare opportunity to introduce history students to the really deep past, and to explain why that past matters. On the other, that opportunity comes with risks. For example, we can easily fall into the deterministic trap of reducing human history to climate. Our courses can also lack coherence when we get into the most recent past. Because we suddenly have far more primary source accounts of human thoughts and actions, our temporal scale of analysis can abruptly narrow. We start to cover different topics: ideas of climate change, for example, that are simply impossible to reconstruct in any detail before the medieval period. Climate history, therefore, comes with unusual challenges, both for students (see below) and instructors. 2. What about climate history most challenges your students? Hoffmann: Accepting the need to cope critically with non-traditional source materials and evidence. Quantitative evidence, use of models, and theory are unfamiliar, even alien, to the mindset of many history students. In this, I’ll point out, climate history differs little from my early career experience trying to teach economic history and quantitative social history. Students will read right past graphs and tables, having learned in high school this method of avoidance. If you really wish to overcome this for at least the better students, you need to spend small group classroom time working laboriously through some such graphic presentations to force students to see how to draw conclusions. They then need to be walked through as small and clear a piece of palaeoscientific scholarship as we can find, so they see what the strengths and the limits of that data might be. My best students in environmental history have either come from scientific backgrounds or realized early on the need to gain the expertise to be solid critical consumers of science to use it to help them understand the past. MacEachern: Perhaps the matter of scale – both spatial & temporal scale. How worthwhile is a micro study if it’s an outlier in terms of what’s happening on most of the planet or across a longer period of time? Conversely, how worthwhile is a macro study if sociocultural specificity is lost? Of course, those are questions for all students of history: even if we assume the usefulness of the past, what / whose specific pasts should we be sure to know, and what lessons can we take from those pasts? …I’d add a second challenge: The disconnect between how long we’ve known about climate change and how little we’ve done with that knowledge. A student mentioned being blown away by Kenneth Hare’s pronouncement at the 1988 Toronto climate conference, that climate change is “the central environmental problem of our times” – emphasis in original. And it’s been a generation since then. 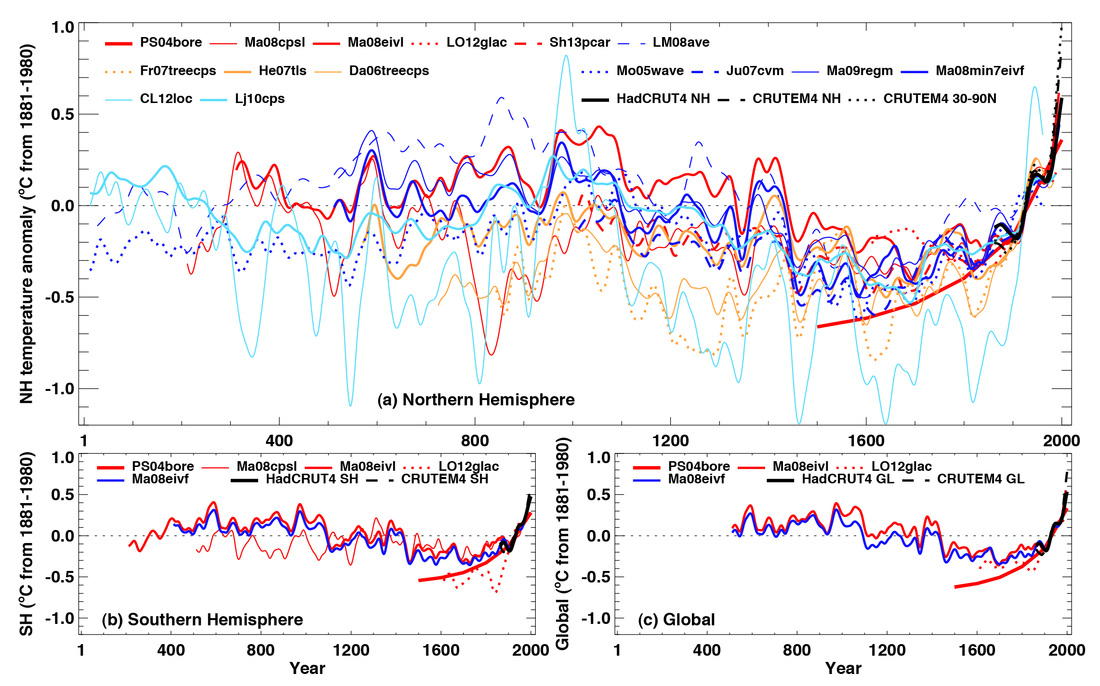 A climate reconstruction of the past two millennia, used in Degroot's climate history course. Source: IPCC 2014. McNeill: In our class I would guess the toughest challenge was handling two disparate sorts of data. While my colleague and I lectured on (and graded) only what we knew best, the students had no such luxury. So they had to master some technical and quantitative aspects of the climate system and atmospheric physics, but they also had to master the complexities of social change in wildly diverse cultural and political settings on which they had little background beyond what I was able to provide. Degroot: When my students signed up for my course, many did not know what to expect. Most thought they were taking a more traditional, narrowly focused history course, with a little bit of science thrown in. However, the first month of my course was all about Earth science and the distant, prehistorical past. We read some difficult articles and books that introduced my students to interdisciplinary methodologies and concepts. We interpreted graphs, graphs, and more graphs, with the occasional map thrown in. Some of my students acknowledged that they were much more at ease when we arrived at the more recent past, and human voices started appearing in course readings and lectures. When I next teach my course, I must now decide whether to narrow its focus. It would, of course, be easier for me to teach a course on the last millennium of climate history. Doing that would let me devote much more time on some fascinating issues and concepts, including: how we reconstruct climate changes, what people might have thought about them, and how global warming was first discovered. However, students in other courses are rarely introduced to the perspective of the really deep past. Without the first month of my course, they might never come to understand how profoundly environmental changes have shaped humanity, and for how long humanity has transformed global environments. Climate history, therefore, forces us to make some hard pedagogical choices. 3. After your students leave your course, what concept pertaining to climate history do you most want them to remember? Hoffmann: Understanding climate as patterns and trends in the atmosphere which are manifest both in specific kinds of events (catastrophes and ‘sunny days’) and slow onset movements (changes in winter severity, precipitation totals, etc) visible only in retrospect and at different spatial scales. Learn why we would now rather refer, for example, to the “Medieval Climatic Anomaly’ instead of the “Medieval Warm Period” – and thus be open to different consequences for different human societies at the same time. MacEachern: Again, it’s a concept that pertains not just to climate history, but to all history: determinism. Mike Hulme has a nice line about climate history too often making the past seem “climate-shaped.” Coming in, some of the students believed that, since this was a climate history course, we would find everything in history to be attributable to climate. Instead, we repeatedly discussed what would be the appropriate description of climate’s role in history, and how that role changed from case by case, place by place, time by time. McNeill: I’d like to think they can remember more than one concept from our class! I’d like them to remember that climate has been changing, faster or slower, for time out of mind. I’d like them to remember that climate changes and shocks ripple through natural and human systems, affecting a wide range of things, beginning with agriculture but extending to less obvious areas, such as disease regimes, I’d like them to remember that human societies have responded and adjusted to climate change, although at times only at great cost. I’d like them to remember that most responses in times past involved migration. 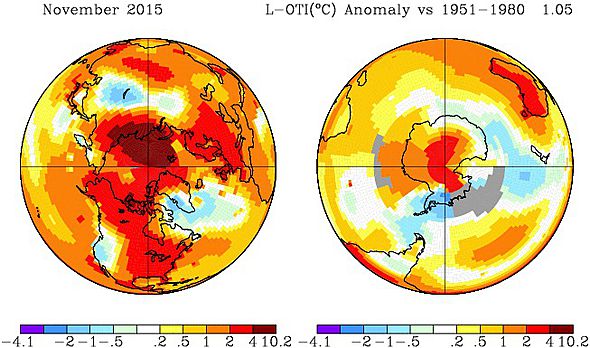 Record-shattering global temperatures last month. Source: NASA GISS Degroot: I asked my students what they would take away from my climate history course. Here are some of their responses:
All of these lessons are important, but the last one is closest to my heart. As an environmental historian, I love teaching about the past in ways that change how students understand the present and the future. 4. In your opinion, how will the teaching of climate history change over the coming decade? Hoffmann: I’d like to hope you will be able to find more students in history classes better prepared to handle scientific and quantitative information and arguments . . . and not only because more students from science drop into your courses. It is also plain to me that you will have ever-increasing capabilities for interactive visual displays in the classroom setting, which you will need to employ as more than just eye candy and without letting such overwhelm critical thinking about how past people responded to and changed their experiences of climate events and trends. MacEachern: As with environmental history, there’ll be growing acceptance within the history field that this is history: that historians have a role to play in understanding past climates and humans’ relationships to climate, and that this is history that students – Arts, Science, and Environmental Science students – should know. And there’ll be more & better potential textbooks. Perhaps not surprisingly, I struggled to find a book that mixed a global history of climate with a history of meteorology with a history of our understanding of climate change. Instead, I cobbled from Behringer’s Cultural History of Climate, Weart’s Discovery of Global Warming, Zeller’s Inventing Canada, & a wide range of essays. McNeill: That’s a tough one. I imagine there are 50 ways to teach climate history now and as more people get into it that number will climb. So there will be many simultaneous but not necessarily parallel directions of change. That said, I hope we can look forward to more data from the neglected parts of the world; finer resolution for some of the data we think we have; more careful correlation of textual and natural archives on the part of practitioners in the field; and greater rigor in the assertions about climate’s impact on societies. If we get some of these things, the teaching of climate history will become more compelling for students. Something also depends on what climate change and extreme climate events the next ten years bring. In this respect, the past we teach will depend on the future we await. Degroot: There will be ten more years of climate history. Many of my students were fascinated by the histories of the Syrian and Sudanese civil wars, which may have been provoked, in part, by climate change. Other students wanted to explore the probable relationship between anthropogenic warming and hurricanes Katrina and Sandy. Most of my students were concerned by the ongoing transformation of the Arctic. All of these changes – and many others – have unfolded in the last decade. I fear that, in the next decade, we will have many more examples of climate history to capture the attention of our students. Many thanks to Professors Hoffmann, MacEachern, and McNeill for taking part in this interview during one of the busiest times of the year. The interview will be permanently featured on the redesigned website of the Climate History Network.
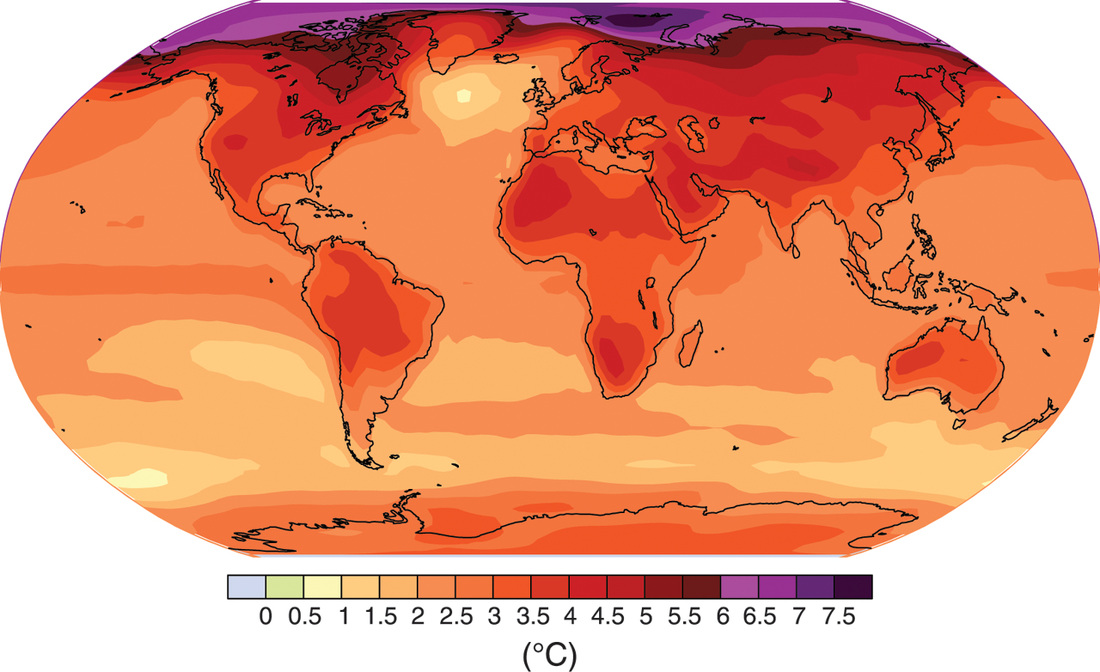 Global temperatures in 2090-99, relative to 1990-99. Source: IPCC 2014 This week, roughly 40,000 delegates from 147 nations gather in Paris for the twenty-first annual "Conference of Parties" (COP21) in the fight against climate change. For the first time, participating governments will seek a legally binding agreement on mitigating and adapting to climate change. Their ambition will be to ensure that average global temperatures do not rise more than two degrees Celsius above their preindustrial averages. However, this goal now faces at least four serious challenges. First, the governments of some developing countries, led by India, have insisted that relatively poor countries should not have to reduce their greenhouse gas emissions. They maintain that developed nations long exploited cheap energy to build their present wealth. These countries should therefore pay the price for global warming. Such thinking is not without merit, but it ignores the political challenges faced by governments in developed nations. It is also disingenuous: developing countries now account for such a large share of the world's carbon emissions that no cuts made by wealthy nations alone could sufficiently mitigate climate change. Second, pledges currently made by participating governments would still lead to warming of nearly three degrees Celsius, well beyond the two degree limit suggested by scientists. Third, while that limit is the most ambitious goal we can now hope to achieve, it may not be enough to avoid catastrophic and irreversible changes in regional environments. Studies of past climates - many described on this site - have revealed the disturbing vulnerability of ecosystems and civilizations to even minor fluctuations in average global temperatures. Finally, fourth, a poll recently carried out in twenty countries has revealed sharply declining popular support for ambitious climate change targets at COP21. This disheartening shift in public opinion may reflect new fears about terrorist attacks launched by ISIS, which appears to be the more pressing problem. Yet some recent scientific articles conclude that the Syrian civil war, and in turn the rise of ISIS, may have been partially enabled by climate change. Nevertheless, the urgency of action has never been more clear. This year will be, by far, the warmest ever recorded, and October was an especially hot month even in that context. This is a map of global temperatures in October, relative to worldwide averages between 1951 and 1980:  Source: NASA GISSTEMP The following graph compares average global temperatures this year with some other years of record-breaking month. It shows what can happen when an extreme El Niño compounds the warming influence of greenhouse gas emissions: 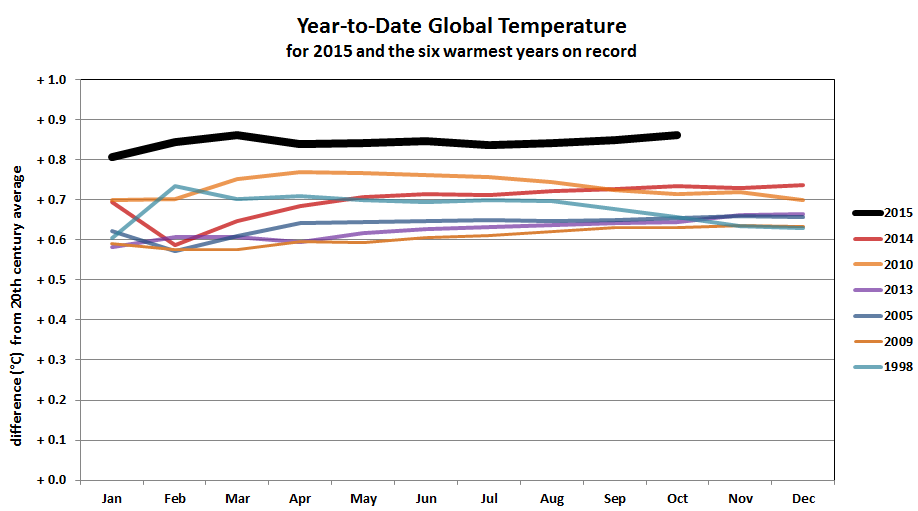 Source: NOAA NCEI Just before the students of my climate history course left for their Thanksgiving holidays, they had to endure one of my gloomier lectures. I gave them a vision of how Earth's climate will change in the coming century. In the United States, the act of giving thanks for what we have is quickly followed by a mad drive to have even more, on "Black Friday" and "Cyber Monday." Yet, the science on climate change shows that, on a societal scale, our drive to consume is devouring our future. After I gave my lecture, it occurred to me that, during COP21, this vision of the coming century should be widely shared by climate change researchers. It may be our best response to the headwinds that now challenge a comprehensive climate agreement. I began my lecture by explaining that, according to model simulations in the latest IPCC Assessment Report, this is how global temperatures and precipitation patterns will likely change by 2081-2100, relative to averages in 1986-2005: 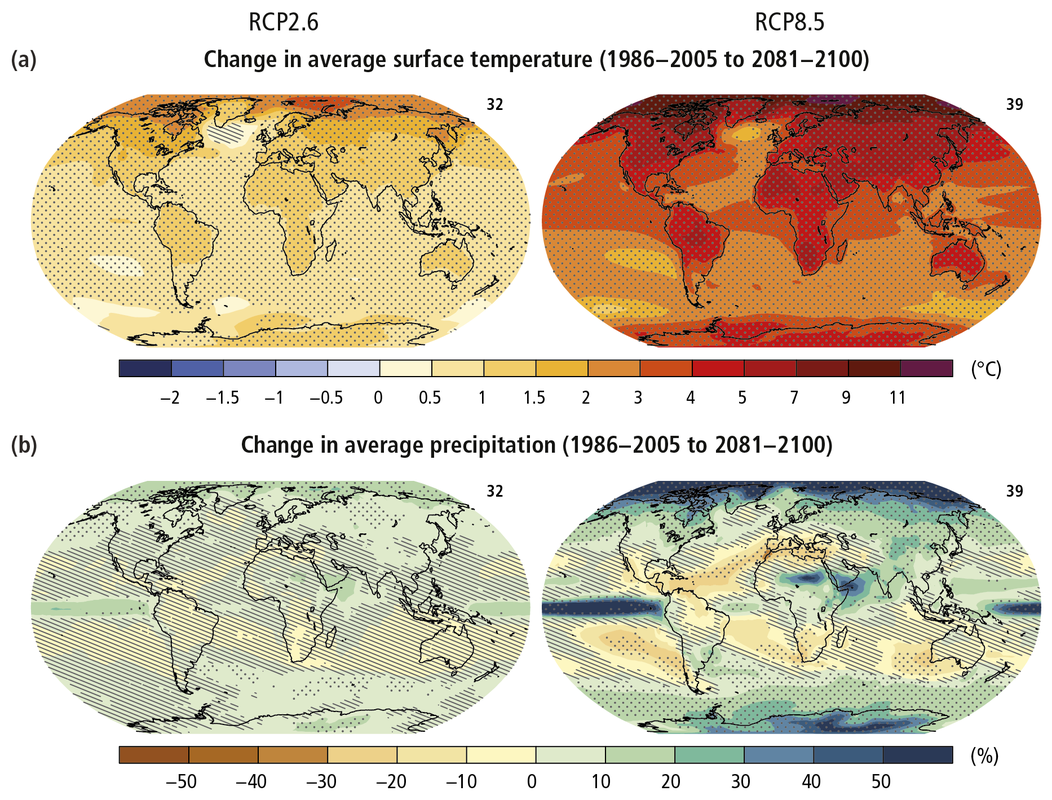 Source: IPCC 2014 That's according to middle-of-the road greenhouse gas emission scenarios (in other words, if we take only moderate action to reduce our carbon emissions). These maps reveal that regional differences in the scale of warming will dramatically increase the overall impact, for human beings, of even modest global increases in average annual temperatures. The Arctic will likely be much warmer and wetter in 2100 than it is today, for example, while Europe will probably be far drier and hotter. The impact of these changes will be further exacerbated by an increase in the regional frequency of weather extremes. Hurricanes, typhoons, and cyclones may well become more severe, if not necessarily more common, and heatwaves will be far more frequent. The following maps demonstrate that, in many places, both droughts and floods will also be much more common in 2080-2099 than they were in 1986-2005. They depict changes according to very high warming scenarios. 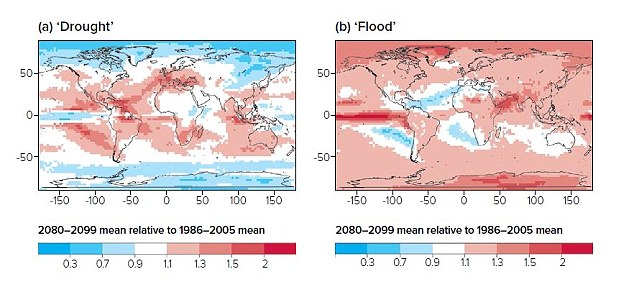 Source: Royal Society, 2014 The warming of the Arctic climate is already transforming the "cryosphere," the part of the Earth where water remains frozen. Melting ice is contributing to sea levels that are already rising because water expands when it gets warmer. These changes will continue in the decades ahead. A recent study concluded that sea levels could rise by nearly seven feet by 2100. That would be enough to swamp many of the world's coastal cities. However, this prediction may be underselling the threat, because it does not account for the catastrophic ice loss in Greenland and Antarctica. Scientists have recently discovered that Greenland is melting more quickly and more thoroughly than they had expected. The complete melting of the Greenland ice sheet will probably take thousands of years, but it will eventually raise sea levels by some 23 feet. The story in Antarctica is far more complex. Scientists recently announced that the West Antarctic Ice Sheet has started an irreversible but relatively slow-moving collapse. This conclusion was not included in the fifth IPCC assessment report, but it will eventually raise global sea levels by a further 12 feet. Nevertheless, a new NASA study has found that an increase in Antarctic snow accumulation that began 10,000 years ago is adding enough ice to the continent to more than outweigh losses from the West Antarctic Ice Sheet. Within 20 to 30 years, however, Antarctic ice losses should start exceeding accumulation. Even the IPCC's conservative sea level predictions are concerning. These maps compare sea levels in 1986-2005 to their projected averages in 2081-2100. Atmospheric and oceanic circulation ensure that sea levels are not uniform, and some of the most severe changes will affect the coasts of Africa. 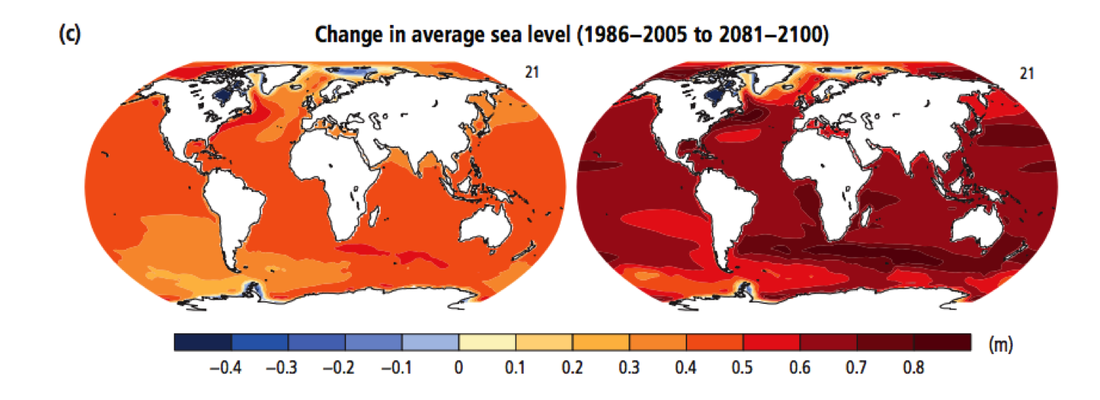 Source: IPCC 2014 This widely shared highlight from the documentary Chasing Ice provides a dramatic example of the changes underway in Greenland: Some of the most troubling manifestations of climate change are unfolding in the world's oceans. Approximately 30 to 40% of human carbon emissions dissolve into water. Some of these emissions react with water to form carbonic acid, which ultimately increases ocean acidity through additional chemical reactions. Oceans will probably become 170% more acidic by 2100. The current rate of acidification is 100 times faster than any other changes in ocean acidity over the last 20 million years. Ocean acidification will have catastrophic consequences for many (but not all) kinds of marine life. It will depresses metabolic rates for animals such as jumbo squid, and dampen immune responses in animals such as blue mussel. By killing algae, it will threaten reef ecosystems by bleaching coral and reducing oxygen levels. The following maps show oceanic pH levels in 1850 (top) and, according to forecasts, 2100 (bottom). The lower the number (and warmer the colour), the higher the pH level (and more acidic the water). 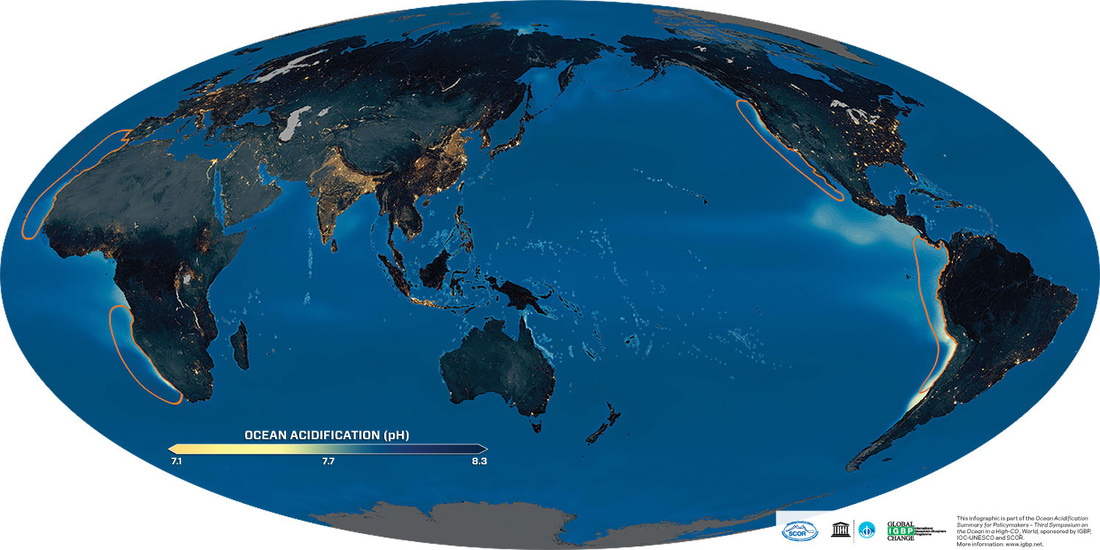 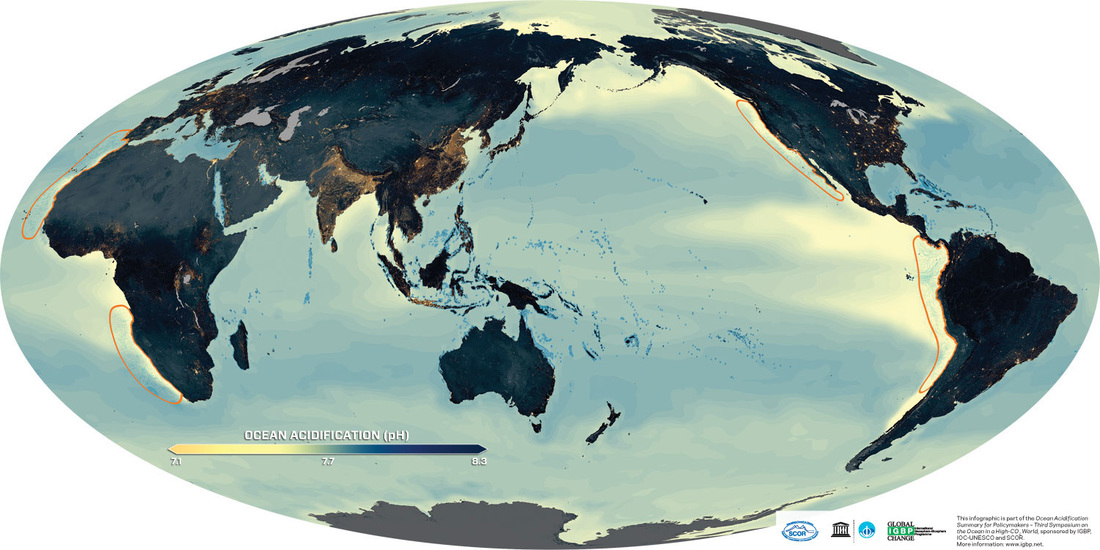 Source: Ocean Acidification Summary for Policymakers, International Geosphere-Biosphere Programme All of these forecasts assume that anthropogenic greenhouse gas emissions will keep the world's climate below so-called "tipping points" or "threshold values" that could set in motion some truly dramatic, planet-altering changes. However, these tipping points are poorly understood, and our emissions may well exceed them. One of these tipping points would lead to the breakdown of the vast ocean current called the Atlantic Meridional Overturning Circulation (AMOC), which helps govern the world’s climate. When ice forms in the Arctic and northern Atlantic Oceans, water around it gets saltier and therefore heavier. When it sinks, water from farther south moves north to replace it. This brings heat far into the northern hemisphere. When ice melts on a huge scale, cold freshwater drains into the northern Atlantic and slows down the current. Take a look at the map of October temperatures, at the top of this article. That cold spot near Greenland reflects meltwater from the Greenland ice sheet. The AMOC is already slowing down. Could the collapse of the Greenland ice sheet shut it down completely, and, ironically, bring bitter cold to Europe and North America? More worrisome still is the risk of widespread melting of the permafrost, which currently stores some 1.4 trillion tons of methane. As a greenhouse gas, methane is 84 times more potent than Carbon Dioxide. The permafrost is already starting to melt on a large scale. In 2006, melting Siberian permafrost released 3.8 million tons of methane into atmosphere, but in 2013, that number increased to 17 million tons. There is a feedback loop at work here, because melting permafrost warms the atmosphere, especially in the far north, which then leads to more melting. More dramatic melting of the world's permafrost would lead to more warming than is predicted by even the IPCC's worst-case scenarios. The map below depicts the global distribution of permafrost, and shows the scale of the potential problem: 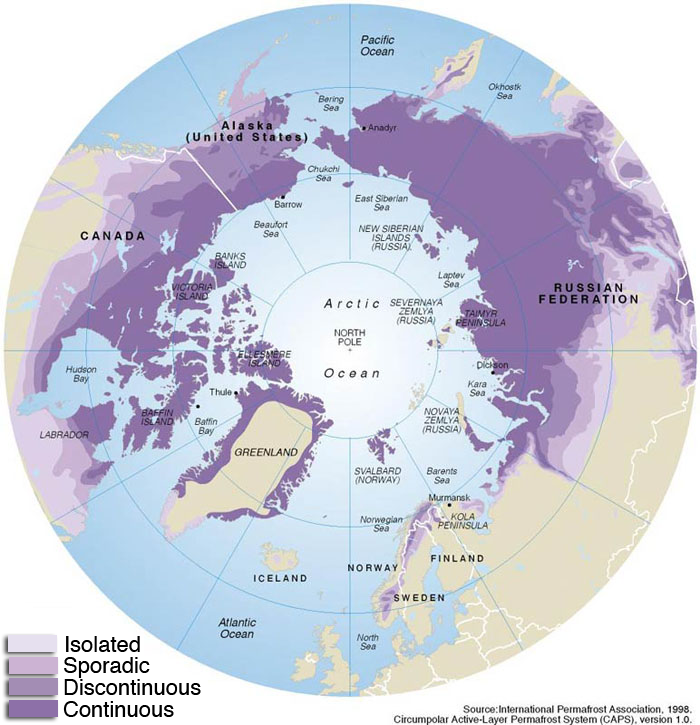 Some the changes I've described will happen, no matter what we do. The complicated graph below depicts the predicted extent of global warming, according to different emissions scenarios. It demonstrates that, even if we dramatically and immediately slash our emissions, the globe will still warm by nearly two degrees Celsius, relative to twentieth-century averages. Yet it also shows that, by acting now, governments can avoid truly catastrophic warming. The world's future is in the hands of the delegates in Paris. 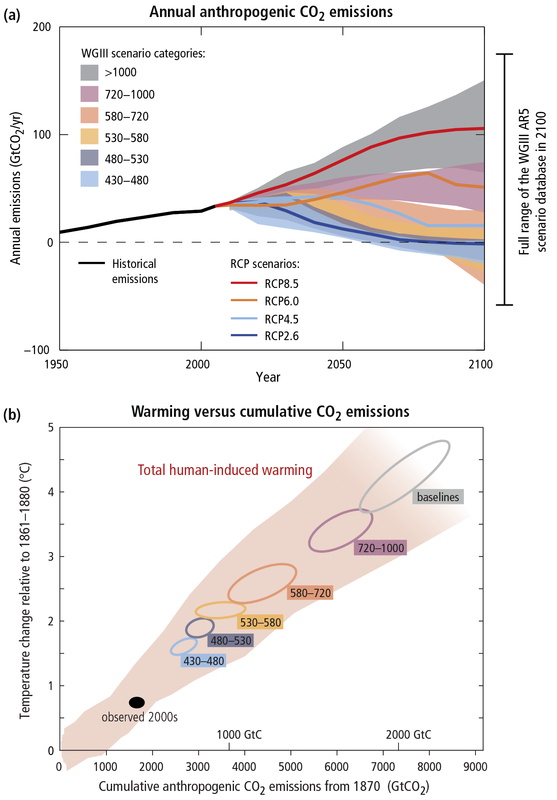 Source: IPCC 2014 In the coming century, even relatively modest global warming may well have devastating consequences for human beings and the species on which we depend. Climate historians have shown that the precise impacts will undoubtedly vary from society to society, and depend much on socioeconomic and technological changes that are, at present, difficult to predict. Predicted advances in biotechnology, artificial intelligence, and energy production, for example, may well transform human vulnerability to climate change. Nevertheless, a warmer world will be a planet less hospitable to human life. The IPCC has published the following map of the ongoing environmental and social consequences of climate change today. If warming temperatures have already had profound global consequences, what will our future have in store? 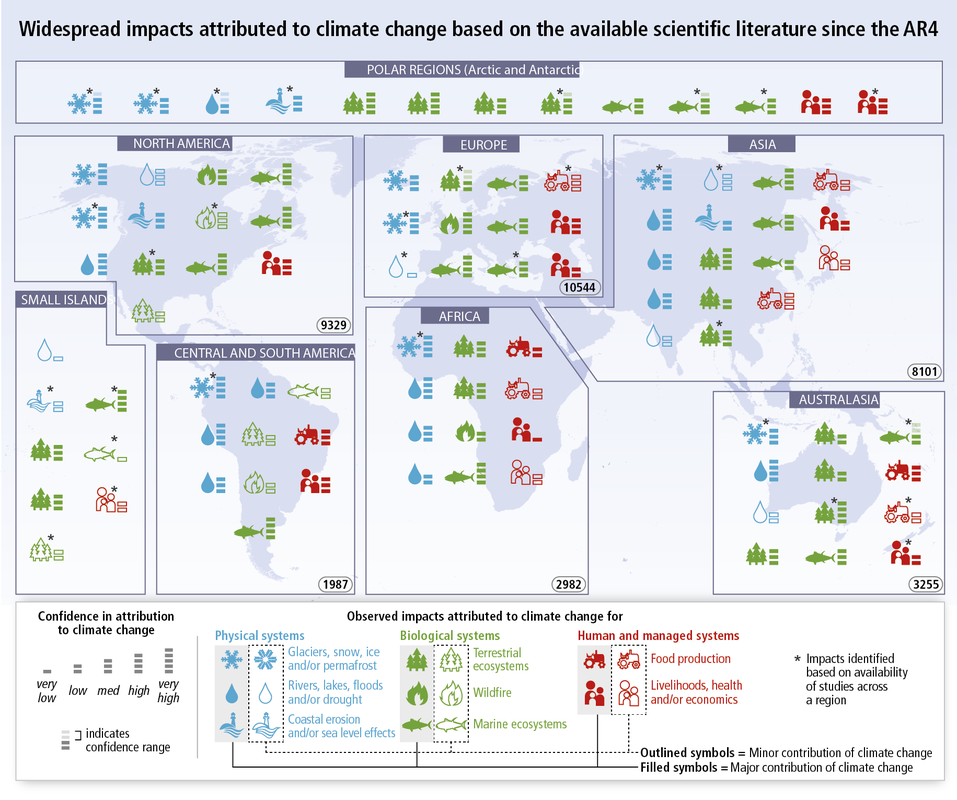 Source: IPCC 2014 At COP21, international delegates have a chance to take the tough action that will let us avoid a future of climate change catastrophe. However, they will be under enormous pressure to avoid politically damaging agreements now. The warmer future, after all, still feels far off. Yet, in many respects, it is here already. In a year of wildfires, heat waves, catastrophic storms, and drought-fuelled conflict, the need to combat climate change should never feel more urgent.
~Dagomar Degroot |
Archives
March 2022
Categories
All
|
 RSS Feed