|
Victoria Slonosky, McGill University As readers of HistoricalClimatology.com know, there’s nothing new about observing the weather and worrying about climate change. We are fortunate to have a legacy of hundreds of years of observations bequeathed to us by our scientific forebears. But it is a daunting task to find, catalogue and transcribe this vast trove of past observations, so that we might better understand climate dynamics and high impact weather events. Researchers are increasingly turning to the public for help. McGill University’s DRAW (Data Rescue: Archives and Weather) project is a web-based platform that allows us to ask the public to work with us to rescue weather observations by becoming citizen scientists. 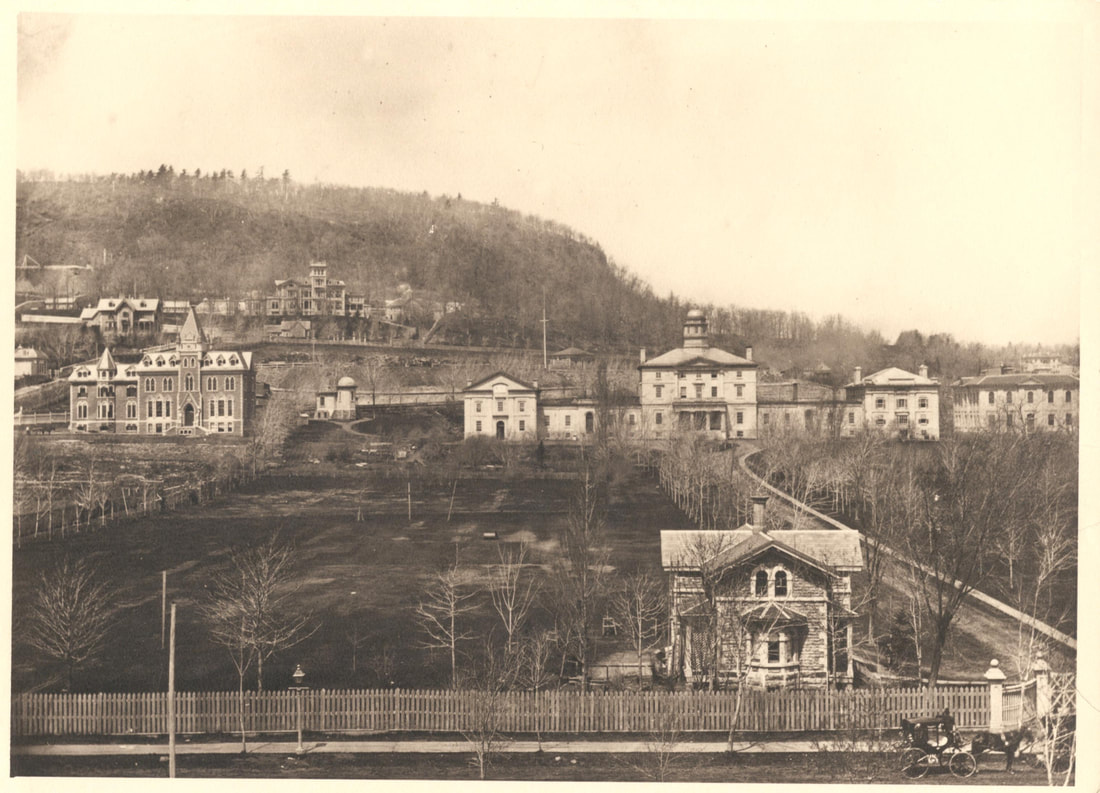 McGill campus circa 1874. The observatory is the small domed structure to the center-left of the photograph, slightly behind the Arts building which dominates the center and right of the photograph. Photograph PR023224 from the McGill University Archives, courtesy of Gordon Burr. Weather observers at the McGill Observatory recorded somewhere between four and nine million weather observations in the century between 1863 and 1963. The ultimate aim of DRAW is to transcribe into machine-readable format the approximately ten thousand pages of weather register books in which these observations were recorded. As the project is taking place in an academic environment, one of the secondary aims is to document a traceable and transparent data rescue process. The team of scholars interested in the DRAW project come from departments and faculties across the McGill campus, and include as key partners McGill’s Library and Archives. Over the course of the project’s existence, archivists, data scientists, information specialists, programmers, meteorologists, historical climatologists, geographers, social scientists, climate change educationalists, and countless students have all contributed their expertise. The key to DRAW is in our web-based transcription app. Image files of the pages of the register books, after being named in a careful sequence to ensure both traceability and provenance, are uploaded to the app. Each register page has been catalogued and given a type number, so that the variables and page layout can be associated to a particular transcription environment. The transcription environment in turn is linked to a relational database, where the transcribed data are stored as they are entered by the citizen scientist transcribers on the app. Our app and transcription environment were also carefully designed and tested to reduce the errors involved in typing in hard-to-read hundred-year-old handwritten observations. It does this by including drop-down select menus for specialized vocabulary, such as cloud type initials, or to capture weather symbols. Our project aims to capture as much of the original information on the page as we can; not just the observations that might be of immediate use as primary climatic variables such as pressure, temperature and precipitation, but everything that was recorded. 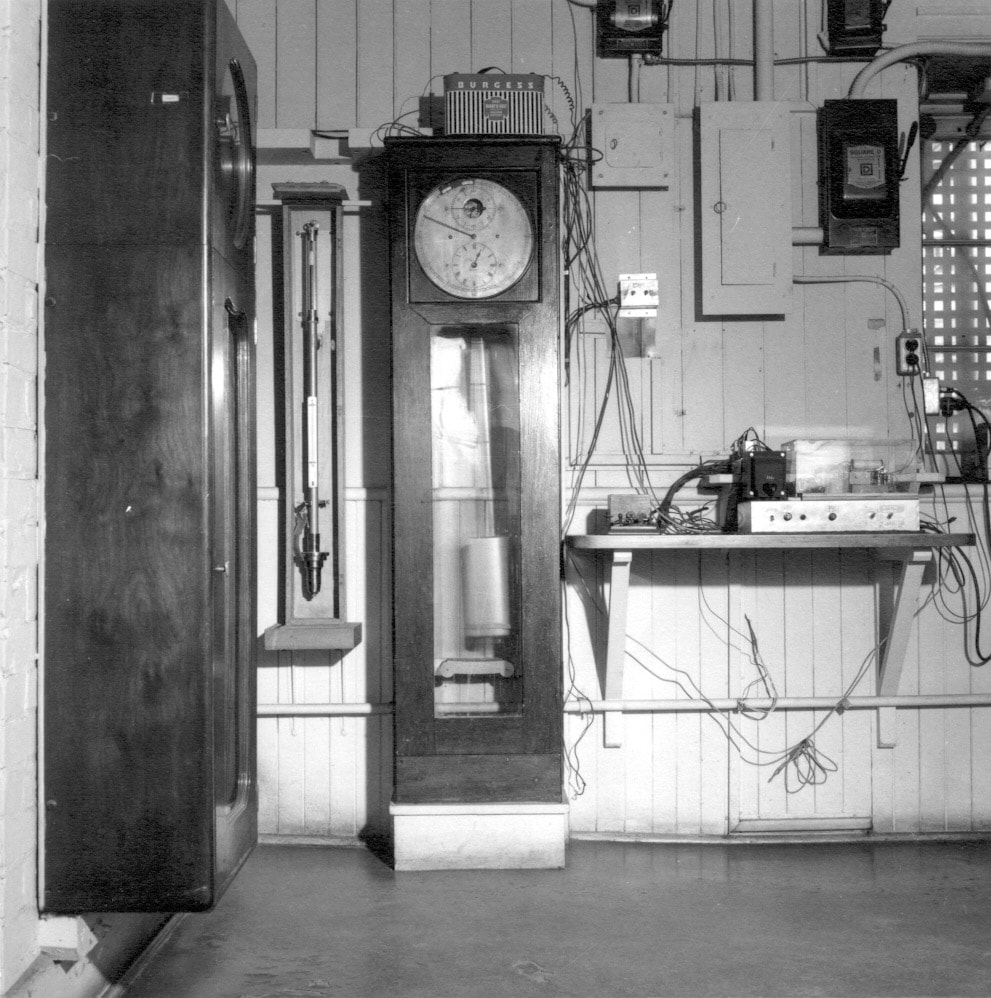 The barometer with attached thermometer is placed to the left of the clock with the associated time relaying equipment in the Observatory. Photograph circa 1963. The observing, maintaining and relying of the time signal for Montreal and points west across North America and even across the Pacific Ocean via telegraph wires, was for most of its existence a major source of income for the McGill Observatory. Photograph PR010550 from the McGill University Archives, courtesy of Lori Podolsky. You might think our range of estimated observations is a large one. Surely we have a better idea than that of how much work we actually have to do? There are a few reasons why we have such a large range, mostly to do with the nature of historical documents and historical observers. Observers often adapted the forms to suit themselves, omitting some variables and adding in others as handwritten notes in the margins. In one case, they recorded the wind speed in an entirely different set of register books, which we haven’t budgeted for scanning and transcribing, and substituted a completely different set of variables — an additional barometer and attached thermometer — in the columns designated for wind speed. We were left with the question of how to communicate to the transcribers that although the column heading says wind speed, the numbers they are transcribing are actually air pressure? Another case, with humidity measurements, appears to be that at the McGill Observatory, as a research institute, a number of different instruments and methods were tried out, leaving behind the somewhat messy records that are the hallmark of a scientific work in progress. As we don’t actually know how many observations there are to transcribe, we’re not actually sure how close we are to finishing the project. We do know how many pages we’ve uploaded and transcribed; with over 1 million transcriptions, we’ve transcribed about 18% of the pages. Some feasibility studies have been done on the data already transcribed, with encouraging results on accuracy and fitness-for-use: an undergraduate student group found an accuracy rate of 96.14%. Another undergraduate study found stimulating findings when comparing historical snowstorms to modern-day snowstorms. By using seldom-transcribed variables such as weather type and wind strength, they were able to adapt storm severity indicators to the historical data and compare past winter storms to current day ones. 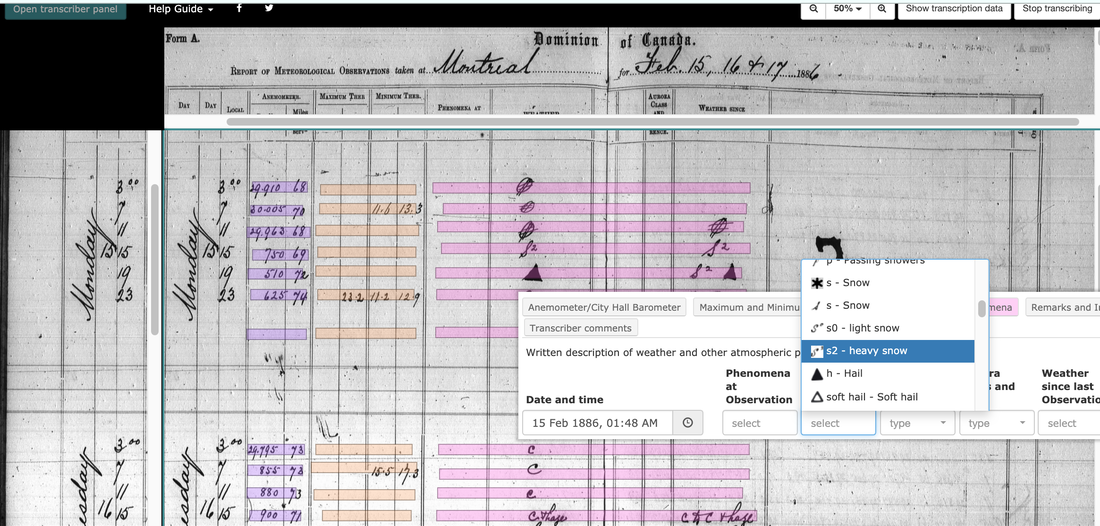 Example of transcribing a page from a weather register on the DRAW app- here we capture weather symbols using drop-down menus, enabling analysis of weather events such as snow storms. Note, on the left, an example of the barometer observations where anemometer (wind) observations should be. The project is mostly volunteer, not only with our citizen scientist volunteer transcribers but also including much of the time contributed behind the app by the McGill team, especially our app programmers. All of the code is archived on GitHub. As with most projects involving historical data rescue, enthusiasm and dedication has helped keep the project humming over several years in the face of what sometimes seems an overwhelming amount of information and a never-ending to-do list. The more we look into library archives and the basements of weather offices, the more weather observations we find. There are billions, possibly even trillions, of historical weather observations in a variety of formats which are not machine readable, making them both vulnerable to loss and inaccessible for scientific analysis. The task of finding, selecting, preparing, scanning, transcribing, processing and exporting the often-handwritten observations into machine-readable data in a traceable process is one that is both formidable and often hidden in the back offices of libraries, archives, national meteorological centers, or increasingly, citizen science apps. Part of what we’re trying to do is to bring not only the observations, but the process behind recovering the observations, to light. Find Us Here: https://citsci.geog.mcgill.ca/ Email: [email protected] Facebook: @DRAWMcGill or DRAW McGill Twitter: @DRAWMcGill #DRAWMcGill Instagram: @draw_mcgill 
107 Comments
|
Archives
August 2021
Categories |
 RSS Feed