|
George Adamson, King's College London When Gilbert Walker codified the Southern Oscillation in the 1920s, he did not define a causal mechanism that could explain weather variability in other parts of the world. Rather, Walker’s Southern Oscillation was the application of a branch of statistics that Walker himself developed, his analysis revealing a co-relationship in pressure between weather stations in the eastern and western Pacific. Walker’s Southern Oscillation wasn’t tied to a particular place – the meteorological stations from which the analysis was taken were in locations as diverse as Cape Town and Southeast Canada – and it had no underlying mechanism, although he tentatively suggested a role for the Pacific Ocean. The first writings on the El Niño likewise offered no underlying mechanism for the phenomenon. In fact, the El Niño was first described not as a periodic movement of warm water across the Pacific, but as an annual warm-water current that occurs off Northern Peru around Christmas, hence El Niño (the Christ Child). Its rarer manifestations, as seen in 1891 and 1925, gained international interest to the extent that the annual El Niño current was largely absent from scientific texts by the 1950s, but the first mechanism suggested for the phenomenon – by German oceanographer Gerhard Schott in 1932 – described it as an intensified manifestation of the annual cycle. These stories draw attention to the importance of history in understanding climate variability and its associated hazards today. Science is too-often presented as a story of linear progress: in this case the discovery in the 1960s by Jacob Bjerknes that the Southern Oscillation and El Niño were manifestations of the same phenomenon (El Niño Southern Oscillation, ENSO), and the eventual development of successful forecasts. Understanding the history of El Niño science, however, reveals a more complex picture. As Greg Cushman has shown, geopolitical interests were as important as their scientific counterparts in driving research in the central Pacific during the Cold War. Bjerknes’s model provided the impetus for new studies of ocean-atmosphere dynamics; it also launched El Niño as a trendy scientific area, bringing in scholars from several disciplines who rebadged their previous research in the process. This accelerated in the 1980s when it was discovered that the central Pacific could be represented in relatively simple models, and that the outputs of these models could inform applications in hazard monitoring and (profitable) commodities forecasting. Media-friendly El Niño events such as 1982-83, 1997-98 and 2015-16 have further increased interest in El Niño/ENSO. Media coverage has helped to cement the idea of El Niño as a bounded climatic entity with almost god-like capacities of global devastation. In the 1980s, El Niño became personified, as years with opposite sea surface temperature anomalies were codified as ‘La Niña’, presenting ENSO as a dualistic entity with both male and female characteristics. Meanwhile, retrospective attempts to quantify El Niño into a single definition in the wake of the 1997-98 event have led to confusion and fragmentation. There is now a growing list of ENSO ‘flavours’, each constituted by characteristic warming and cooling patterns and each apparently distinct from the others. This includes recent suggestions that the atmospheric Southern Oscillation may sometimes act independently of the ocean (the ‘thermally coupled Walker mode’), and that tropical Pacific ocean variability may not be coupled with changes in the atmosphere (‘uncoupled warming’). The implications of this fragmentation were shown starkly in 2017, when heavy flooding hit northern Peru. That year, while Peru’s coast experienced the ocean warming characteristic of El Niño, no similar changes occurred in the central Pacific, confounding recent definitions. The absence of a forecast ‘El Niño’ that year is one reason for the devastation caused by the flooding, particularly as the ‘severe’ El Niño one year prior had not brought the expected rainfall. The event was later codified as a ‘coastal’ El Niño. Subsequent historical work in historical climatology has suggested that the 1891 and 1925 events may also have been coastal. Hence the incidents that precipitated global research on El Niño would not have been classified as such 100 years later. All of this demonstrates the importance of taking a historical approach. The concept of ENSO as a single entity characterised by variability in the central Pacific may seem self-evident to those whose first exposure to El Niño was on the news in 1998, but historical context shows that the phenomenon has had several meanings, and that today’s singular El Niño was shaped as much by scientific culture as by scientific evidence. Moreover, history reveals the continued importance of geopolitics in understanding climate risk. The fact that El Niño is now associated with the central rather than eastern Pacific was driven in part by that region’s importance in regulating weather over north America. This change in definition was undoubtedly influenced by the dominance of the U.S. National Oceanic and Atmospheric Administration over global understanding of ENSO, obscuring other readings of the phenomenon, including the annual El Niño still anticipated by north Peruvian fishermen each year around Christmas.
It is possible that future scientific research will indeed show ENSO to be a single phenomenon, proving that all flavours of ENSO – including the coast El Niño – are related to a single underlying dynamical process. But in the meantime, it is important to be mindful of ENSO’s historical complexities. Scientific phenomena that seem self-evident rarely are so, and understanding their political history is as important as appreciating the advances of previous generations of scientists. Finally, this brief account draws attention to the importance of historical climatology as a discipline. Whereas other disciplines tend to be specific to the physical or social sciences or humanities, historical climatology combines an appreciation of positivist science with an attentiveness to history and culture. Approaching an issue as complex as climate science – and particularly climate change – from such an inherently interdisciplinary lens can illuminate problems in a fairly unique and important way, as ENSO’s complicated history shows.
195 Comments
Victoria Slonosky, McGill University As readers of HistoricalClimatology.com know, there’s nothing new about observing the weather and worrying about climate change. We are fortunate to have a legacy of hundreds of years of observations bequeathed to us by our scientific forebears. But it is a daunting task to find, catalogue and transcribe this vast trove of past observations, so that we might better understand climate dynamics and high impact weather events. Researchers are increasingly turning to the public for help. McGill University’s DRAW (Data Rescue: Archives and Weather) project is a web-based platform that allows us to ask the public to work with us to rescue weather observations by becoming citizen scientists. Weather observers at the McGill Observatory recorded somewhere between four and nine million weather observations in the century between 1863 and 1963. The ultimate aim of DRAW is to transcribe into machine-readable format the approximately ten thousand pages of weather register books in which these observations were recorded. As the project is taking place in an academic environment, one of the secondary aims is to document a traceable and transparent data rescue process. The team of scholars interested in the DRAW project come from departments and faculties across the McGill campus, and include as key partners McGill’s Library and Archives. Over the course of the project’s existence, archivists, data scientists, information specialists, programmers, meteorologists, historical climatologists, geographers, social scientists, climate change educationalists, and countless students have all contributed their expertise. The key to DRAW is in our web-based transcription app. Image files of the pages of the register books, after being named in a careful sequence to ensure both traceability and provenance, are uploaded to the app. Each register page has been catalogued and given a type number, so that the variables and page layout can be associated to a particular transcription environment. The transcription environment in turn is linked to a relational database, where the transcribed data are stored as they are entered by the citizen scientist transcribers on the app. Our app and transcription environment were also carefully designed and tested to reduce the errors involved in typing in hard-to-read hundred-year-old handwritten observations. It does this by including drop-down select menus for specialized vocabulary, such as cloud type initials, or to capture weather symbols. Our project aims to capture as much of the original information on the page as we can; not just the observations that might be of immediate use as primary climatic variables such as pressure, temperature and precipitation, but everything that was recorded.  The barometer with attached thermometer is placed to the left of the clock with the associated time relaying equipment in the Observatory. Photograph circa 1963. The observing, maintaining and relying of the time signal for Montreal and points west across North America and even across the Pacific Ocean via telegraph wires, was for most of its existence a major source of income for the McGill Observatory. Photograph PR010550 from the McGill University Archives, courtesy of Lori Podolsky. You might think our range of estimated observations is a large one. Surely we have a better idea than that of how much work we actually have to do? There are a few reasons why we have such a large range, mostly to do with the nature of historical documents and historical observers. Observers often adapted the forms to suit themselves, omitting some variables and adding in others as handwritten notes in the margins. In one case, they recorded the wind speed in an entirely different set of register books, which we haven’t budgeted for scanning and transcribing, and substituted a completely different set of variables — an additional barometer and attached thermometer — in the columns designated for wind speed. We were left with the question of how to communicate to the transcribers that although the column heading says wind speed, the numbers they are transcribing are actually air pressure? Another case, with humidity measurements, appears to be that at the McGill Observatory, as a research institute, a number of different instruments and methods were tried out, leaving behind the somewhat messy records that are the hallmark of a scientific work in progress. As we don’t actually know how many observations there are to transcribe, we’re not actually sure how close we are to finishing the project. We do know how many pages we’ve uploaded and transcribed; with over 1 million transcriptions, we’ve transcribed about 18% of the pages. Some feasibility studies have been done on the data already transcribed, with encouraging results on accuracy and fitness-for-use: an undergraduate student group found an accuracy rate of 96.14%. Another undergraduate study found stimulating findings when comparing historical snowstorms to modern-day snowstorms. By using seldom-transcribed variables such as weather type and wind strength, they were able to adapt storm severity indicators to the historical data and compare past winter storms to current day ones. The project is mostly volunteer, not only with our citizen scientist volunteer transcribers but also including much of the time contributed behind the app by the McGill team, especially our app programmers. All of the code is archived on GitHub. As with most projects involving historical data rescue, enthusiasm and dedication has helped keep the project humming over several years in the face of what sometimes seems an overwhelming amount of information and a never-ending to-do list. The more we look into library archives and the basements of weather offices, the more weather observations we find. There are billions, possibly even trillions, of historical weather observations in a variety of formats which are not machine readable, making them both vulnerable to loss and inaccessible for scientific analysis. The task of finding, selecting, preparing, scanning, transcribing, processing and exporting the often-handwritten observations into machine-readable data in a traceable process is one that is both formidable and often hidden in the back offices of libraries, archives, national meteorological centers, or increasingly, citizen science apps. Part of what we’re trying to do is to bring not only the observations, but the process behind recovering the observations, to light. Find Us Here:
https://citsci.geog.mcgill.ca/ Email: [email protected] Facebook: @DRAWMcGill or DRAW McGill Twitter: @DRAWMcGill #DRAWMcGill Instagram: @draw_mcgill Ruth Mostern, University of Pittsburgh A river is not simply a tidy channel of water traversing dry land. It is a complex system that carries organic and mineral material out of higher altitude locations and deposits them on a floodplain or estuary.[1] The Yellow River, situated near the northern perimeter of the East Asia Summer Monsoon, is currently the most sediment laden river in the world. It carries sediment from the Loess Plateau, located primarily northwestern China, and deposits it on the North China Plain. The process of sediment deposition, which accelerated during historical times, increased by an order of magnitude about a thousand years ago and continued to rise thereafter. Whenever Loess Plateau population became denser and settlements became more numerous, especially on the most fragile and arid northern periphery of the region, erosion increased. That transpired primarily in periodic events of settler colonialism and military fortification. Whenever people began to exploit the Loess Plateau more intensively, the alluvial plain grew more prone to flooding, and hydroengineering interventions became more critical. Historically, decadal and centennial climate variations, and even annual weather variations, rarely correlate to flood rates. That is because human activity (upstream farming and settlement, and downstream flood control initiatives) had such an overwhelming influence on flood frequency. However, climate history is indirectly important for understanding Yellow River history, because climate variations strongly influenced geopolitics on the Loess Plateau, and climate variations shaped the range of possibilities available to generals, colonists, and denizens there. During moist years, populations grew and spread out, landscapes supported settlers and soldiers alike, and farming, grazing, and timbering accelerated erosion. During droughts, farmers, herders, hunters, and animals crowded onto smaller habitable territories. The resulting social friction caused political conflict and prompted fortification, but on the other hand, dry conditions constrained populations and the erosion that they caused. In short, although climate history is significant, it does not determine any single outcome in the history of the Yellow River at the scale of the longue durée. For example, as Figure 4 reveals, much of the Tang era (618-907 CE) transpired during a period of extremely dry climate. There is no direct causal link between drought and the stability of nomadic societies, but drought conditions plausibly explain why various steppe and Tibetan states sought to take sides in the massive 755 An Lushan Rebellion and how they played a role in the series of events that caused sovereignty in north China to splinter between competing warlords and rival claimants for imperial thrones thereafter.[4] The middle and upper courses of the Yellow River became sites of frequent battles, repeated fortification initiatives, refugee migrations, and competing waves of military and civilian colonization. Erosion began to rise rapidly. Conversely, moist conditions on the Loess Plateau were also politically destabilizing at times. In 960, near the beginning of a lengthy moist period, a new regime known as the Song (960-1276) unified much of former Tang territory. The Song rulers did not succeed in recolonizing the northwestern part of the Loess Plateau. That region remained in the hands of a rival people, the Tanguts, who established a regime known as the Xi Xia (1038-1227) and founded a capital on the banks of the Yellow River. Climate conditions permitted both sides to settlements at an unprecedented density. Hundreds of thousands of troops and allied civilians on both sides of the border confronted one another across a heavily fortified frontier. A commercial timber market arose around the same time. This, too, created conditions that caused erosion to rise exponentially. The Song regime lost control of north China in 1127, during a time of rapidly fluctuating moist and arid cycles. For more than two centuries thereafter, the entire Yellow River basin lay in the hands of sovereigns who did not fortify a border on the Loess Plateau and who did not encourage intensive agriculture there. For reasons of geopolitics, and not climate, erosion rates diminished. However, the next episode of rising erosion implicated climate once again. Deep and lengthy drought during the second half of the fifteenth century upended politics on the Loess Plateau. By the middle of the century, Mongol detachments had moved into the region: mounted warriors, but also groups of herders seeking water and pasture during an era of scarcity. At the Chinese Ming court, advocates for a fortification strategy spoke of fertile fields, rich soil, and abundant salt lakes that still persisted on the Loess Plateau. They succeeded in fostering a policy of building garrisons and moving in settler colonist farmers even in the midst of the drought. This was the origin of the well-known Great Wall. The demands of military colonization outstripped the carrying capacity of the land even when rainfall was good. A century later, even though precipitation was above average, the region along the military frontier deteriorated into desert. One observer attributed this to deforestation that resulted from farming, firewood collection, and brick making to repair the wall and to construct new buildings.[5] Environmental scientist Jianxin Cui and his coauthors assert that climate played the primary role in desertification and the Ming retreat from the frontier.[6] However, fluctuations in precipitation do not match neatly to historical records that report about landscape deterioration nor to the history of civilian and military colonization. For many decades, the predominant factor in the Ming retreat from the desert edge was intensive human exploitation of an agriculturally marginal landscape. Ultimately, however, catastrophic drought did contribute to the desertification that shuttered the most northerly settlements and garrisons in the early seventeenth century. Between 1566 and 1620, yields on military farms dropped by 60 to 70 percent. As the loess environment deteriorated, soldiers began to flee or mutiny, and civilian farmers rebelled as well.[7] After the fall of the Ming regime, when populations rebounded with moist climate conditions in the eighteenth century, they were civilian farmers incentivized by favorable tax policies whose farming and timbering caused erosion to increase once again. It is possible to tell a climate story about the last fifteen hundred years of Yellow River history, where wet and arid conditions succeeded one another at the monsoon periphery. However, that history does not map neatly onto the narrative of erosion on the Loess Plateau. It explains flooding on the alluvial plain even less well. Erosion sometimes accelerated during arid epochs that fostered political conflict over access to the grasslands and forests of the region. It also rose during certain moist periods that supported large populations of farmers, herders, and lumbermen. The history of the Yellow River is an exemplary case for understanding the complexity of climate history. [1] This article is adapted from my forthcoming book Yu’s Traces: The Natural and Unnatural History of the Yellow River (Yale University Press, 2021). Thank you to Ryan M. Horne for his assistance with data analysis and cartography and infographic design.
[2] Shi Changxiang, Zhang Dian and Lianyuan You, “Changes in Sediment Yield of the Yellow River Basin of China During the Holocene,” Geomorphology 46.3-4 (2002), 267-283. [3] Cook, E.R., K.J. Anchukaitis, B.M. Buckley, R.D. D'Arrigo, G.C. Jacoby, and W.E. Wright, “Asian Monsoon Failure and Megadrought during the Last Millennium. Science, 328 (2010), 486-489. (Monsoon Asia Drought Atlas) [http://drought.memphis.edu/MADA/Default.aspx]. Thank you to Amy Hessl for communicating with me about this data and for agreeing to share it with me. [4] Nicola Di Cosmo, Amy Hessl, Caroline Leland, Oyunsanaa Byambasuren, “Environmental Stress and Steppe Nomads: Rethinking the History of the Uyghur Empire (744-840) with Paleoclimate Data,” The Journal of Interdisciplinary History 48.4 (2018), 439-463. [5] Gu Zuyu et al., Dushi fangyu jiyao (Beijing: Zhonghua shuju, 2019 [1630-1660]), j. 61. [6] Jianxin Cui, Hong Chang, Kaiyue Cheng and George Burr, “Climate Change, Desertification and Societal Responses,” Weather, Climate, and Society 9.1 (2017), 81-94: 81. [7] Cui et al, “Climate Change, Desertification and Societal Responses,” 91. Martin Bauch, Leibniz Institute for the History and Culture of Eastern Europe (GWZO), Leipzig Thomas Labbé, Leibniz Institute for the History and Culture of Eastern Europe (GWZO), Leipzig, Maison des Sciences de l’Homme de Dijon, Dijon Annabell Engel, Leibniz Institute for the History and Culture of Eastern Europe (GWZO), Leipzig Patric Seifert, Leibniz Institute for Tropospheric Research (TROPOS), Leipzig Recently coined the “1310s event” (Slavin 2018), the wet anomaly of the 1310s has attracted a lot of attention from scholars, who commonly interpret it as a signal of the transition between the warmer Medieval Climate Anomaly to the chilly Little Ice Age in Europe (Campbell 2016). Despite the fact that current worries about global warming have led scholars of premodern climate history to pay increasing attention to drought events (Wetter et al. 2014; Brázdil et al. 2019; Brázdil et al. 2018; on the Middle Ages, Rohr et al. 2018), the subject remains in its infancy. Focusing on dry anomalies in the early fourteenth century, a distinctive “1300s event” set in opposition to the wet 1310s is detectable. It is therefore time to examine this meteorological anomaly, and we have recently done so, aiming to understand its meteorological, economic and social features (Bauch et al., 2020). Our study proposes a reconstruction of the drought-period for three different regions: central and northern Italy, eastern France, and central Europe, and strives to identify the underlying meteorological pattern. It then highlights the diverse socio-economic impacts of this event on medieval societies. Reconstructing the Drought of 1302–1307 The reconstruction of semi-annual precipitation indices on the basis of narrative sources (Fig. 1, for methodology, see Bauch et al. 2020) suggests a sustained dry period in Italy that lasted nearly two years, from the growing season of 1302 until the non-growing season of 1303/4. The precipitation indices for France are generally quite scarce, and yet they show a pronounced drought pattern in the growing seasons of 1304-1306. In central Europe, the indices show drought in the growing seasons of 1304 and 1307, whereas data from written sources for the seasons in between, which according to the Old World Drought Atlas (OWDA) were especially dry, is practically non-existent. While our reconstructions generally correspond quite well with the Palmer Drought Severity Index (PDSI) taken from the OWDA (Fig. 1), the congruence is less convincing in the case of Italy, where only a handful of dendrochronological series from the Alps and Calabria are available. These discrepancies show that a validation and refinement of climate reconstruction derived from proxy data by means of careful critical analysis of written historical sources is worthwhile, especially concerning the chronology of extreme events. Underlying Meteorological Patterns In fact, narrative sources give access to a more detailed picture of the meteorological conditions prevailing in Europe between 1302 and 1307, including a remarkable feature evident in Figure 2. Our analysis of written documentation (chronicles, charters, roll accounts) reveals inverse trends in southern Europe (Italy) and Europe north of the Alps (France and central Europe). While Italy witnessed two successive dry summers in 1302 and 1303, France and central Europe experienced wet, cold conditions that even led to floods in the summer of 1302. On the other hand, these regions to the north witnessed very dry and hot anomalies from 1304 to 1307, while conditions south of the Alps in Italy were normal in 1304, 1306, and 1307, or even abnormally rainy in the summer of 1305. The documentary data indeed suggest the occurrence of an alternating large-scale weather pattern over large parts of Europe between 1300 and 1310: a water (or more precisely: precipitation) seesaw, as it was recently discussed by Toreti et al. (2019) concerning the drought events of 2018 and others of the last 500 years. This phenomenon describes a remarkable dipole of negative precipitation anomalies over one part of Europe and positive ones over another part of the continent. The 2018 drought has been associated with pronounced positive anomalies in the geopotential height of the 500-hPa level of atmospheric pressure over the continental European landmass north of the Alps. This blocking situation led to the formation of low-pressure anomalies over both northern and southern Europe, with resulting precipitation patterns such that central Europe suffered a severe lack of precipitation whereas northern and southern Europe experienced an excess of precipitation. Thus, in the 2018 case, the water seesaw was positive over southern Europe and negative over central Europe. Similar to what was reported by Toreti et al. (2019), the predominant weather patterns found for the period from 1302 to 1307 must have likewise originated from certain seesaw constellations and associated patterns in the geopotential height fields. Because such droughts spanning multiple seasons and several regions did not occur during the thirteenth century and did not occur again during the fourteenth until 1360–1362, it is possible to interpret these uncommon conditions, combined with the 1310s wet anomaly, as part of the climatic transition from the MCA to the LIA. The dry anomaly characterizing the “1300s event” can be seen as the starting point of the LIA and the changing meteorological patterns of this period. Impact / Responses to Drought and Water Scarcity It is often presumed that periods of drought were unproblematic or even beneficial for the subsistence of western Europeans in the Middle Ages. While it is true that cereals and wine harvests were not heavily endangered by droughts, other difficulties did arise in such periods, especially problems of access to water. In 1303, for example, the city of Parma had to dig a new well, larger and deeper than before (Bonazzi, 1902, 86). The Tuscan city of Siena, situated far from any larger bodies of water, took similar measures: city councilors authorized digging in a local church in an attempt to find a mythological underground waterway, the so-called Diana, in April 1305, one year after the end of the drought (Bargagli Petrucci, 1903, II, 20). In addition, water shortages were often associated with the spread of contagious diseases via contaminated water sources (Pribyl 2017), as happened in Paris in 1307 (Buchon, 1827). Another side effect of prolonged major droughts in the fourteenth century was the temporary disruption of production—and sometimes even of communication routes—that relied on rivers. The lack of water power made it difficult to mill grain into flour and to transport foodstuffs from the regions of production to city markets. These challenges could have economic consequences, as it was the case in Alsace in 1304 and 1305, where although the grain and wine harvests were plentiful in these years, the prices of bread and wine actually went up (Jaffe, 1861). Finally, a higher risk of city fires was certainly the most dangerous consequence of long-lasting droughts. A peak in urban fires during the 1302–1305 drought is visible, for example, in Italy, as well as in France in 1306. Altogether, the consequences of the 1302–1307 dry period were certainly not negligible across Europe. A detailed analysis comparable to that conducted on the 1540 mega-drought (Wetter et al. 2014) is evidently not possible due to the lack of sources, but the “1300s event” certainly holds more questions to be answered and deserves more attention among historians of climate, due both to the pronounced climatological patterns and its probable significant social impact on European societies in the decades preceding the Black Death. References: Bargagli-Petrucci, F., Le Fonti di Siena e il loro acquedotti. Note storiche dalle origini fino al MDLV, Vol. II, Documenti, Siena, Leo S. Olschki, 1906.
Bauch, M., Labbé, T., Engel, A., and Seifert, P., “A Prequel to the Dantean Anomaly: The Water Seesaw and Droughts of 1302–1307 in Europe,” Clim. Past Discuss., https://doi.org/10.5194/cp-2020-34, forthcoming, 2020. Bonazzi, G. (ed.), Chronicon Parmense. Ab Anno MXXXVIII usque ad Annum MCCCXXXVIII., Rerum Italicarum Scriptores (RIS²), 9/9, Città di Castello, Lapi, 1902. Brázdil, R., Kiss, A., Luterbacher, J., Nash, D. J., Řezníčková, L., “Documentary Data and the Study of Past Droughts: A Global State of the Art,” Clim. Past, 14, 2018, p. 1915–1960, doi.org/10.5194/cp-14-1915-. Brázdil, R., Kiss, A., Řezníčková, L., Barriendos, M., “Droughts in Historical Times in Europe, as Derived from Documentary Evidence,” Herget, J. and Fontana, A. (eds), Paleaohydrology: Traces, Tracks and Trails of Extreme Events, Cham, Springer, 2019, p. 65–96. Buchon, J. A. (ed.), Chronique métrique de Godefroy de Paris, suivie de la taille de Paris en 1313, Collection des chroniques nationales françaises, 9, Paris, Verdière, 1827, p. 1–304. Campbell, B., The Great Transition: Climate, Disease and Society in the Late-Medieval World, Cambridge, Cambridge University Press, 2016. Jaffé, P. (ed.), “Annales Colmarienses maiores a. 1277-1472,” Monumenta Germaniae Historica, Scriptores, 17, Hannover, 1861, p. 202–232. Pribyl, K., Farming, Famine and Plague: The Impact of Climate in Late Medieval England, Cham, Springer, 2017. Rohr, C., Camenisch, C., and Pribyl, K., “European Middle Ages,” in White, S., Pfister, C., and Mauelshagen, F. (eds.), The Palgrave Handbook of Climate History, London, Palgrave Macmillan, 2018, p. 247–263. Slavin, Ph., “The 1310s event,” in White, S., Pfister, C., and Mauelshagen, F. (eds.), The Palgrave Handbook for Climate History, London, Palgrave McMillan, 2018, p. 495–515. Toreti, A., Belward, A., Perez‐Dominguez, I., Naumann, G., Luterbacher, J., Cronie, O., Seguini, L., Manfron, G., Lopez‐Lozano, R., Baruth, B., Berg, M., Dentener, F., Ceglar, A., Chatzopoulos, T., and Zampieri, M., “The Exceptional 2018 European Water Seesaw Calls for Action on Adaptation,” Earth's Future, 7, 2019, p. 652–663, doi:10.1029/2019EF001170. Wetter, O., Pfister, C., Werner, J.P., Zorita, E., Wagner, S., Seneviratne, S.I., Herget, J., Grünewald, U., Luterbacher, J., Alcoforado, M.J., Barriendos, M., Bieber, U., Brázdil, R., Burmeister, K.H., Camenisch, C., Contino, A., Dobrovolný, P., Glaser, R., Himmelsbach, I., Kiss, A., Kotyza, O., Labbé, T., Limanówka, D., Litzenburger, L., Nordli, Ø., Pribyl, K., Retsö, D., Riemann, D., Rohr, C., Siegfried, W., Söderberg, J., Spring, J.L., “The year-long unprecedented European heat and drought of 1540 – a worst case,” Clim Chang., 125, 2014, p. 349–363, doi:10.1007/s10584-014-1184-2. Zak Baillie, Fenner School of Environment & Society, Australian National University Dr Joëlle Gergis, Fenner School of Environment & Society, Australian National University Australia is a land characterised by dramatic climate and weather extremes. Currently, our understanding of the nation’s climatic history is mostly confined to official records kept by the Australian Bureau of Meteorology that begin in 1900, despite the fact that observations are available from first European settlement of Australia in 1788. Colonial weather observations taken by government officials, farmers, doctors and weather enthusiasts– sometimes as often as five times a day – provide unparalleled opportunities to investigate past climate variability and extremes. The frequency and detail of these historical weather observations provide researchers with an exceptional record of Australia’s pre-1900 climate variability and its impact on past societies. In Europe there is a long tradition of using historical records to reconstruct weather and climate, though in Australia these sources of climate history have been relatively untapped. In 2008, the South Eastern Australian Recent Climate History (SEARCH) project, developed and led by Joëlle Gergis, aimed to address this. It assembled an interdisciplinary team of climate scientists and historians to better understand Australia’s pre-1900 natural climate variability. The SEARCH project was of global importance because so few historical instrumental records are located in the Southern Hemisphere. This makes extending the scientific understanding of long-term climate variability in the Australian region a high priority for international data recovery efforts. While the SEARCH project uncovered climate history long forgotten, it also laid important foundations for translating what Australia’s climate history might tell us about its future. This is the primary focus of our new initiative, Climate History Australia. When it comes to climate change, Australia is the most vulnerable developed nation in the world. Nonetheless, assessment of climate risk is primarily derived from weather observations that begin in 1900. Climate History Australia aims to improve the assessment of future climate change risk by extending records of natural climate variability and weather extremes using pre-20th century sources. Historical records from the 18th and 19th centuries provide a detailed picture of Australia’s pre-industrial climate before instrumental observations become influenced by global warming. This provides a unique opportunity to examine weather extremes produced purely by natural variability for comparison with recently observed variability and extremes. For example, our team recently published Australia’s longest daily temperature record beginning in 1838. This record from Adelaide in South Australia revealed a string of severe heatwaves and cold extremes, including rare snowfall events. One weather extreme of particular note was a heatwave that occurred in January 1858 that produced at least five consecutive days of temperatures greater than 40 ℃. Such an event would be newsworthy today, and a scan through the historical newspapers of the time reveal that it was very remarkable in the 1850s: Ordinarily we should leave it to a meteorological journal to chronicle the range of the thermometer and the moisture of the atmosphere just as the majority of persons would leave to meteorological observers the task of ascertaining such particulars. But when the heat has been so intense as to become the principal topic of conversation in every circle, and so persistent as to excite very general uneasiness and alarm, it forces itself upon the notice of the newspaper writer, and compels him to regard its influences as among the most important of passing affairs. - Adelaide Observer, 6 February 1858 In fact, even in Adelaide’s modern climate record there have only been three other instances of five or more consecutive days above 40 ℃ (1908, 2009 and 2014). Many news stories detailing the 1858 heatwave detailed tales of people dying from extreme heat: Within the last week the mortality has been frightful in the extreme. Young children have been sufferers to a great extent; no less than nineteen… were the day before yesterday buried in the cemetery. But it has not been confined to them; hale men have been struck down by the effects of the sun, in other words by a coup de soleil. - Adelaide Times, 30 January 1858 As contemporary climate researchers we are interested in asking: what if the same heatwave occurred today when global temperatures are now around 1.1 ℃ warmer than they were in 1858? Or, perhaps more importantly: what if that same heatwave occurs when global temperatures are 2 ℃, 3 ℃ or even 4 ℃ warmer than what they were in 1858? To answer these questions, we are combining state-of-the-art global climate models and various historical observations to quantify likely changes in Southern Hemisphere circulation patterns and associated climate and weather extremes. By estimating and modelling the impacts of past extremes only using post-1900 weather observations, Australia is very likely to be underestimating our climate risk. This would be devastating for a country that is already highly exposed to climate change. So far, we’ve focused our efforts on recovering high priority historical datasets that will become the longest daily weather records available from the Southern Hemisphere. These include weather journals from Perth in Western Australia that begin in 1830. There is another effort to fill a gap in the recently published daily record for Adelaide in South Australia starting in 1838.
To digitise these records, scans of the weather journals are uploaded to the citizen science platform Zooniverse for volunteers to transcribe. Zooniverse has proven to be an invaluable resource for weather data rescue activities. For example, a project led by Ed Hawkins from the University of Reading saw more than 16,000 volunteers digitise 5.25 million individual weather observations in only a few weeks – a Zooniverse record for participation in a project. So far, the Climate History Australia pilot project has attracted 731 volunteers who have transcribed 12,721 weather observations – a promising start for an overlooked region! Once complete, these records will be continuous sub-daily datasets, providing a treasure trove for the study of Southern Hemisphere climate variability and extremes. Importantly, they will fill crucial data gaps in global datasets, improving the reliability of historical climate analysis. This will help improve future climate change risk assessment in regions like Australia that are highly exposed to weather and climate extremes. This will be all the more important as the planet continues to warm. Liza Piper, University of Alberta Times of hunger and starvation were part of life for northern Indigenous peoples. Dene, Inuvialuit, and Gwich’in shared lessons about planning to avoid starvation, the need to show proper respect and gratitude for good hunts and successful fishing, and how to eat after a period of hunger.[1] These ancient stories were essential education for subsistence that relied on migratory creatures (caribou, birds), animals that experienced cyclical population crashes (lynx, marten, Arctic hare), and others sensitive to weather and water conditions (beaver, muskrat). It took great skill and expertise, rooted in generations of experience on the land—knowledge in place in deep time—as well as some luck, to live off and with the land along the Mackenzie and Yukon rivers in the nineteenth century. In the late 1880s, fortune failed and starvation came. The winter of 1887-88 was exceptionally cold: Hunters who traded at forts Providence and Liard in the Mackenzie district found beavers dead in their lodges. In these regions, beavers survived long winters by building up fat in their tails before the onset of cold and then eating saplings they stored below the ice. In a long winter, with deep freezes, beavers starved.[2] Fur returns were poor that year, made worse by scarce marten. There were also ominous reports that there were no “rabbits” (mostly snared for food) to be found.[3] The cyclical crashing of hare populations, followed by the abrupt declines in their predators—marten, lynx, and sometimes foxes—was underway. Early in the winter there had been some hunger but thankfully the snow was deep and the moose numerous; with successful hunts, hunger soon abated. If the winter of 1887-88 was exceptionally cold, the next year was even worse: “the hardest winter in 30 years” according to the Hudson’s Bay Company district chief Julian Camsell.[4] The temperature record preserved at Fort Good Hope shows that it was not extreme cold that made the winter so bad, but rather the dramatic fluctuations in temperature, followed by a deep-freeze in February. The bad weather had started with a “summer of rain” as Oblate missionary Jean Séguin wrote from Fort Good Hope.[5] The winter saw “frequent thaws and very little snow,” which made it impossible to hunt larger game animals -- caribou and moose.[6] The climatic conditions were then joined to the cyclical collapse of marten, rabbit, and lynx populations and the absence of caribou from some of their normal routes.[7] In the winter of 1888-89, people across the Mackenzie district had to rely on fisheries and provisions (mostly dried fish, but also dried meat and flour). Fort Simpson sent ten sled loads of provisions to nearby Fort Wrigley. After January the Company's servants at Simpson were “reduced ...to eat the furs in store.”[8] By spring the stores were empty. In reports to his superior, Camsell detailed “the privations and hardships experienced …during the past winter,” which saw forty-seven deaths across the district attributed to starvation.[9] This was by far the greatest mortality from that cause in any year in the late nineteenth or twentieth centuries. Climate and climate history are foundational to the colonial histories of the lands along the Mackenzie and Yukon rivers. Nineteenth-century climate discourses shaped perceptions of the desirability of northern environments for colonization. Twentieth-century climate discourses shaped the willingness of Canadian governments to provide in situ health care, rather than relocating sick northerners to southern institutions. Climate governed the possibility to extend the temperate agricultural systems that were integral to settler colonialism elsewhere in Canada. The limitations of agriculture along the Mackenzie and Yukon rivers profoundly shaped the character of northern colonialism, not least by feeding an intense anxiety among colonizers as to their own prospects for good health and survival in northern places. The trade networks that flourished early on and served as a foundation for colonial relations, adapted to the annual break-up and freeze-up of waterways – the opening and closing of the region to the south. This created rhythms in the long-distance movement of people, goods, and pathogens that endured into the 1950s. And, through all of this, technologies for meteorological investigation accompanied explorers, scientists, missionaries and traders. The North was essential to the network of national (and international) meteorological observatories erected from the mid-nineteenth century onward, used to acclimatize colonizers to the ‘new worlds’ they sought to claim. The network of instrumental temperature observations (that dates back to the 1880s) also facilitates historical research into the role of weather, climate, and climate changes in shaping good and ill-health during this period of colonisation. It shows, for instance, that while the winter of 1887-88 was exceptionally cold, it was the temperature fluctuations the following year, alongside independent variation in animal populations, that made for Camsell’s “hardest winter.” There is nothing simple or straightforward, that is, about weather or climate descriptions in this period. Just as Mary Black Rogers’ classic essay on ‘starvation’ demonstrated the instability of this word and its many meanings in the fur trade, so too “extreme cold” and “harsh winter” have to be situated in their colonial context in order to be understood.[10] Exceptional weather brought dire hunger in the winter of 1888-89 and with it the first prolonged discussion among missionaries, traders, government agents about their responsibility to help northern peoples – on lands at the time not ceded by treaty – in a moment of great need.[11] Northern peoples stayed away from the trade posts (where there were fewer prospects for subsistence than on the land), broke up into smaller groups, and shared what they had. Officials with the Department of Indian Affairs (DIA) saw themselves as benevolent and did not want to be tarred with the same brush that condemned British colonial officials for their role in the Great Famine that led to over 5 million deaths in India.[12] But the criteria that governed how much relief to provide was how much the DIA was willing to pay, not how much was needed to sustain life in a period of great hardship. The perception of the north as an intrinsically unhealthy place, rooted in intersecting discourses of climate, health, and “race” in the late nineteenth century, reinforced the notion that providing relief to northern peoples was an expense that needed to be contained. The experiences of the winter of 1888-89 resituate a well-known theme about historical struggles for subsistence in subarctic and arctic places within the context of colonialism. This episode appears in a larger book project examining the intersection of health and environmental change as part of the process of settler colonialism along the Mackenzie and Yukon rivers (today’s Yukon and Northwest Territories) between 1860 and 1940. To read more of the findings to date from this project, please see the following publications:
Acknowledgement I wish to gratefully acknowledge the Inuvialuit Cultural Centre, the Gwich’in Tribal Council Department of Cultural Heritage, and the Tr’ondëk Hwëch’in Heritage Department for granting access to unpublished interview transcripts with elders as part of the research for the larger project discussed here. [1] George Blondin, When the World Was New: Stories of the Sahtu Dene (Yellowknife: Outcrop, 1990), 40; Charles Arnold, Wendy Stephenson, Bob Simpson, and Zoe Ho, eds. Taimani: At That Time, 3rd ed. (Inuvialuit Regional Corporation, 2011), 18.
[2] Michael Aleksiuk, “The Seasonal Food Regime of Arctic Beavers,” Ecology 51, no. 2 (Mar. 1970): 267. [3] Post Report dated Fort Smith, August 30, 1888, B. 200 /e/17, Hudson’s Bay Company Archives. [4] J.S. Camsell to Joseph Wrigley, Fort Smith, Sept. 10, 1889, B. 200/b/39, vol. 3, HBCA. [5] J. Séguin to his sister, 18 février 1889, acc# 71.220, file 7346, Provincial Archives of Alberta. [6] Camsell to Wrigley, Sept. 10, 1889. [7] Richard Hardisty, Inspection Report Mackenzie River District, Summer 1889, B.200/e/18, HBCA. [8] Extract from the Commissioner’s Letter to the Secretary, 30 Sept. 1889, RG 10, Vol 3708, File 19,502, Parts, 1,2,3 Reel C-10124, Library and Archives Canada. [9] Camsell to Wrigley, Sept. 10, 1889. The number of deaths is tallied from Oblate, HBC, and government records. [10] Mary Black-Rogers, “Varieties of ‘Starving’: Semantics and Survival in the Subarctic Fur Trade, 1750-1850,” Ethnohistory, 33, no. 4 (1986): 353-383. [11] See correspondence in RG 10, Vol 3708, File 19,502, Parts, 1,2,3 Reel C-10124, Library and Archives Canada. [12] Mike Davis, Late Victorian Holocausts: El Niño Famines and the Making of the Third World (London: Verso, 2001). Fiona Williamson, Singapore Management University Heat is a ubiquitous part of tropical living. During the nineteenth century consumers and writers of travel literature, explorers and colonists became increasingly familiar with the endless, languid summers of tropical climates where continued, unrelenting heat and humidity created a daunting climate for the European. As botanist Frederick Burbidge wryly noted on his first arrival to Singapore town in 1877: On you go, and the stuffy little gharry, even if it has no windows, soon becomes hot as an oven, and the perspiration streams from every pore. By the time you reach the hotels the chances are your shirt and collar are in the state best known as "pulpy"; and if you are of a sanguine temperament, your face may be said to resemble "the rising sun".[1] For the early settlers of the Straits Settlements’ towns of Singapore, Georgetown and Malacca, managing heat meant – if you were wealthy enough – getting out of town to a hill station or coastal bungalow for long weekends, holidays or convalescence. On Singapore Island, a popular recreation spot was breezy Tanjong Katong, where Europeans would build beachside bungalows beside nearby native kampong (villages). Others noted how, if these options were not available, that ‘by resorting to the neighbourhood of the jungle a degree at least of reduction in the temperature may be secured’ and that ‘sea bathing is also a relief within easy reach’.[2] If you had to stay in town, then various methods were suggested to manage the hot days, including avoiding too much strenuous exercise, meat, strong drinks and cold water and eating cooling foods, such as salads.[3] For inhabitants of tropical regions, these methods of seeking solace from the heat were common-sense yet, from the early 1800s, it had been apparent that there was a scientific basis for the difference in urban and rural temperatures. In the English-speaking world, the first definitive text to explain this ‘urban heat island effect’ was Luke Howard in Climate of London, released in three volumes between 1818 and 1833.[4] In the Straits Settlements, then under British administration, a scientific discourse on how human activities might be impacting temperature had emerged shortly after. Heavily influenced by the contemporary ‘science’ of desiccation - known for connecting deforestation with greater atmospheric aridity - colonial officers had begun to explore how urban development was affecting the temperature. John Turnbull Thomson, for instance, engineer and surveyor, undertook a study of temperature readings made by military officers of the English East India Company during 1820-25 and 1841-45. Thomson noted how, in the space of these twenty-five years, the temperature of Singapore town and its surrounds had risen by 2.48F. If we ignore for a moment that this is only a very small increase (33f =1C) and that his datasets had limitations, we can look to the significance of his conclusion. Thomson had argued that ‘the cause of this advance of temperature is assigned to the country within 3 miles of the town being now clear of jungle and cultivated, which formerly was covered with primeval forest’.[5] The following year, James Richardson Logan, editor of the Journal of the Indian Archipelago and Eastern Asia, penned a damning narrative on the effects of forest clearances on Penang Island. ‘It is not necessary to cite Humboldt or Boussingalt’ he wrote ‘to prove the great influence in tropical regions of forests … in … diminishing local temperature’.[6] Making a connection with urbanisation more explicitly, John Crawfurd, doctor, amateur scientist and previously British Resident at Singapore, noted in 1855 that the urban and peri-urban temperature increase ‘is ascribable no doubt, to the increase of buildings, and to the country having been cleared of forests for several miles inland from town’.[7] These men joined a growing number of contemporaries in attributing an anthropogenic hand behind discernible climatic changes on the Malayan peninsula. Their concerns, as elsewhere in the colonies, grew from witnessing first-hand unchecked deforestation as plantation farming, mining and urbanisation had intensified. The discussion came to public attention in 1865, after a damning report was published by Alexander Maingay, surgeon, magistrate and amateur natural historian, then stationed at Malacca. Like Logan, Maingay claimed that ‘the ruin of the forest … involves a corresponding diminution of the rain fall and a general elevation of the temperature, with an increasing prevalence of long droughts’.[8] The report unleashed an outpouring of opinion in the press over the following months and an acceleration of the discussion in governmental circles. By the late 1870s, plans were afoot to survey the peninsula’s forests, with a specific intention to explore their connection to climatic changes.[9] A few years later, a colonial treasurer with a keen interest in all matters meteorological, Allan Skinner, had also explicitly linked a perceived rise in temperature and an increasing prevalence of droughts to ‘the spread of buildings’ as well as the loss of forest cover.[10] By the early 1900s, this discourse was firmly entrenched in the public, as well as the more scholarly, consciousness. In 1907, for instance, the press had reproduced a British lecture on the ‘effects of civilisation on climate’ which, echoing Howard’s claims almost a century earlier, noted ‘the presence of buildings … will raise the temperature of the locality, whilst the influence of the warmth arising from a large number of fires must not by any means be overlooked’.[11] Yet, despite this, by the 1930s, the colony was already on a downward spiral in managing urban heat. Reminiscing about how the central Raffles’ Place (now heart of Singapore’s CBD) had looked in 1901, Edwin Brown noted how it had transformed from an attractive, green spot shaded by ‘flame-of-the-forest trees’, where men would sit for their lunch and horses and carriages would shelter ‘while the “mems” did their shopping’, into a ‘glaring whiteness … with its motor cars parked in orderly ranks in the centre … and wonder if we are any better off now-with all the present day amenities - than we were then?[12] The thirties were notorious for a loss of urban greenery, impacting on temperatures and creating dusty, unbearably hot streets. This was also the same decade that air-conditioning was mass introduced into Malayan towns for domestic purposes. It was hailed as an invention that would not only provide comfort but better health. Singing the praises of the Trane Air-Conditioning System in 1936, for instance, a Morning Tribune staff writer noted how ‘Singapore may be a beauty spot and its strategic position superb, but its climatic conditions have always been a moot point with residents and medical men alike … the marvels of modern science and invention can transform the air condition of the interior of Singapore's buildings to the most delightful and healthiest obtaining anywhere’.[13] While it would still be decades before anyone except the rich could afford domestic air conditioning units, the introduction of air-conditioning marked a technological tipping point in an age of ‘progress’, one which, combined with the mass uptake of motorcars, significant expansion and a loss of urban green space was to usher the regions’ towns into the age of the Anthropocene. Funding source acknowledgement: Research for this feature was kindly supported by a Singapore Ministry of Education grant: MOE2018-T2-2-120 Heat in Urban Asia: Past, Present and Future. [1] Burbidge, Frederick W., The Gardens of the Sun: A Naturalist's Journal of Borneo and the Sulu Archipelago (1880), p. 15.
[2] John Cameron, Our Tropical Possessions in Malayan India &c (Smith Elder and Co, 1865), p. 158. [3] ‘Prickly Heat’, The Singapore Free Press and Mercantile Advertiser, 10 July 1889, p. 43; ‘The Prevention of Sunstroke’, The Singapore Free Press and Mercantile Advertiser, 18 July 1896, p. 2. [4] Howard, Luke, The Climate of London, 3 Vols. (1818, 1822, 1833). [5] Thomson, John T., General Report on the Residency of Singapore’, Journal of the Indian Archipelago and Eastern Asia, 3 (1847): 618-635, 627. [6] Logan, J. R., ‘The Probable Effects of the Climate of Pinang of the Continued Destruction of its Hill Jungles’, Journal of the Indian Archipelago and Eastern Asia, 2 (1848): 534-6, 534. [7] Quoted in Skinner, Allan M., ‘Straits Meteorology’, Journal of the Straits Branch of the Royal Asiatic Society, 11-12 (1883): 245-259, 253. [8] Maingay, A. C., ‘Report on the Timber and Forest Conservancy of Malacca, 20 August 1865’, published in the Straits Settlements Government Gazette 1 September 1865, pp. 387-8, 388. [9] CO276-10: Straits Settlements Government Gazette, Copy of Colonial Engineers Minute on Survey, dated 27 August 1878, published 3 October 1879, p. 893. [10] Skinner, ‘Straits Meteorology’, 252. [11] ‘Can man change climate?’, Eastern Daily Mail and Straits Morning Advertiser, 11 January 1907, p. 6. [12] Brown, Edwin A., Indiscreet Memories: 1901 Singapore through the eyes of a colonial Englishman (1935), reprinted (Monsoon Books, 2007), 42. [13] ‘Modern Air-Conditioning System’, Morning Tribune, 30 March 1936, p. 15. Matthew Hannaford, University of Lincoln Figure 1. Fort of Sofala (Mozambique) from Georg Braun and Franz Hogenberg's atlas Civitates orbis terrarum, vol. I, 1572. In their Companion to Global Environmental History, John McNeill and Erin Mauldin argue that "Consciously or unconsciously, scholars provide scholarship for the times in which they live.” Certainly, it would be hard to argue that environmental historical scholarship is written in ignorance of the “ecologically dynamic and globalizing times” in which we live. Yet begin to break this down and the picture becomes more complex. Take historical climatology, and pose the question: ‘to what extent can the field provide critical interrogations of the discourse on present-day and future climate change and adaptation?.’ The answer may not be so controversial, and arguments have been made by Mark Carey, Georgina Endfield and others that do precisely this. Push it a step further, though, and consider whether and how the field can inform climate adaptation policy and practice, then there is not necessarily a straightforward answer. In an article published in Global Environmental Change in 2018, George Adamson, Eleonora Rohland and I sought not only to address this question, but also to elaborate on the important contribution that historical climatology and history more broadly can, and, we argue, should make to climate change adaptation research. This post provides a summary of our argument, with links to my own work in southern Africa. If we start by looking at the first major objective of historical climatology (as defined by Christian Pfister, Rudolf Brázdil, et al.) – “to reconstruct weather and climate prior to the modern instrumental period” – the answer to both of the above questions would appear relatively clear-cut. Few would dispute that long-duration baselines of climate variability provide essential context to changes taking place over recent decades. Yet if we consider objectives two (“to investigate the vulnerability of past societies and economies to climate variations”) and three (“to explore past discourses and social representations of the climate”), the waters become muddied. Indeed, despite a resurgence in research on these latter two objectives over the last decade or so, there is little evidence of what we refer to as ‘mainstream climate change research’ (loosely defined as that included within IPCC WGII) adopting insights from historical climatology. That is to say, although much research in historical climatology has been informed by theoretical advances in climate change research, for example through concepts like vulnerability and resilience, there has arguably been little influence in the other direction. Instead, where historical climate-society interactions have been discussed within climate research, this has largely come from those without historical training. For example, temporal analogues of climate-society interactions have been utilised by social scientists and paleoclimatologists as a way to understand how human systems manage and experience climate risks, to identify successful and non-successful adaptations, and to understand the processes that shape vulnerability. However, these analyses have been open to criticisms of reductionism, through overplaying similarities and understating differences between past and present, as well as criticisms of determinism through their oversimplification of complex processes. Equally, Social-Ecological Systems (SES) analyses, driven by the IHOPE (Integrated History and Future of People on Earth) network, advocate the integration of historical data into systems models in order to identify ‘safe and just’ spaces for humanity to operate within. Yet SES has been criticised for focussing on the ecological, economic and technological dimensions of adaptation, and as a result downplaying human and political agency. Similar critiques exist for quantitative historical research on climate and conflict. It is all very well for historians to label these approaches as deterministic or reductionist, but what of historical approaches that counteract these criticisms? In the article, we argue for three interventions:
Each of these approaches is underpinned by a focus on the narrative side of history, based upon fine-grained analyses of extensive corpora of archival records, which brings into focus the role of individual and institutional agency, as well as the significance of uneven distributions of power in past adaptation processes, over long historical trajectories. What does this mean in practice? Let us take the example of institutional path dependency. Here, we are interested in the question of why institutional responses to climate-related extremes – recurrent in a particular place – may fail, and more generally why institutions act in a suboptimal manner, for example by blocking decisions that could be adaptive. Many present-focussed studies on barriers to adaptation simply point to factors like inadequate financial resources, overlooking the complex historical trajectories of institutions governing climate adaptation and their effects on the vulnerability of societies. On the contrary, path dependency theory argues that the policy and practice of institutions today can be driven by past decisions and historical ‘critical junctures’ – initial choice points that become locked-in and difficult to shift – and by memories of what were considered normal or successful responses in the past, regardless of their effects on vulnerability. The problem at the moment is that empirical information on the long-term evolution of institutions involved in climate adaptation governance is rather limited. This means that it is difficult to observe path dependence and change ‘in the making’, or more basically to map the extent to which contemporary adaptation is really informed by historical processes. This poses particular challenges in contexts with colonial histories, where many of today’s adaptation-related institutions were initially formed under colonial governance, and so reflected the inherent power imbalances within these societies at different points in time. In turn, legacies of these initial critical junctures may constrain the use of resources and perpetuate unequal social and economic outcomes through time. My own work in southern Africa has demonstrated this process during the pre- and early-colonial period from the 16th to 19th centuries. In the lower Zambezi valley, increased diversity of agricultural systems (amongst other factors) through the spread of wheat and maize was enough to reduce sensitivity to short-term droughts at the height of the dry 17th century. Yet local institutional factors, intricately bound up within the nature of Portuguese colonialism in southeast Africa (notably the prazo (estate) system of landownership, the growth of absentee landownership and the related growth of responses to stress that provided short-term gain over long-term stability), ultimately overrode reduced vulnerability derived from material factors. These slow-moving, endogenous factors combined with a period of severe and prolonged drought to produce the calamitous famine that raged on the lower Zambezi between 1824-1830. A short-term focus on the few years preceding this individual disaster could nevertheless paint an entirely different picture of its causes. Figure 2: The Portuguese settlement at Sofala in 1505 was a key critical juncture in the history of southeast Africa, paving the way for settlement up the Zambezi. This is Rigobert Bonne's c. 1770 map of southeastern Africa and Madagascar. Extending this long temporal trajectory further into the colonial period may yet reveal continuities as well as changes through to present adaptation challenges. Crucially, there is a point of interface here with the emergent notion of adaptation pathways, or ‘pathways of change and response’, within the climate change adaptation literature, which has recognised the importance of deep time perspectives. Testing the concept of path dependency in the context of climate adaptation today therefore appears to be a genuine opportunity for innovative research, and for developing a new interdisciplinary approach to researching climate change adaptation. Figure 3: The addition of winter wheat (right) to the long-standing summer season crop mix of sorghum (left) and pearl millet (middle) reduced sensitivity to less protracted droughts; however, more protracted droughts were met with institutional responses that provided short-term gain to Portuguese landowners at the expense of the long-term stability of the system. References:
Adamson, G.C., Hannaford, M.J. and Rohland, E.J., 2018. Re-thinking the present: The role of a historical focus in climate change adaptation research. Global Environmental Change, 48, 195-205. Brázdil, R., Dobrovolný, P., Luterbacher, J., Moberg, A., Pfister, C., Wheeler, D. and Zorita, E., 2010. European climate of the past 500 years: new challenges for historical climatology. Climatic Change, 101(1-2), 7-40. Carey, M., 2012. Climate and history: a critical review of historical climatology and climate change historiography. Wiley Interdisciplinary Reviews: Climate Change, 3(3), 233-249. Degroot, D., 2018. Climate change and conflict. In The Palgrave Handbook of Climate History (pp. 367-385). London: Palgrave Macmillan. Endfield, G.H., 2014. Exploring particularity: vulnerability, resilience, and memory in climate change discourses. Environmental History, 303-310. Hannaford, M.J., 2018. Long-term drivers of vulnerability and resilience to drought in the Zambezi-Save area of southern Africa, 1505–1830. Global and Planetary Change, 166, 94-106. McNeill, J.R., Mauldin, E.S. 2012. A Companion to Global Environmental History. London: Wiley. xxi. Pfister, C., 2010. The vulnerability of past societies to climatic variation: a new focus for historical climatology in the twenty-first century. Climatic change, 100(1), 25-31. Wise, R.M., Fazey, I., Smith, M.S., Park, S.E., Eakin, H.C., Van Garderen, E.A. and Campbell, B., 2014. Reconceptualising adaptation to climate change as part of pathways of change and response. Global Environmental Change, 28, 325-336. Eva Jobbová, Arlene Crampsie, Conor Murphy, Francis Ludlow, Robert McLeman, Csaba Horvath 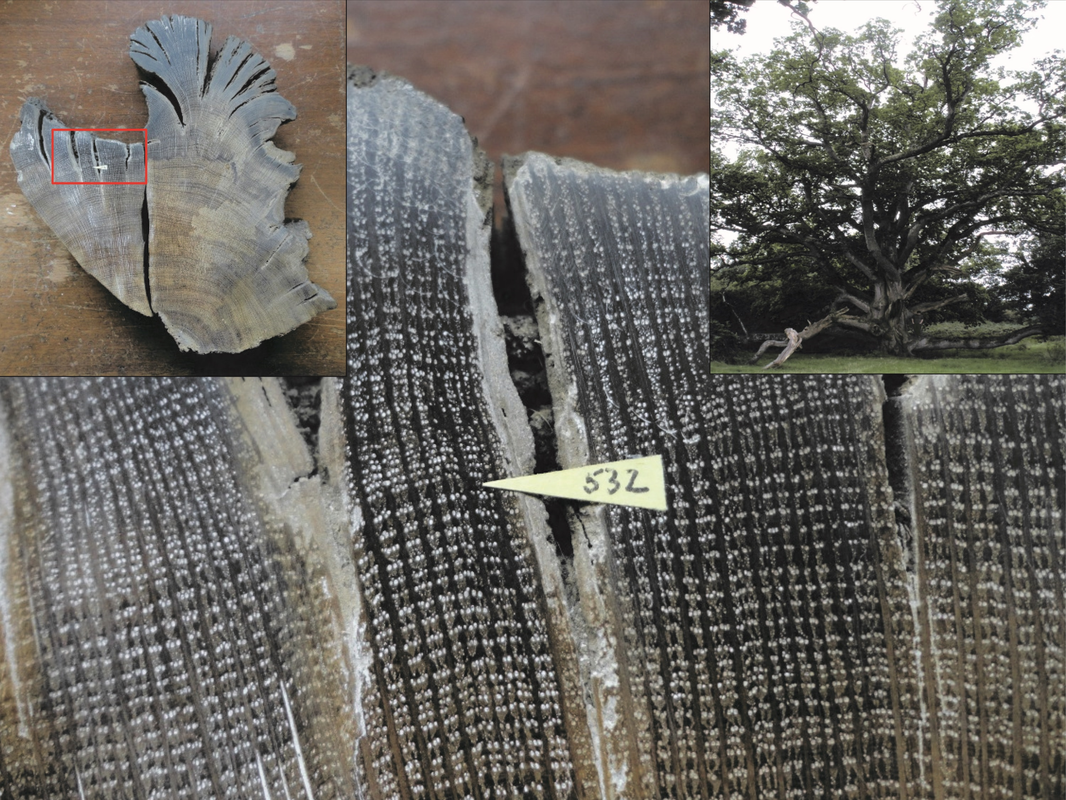 Oak sample from Deer Park townland, Antrim, Northern Ireland, with rings spanning the well-known climatic downturn, c.536-550. The year 532 is marked, after which the rings become noticeably narrower. The real anomaly however begins in 536 and runs into the 540s. This oak sample can be seen in full in the top left inset, while the top right depicts a mature contemporary oak, the “King’s Oak”, on the Charleville Estate, Co. Offaly, Ireland. We thank David Brown for permission to photograph this sample. Before the summer of 2018, had you asked an Irish person to describe a drought, you might well have received a bemused response that rain and floods are a more common problem in this part of the world. But on July 5th that summer, the Irish Times declared that: The vast majority of the country officially enters a state of 'absolute drought' today with no rainfall recorded at 24 out of 25 weather stations during the last two weeks. The extreme weather conditions have prompted Irish Water to expand a hosepipe ban from the Greater Dublin Area to the whole country from Friday morning. The summer of 2018 left memories of low river levels, brown fields, unusually warm and sunny weather, cash-strapped farmers, and the infamous ‘hosepipe ban’ when authorities encouraged people to report on any neighbours who dared water their gardens with a hose. Was 2018 an anomaly, or a taste of things to come in a changing climate? Were droughts common in Ireland’s past, and have they simply been forgotten? If so, what can we learn about their impacts, and can such knowledge help us be more prepared in the future? These are some of the questions that our Irish Research Council funded project, Irish Droughts: Environmental and Cultural Memories of a Neglected Hazard, attempts to answer. [1] By combining new oral histories with existing climatic records, tree-ring data, historical documents and folklore, we aim to reconstruct Ireland’s drought history, and examine their severity, geographical extent and impacts from the medieval period to the present. “Drought-free” Ireland: simply a myth? The perception of Ireland as a soggy “drought-free” island is based at least partly on the anomalous lack of severe droughts over much of the last thirty years. But longer-term rainfall records, reconstructions from natural archives, and historical documents all indicate that multi-year periods with limited precipitation have occurred repeatedly in Ireland over the past two millennia, particularly in eastern to southeastern regions. [2] Many cultures have observed and kept records of the weather, especially the extreme events that had adverse impacts on their livelihoods, stood out from the “ordinary”, or held some special significance for understanding the natural world and the place of humans within it. The Irish were no exception, and their tradition of keeping yearly chronicles dating back to at least the sixth century, known collectively as the Irish Annals, involved frequent reporting of weather. [3] These sources thus allow researchers to identify the frequency and severity of droughts, and how people attempted to mitigate the impacts. For example, a thousand years ago it was recorded that: Much inclement weather happened in the land of Ireland, which carried away corn, milk, fruit, and fish, from the people, so that there grew up dishonesty among all, that no protection was extended to church or fortress, gossipred or mutual oath, until the clergy and laity of Munster assembled, with their chieftains, under Donnchadh… the son of the King of Ireland, at Cill-Dalua [i.e. Killaloe, County Clare], where they enacted a law and a restraint upon every injustice, from small to great. God gave peace and favourable weather in consequence of this law. Annals of the Four Masters, 1050 CE. [4] Weather recording was not the sole purpose of Irish annalists, of course, and so their documentation of extreme weather events, though remarkable for its chronological span, is for this and other reasons incomplete. It is also sometimes coloured by the ways in which such events were perceived, or how they could be interpreted for religious or political motives, as suggested by the case of 1050 above. [5] One way to fill the gaps and supplement written descriptions is with data from natural archives. Most prominently for Ireland, the oak tree-ring records compiled by Mike Baillie, David Brown and others at Queen’s University Belfast, reveal annual growing-season conditions for the past seven millennia for much of Ireland. [6] Years of unusually low growth, registering through especially narrow rings, can identify periods of extreme drought, some of which coincide with written accounts in the Irish Annals of major societal stress such as famine and mass human and animal mortality. This is true for the year 1050, with the oaks firmly indicating severe drought, while the written description is ambiguous as to the exact weather conditions involved. [7] Our cover image shows a sample of medieval Irish oak preserved for over 1500 years in acidic Ulster bog waters. Regular annual growth rings are clearly visible here, running “horizontally” up to the labelled year 532, shortly after which the tree began to grow poorly, and particularly so in the 540s. These narrow rings likely reflect poor growing conditions associated with a global climatic anomaly that began in 536 and continued until c.550, most likely caused by multiple, closely occurring volcanic eruptions (dated c.536, c.540 and c.547), and linked to famines and mortality in written sources from Ireland to China. [8] This event, usually described in terms of its temperature impacts, likely also impacted rainfall, as indicated here by the reduced growth of the precipitation-sensitive oaks, consistent with our evolving understanding of the hydroclimatic impacts of explosive eruptions more generally. [9] That the Irish oaks tend more generally to register the latter volcanic eruption in c.540 but not clearly the first major event in c.536, highlights the complexity of region- and species-specific tree growth responses, and the benefit of complementing such evidence with documentary data. [10] Drought in the recent past While sources such as the Irish Annals and Irish oaks provide the majority of our evidence for drought occurring on annual and inter-annual time-scales before the Early Modern Period, our knowledge of Irish weather, climate and environment is transformed during the 1700s with an exponential increase in the number of surviving archival sources, many of which were specifically created to report weather conditions (such as weather diaries), along with the addition of the instrumental records. Precipitation observations from 1711 taken in Derry by Dr. Thomas Neve are amongst the earliest in northwest Europe. Dr. Neve’s diary is also one of the earliest surviving weather diaries to include instrumental data on air pressure, temperature, and rainfall, and provides written observations of snow, frost, hail, thunder, and other general comments on weather. [11] By combining these sort of weather records, it is possible to reconstruct statistically representative continuous rainfall series from which droughts can be identified.These include island-wide, multi-year droughts during the periods 1854–1860, 1884–1896, 1904–1912, 1921–1923, 1932–1935, 1952–1954 and 1969–1977. [12] The droughts identified in this way can then be compared with other documentary sources, including newspapers and journals, to generate information on their socio-economic impacts, as well as innovative practices that communities employed to cope with and adapt to drought conditions. Ireland is fortunate in having some of the longest running newspapers in the world, some going back to the early eighteenth century, providing a rich (and often colourful – see Figure 2) source of information about the human impacts of past droughts. [13] Left: Poem describing the drought of 1806 and its impacts on flora, fauna, agriculture and water. Belfast Newsletter, 28 June 1806. Right: Guinness Press advertisement during the April 1985 Irish drought. Guinness Archive Online Collection. https://guinnessarchives.adlibsoft.com/Details/archive/110017212. Drought memories – or “we are not quite as skeptical” The light-hearted 1985 Guinness ad shown right in Figure 2 suggests that Irish people in their fifties and older are likely to have direct personal experiences and recollections of notable droughts. A key component of the Irish Droughts project is to seek out people with strong memories and systematically record their recollections of how droughts from the 1950s onward unfolded, the physical, social and economic impacts they had, and how people adjusted. In this way, our statistical and observational data are made more tangible by accounts of the real-life consequences for individuals, families and communities. This last aspect is especially important, given our goal of not only identifying past drought events in Ireland, but also gaining transferable lessons for the future. Learning for the future The nearly three decades of drought-free conditions that led to drought becoming a practically forgotten hazard in Ireland came to a crashing end in 2018. During that relatively wet period, there was little physical stimulus to prompt governments, institutions and communities to better prepare for the shifts in seasonal temperature regimes, precipitation patterns, and drought frequencies and/or severities that will likely accompany future climate change. To generate additional insights on how to build resilience to future droughts, we will look abroad to southwestern Ontario, Canada, and draw upon watershed management and drought mitigation strategies already in place there. That region’s relatively modest climate, mixed urban-agricultural land use system, established source water protection legislation, and institutional experience in managing both floods and droughts make it a useful analog for Ireland. “Rainfall warning?” The drought of summer 2018, although relatively short-lived in some areas by comparison to historical droughts, revealed the considerable vulnerabilities that exist in Ireland in the water, livestock, tillage, horticulture, and tourism sectors. Furthermore, the lack of institutional preparedness for future droughts is evidenced by the fact that the Irish national emergency management system currently has no means of categorizing drought warnings, with the 2018 event being classified simply as a rainfall warning. Through our research, we seek to enhance Irish understanding of drought risks, inform policy and practice, and ensure that rural Ireland is sufficiently prepared to deal with future climate change and its impacts on water supplies, agriculture, and the well-being of society. [1] www.ucd.ie/droughtmemories; https://twitter.com/droughtmemories
[2] Kiely, G., Leahy, P., Ludlow, F., Stefanini, B., Reilly, E., Monk, M. and Harris, J. (201) Extreme weather, climate and natural disasters in Ireland. Johnstown Castle: Environmental Protection Agency. [3] Ludlow, F., Stine, A. R., Leahy, P., Murphy, E., Mayewski, P., Taylor, D., Killen, J., Baillie, M., Hennessy, M. and Kiely, G. (2013) “Medieval Irish Chronicles Reveal Persistent Volcanic Forcing of Severe Winter Cold Events, 431-1649 CE”, Environmental Research Letters, 8 (2), L024035, doi:10.1088/1748-9326/8/2/024035. [4] https://celt.ucc.ie/published/T100005B/text015.html [5] Baker, L., Brock, S., Cortesi, L., Eren, A., Hebdon, C., Ludlow, F., Stoike, J. and Dove, M. (2017) “Mainstreaming Morality: An Examination of Moral Ecologies as a Form of Resistance”, Journal for the Study of Religion, Nature, and Culture, 11 (1), 23-55. doi.org/10.1558/jsrnc.27506; see also Ludlow, F. and Travis, C. (2018) “STEAM Approaches to Climate Change, Extreme Weather and Social-Political Conflict”, In: de la Garza, A. & Travis, T. (eds.), The STEAM Revolution: Transdisciplinary Approaches to Science, Technology, Engineering, Arts, Humanities and Mathematics. New York: Springer, 33-65. [6] Pilcher, J. R., Baillie, M. G. L., Schmidt, B. and Becker, B. (1984) “A 7,272-year tree-ring chronology for Western Europe”, Nature, 312, 150-152. [7] Cook, E. R., Seager, R., Kushnir, Y. et al. (2015) “Old World megadroughts and pluvials during the Common Era”, Science Advances 1(10) (2015), e1500561, doi:10.1126/sciadv.1500561. [8] Sigl, M., Winstrup, M., McConnell, J.R., Welten, K.C., Plunkett, G., Ludlow, F., Büntgen, U., Caffee, M., Chellman, N., Dahl-Jensen, D., Fischer, H., Kipfstuhl, S., Kostick, C., Maselli, O.J., Mekhaldi, F., Mulvaney, R., Muscheler, R., Pasteri, D.R., Pilcher, J.R., Salzer, M., Schüpbach, S., Steffensen, J.P., Vinther, B., Woodruff, T.E. (2015) “Timing and Climate Forcing of Volcanic Eruptions during the Past 2,500 Years”, Nature, 523, pp.543–549. [9] Rao, M. P. et al. (2017) “European and Mediterranean hydroclimate responses to tropical volcanic forcing over the last millennium,” Geophysical Research Letters, 44, 55894. [10] Human and natural archives have their own biases, sensitivities, strengths and weaknesses and must each be “read” with these in mind. Where the Irish oaks are not especially forthcoming about the climatic impacts of the great 536 eruption, the sample in Figure 1 being an exception, the Irish Annals suggest its severity for Ireland in reporting the “failure of bread” for 538 (when applying the essential chronological corrections of McCarthy. D. (2008) The Irish Annals: Their Genesis, Evolution and History. Dublin: Four Courts Press), despite their vestigial character at this early date. The landmark 2015 tree-ring-based reconstruction of the Palmer Drought Severity Index for the Common Era is also tested for accuracy against historically documented periods of extreme wet and drought (Cook, E. R. et al. (2015) “Old World megadroughts and pluvials”). [11] Murphy, C., et al. (2018) “A 305-year continuous monthly rainfall series for the island of Ireland (1711-2016)”, Climate of the Past, 14(3), 413-440. [12] Noone, S., Broderick, C., Duffy, C., Matthews, T., Wilby, R.L. and Murphy, C. (2017) “A 250‐year drought catalogue for the island of Ireland (1765–2015)”, International Journal of Climatology, 37, 239-254. [13] Murphy, C. et al. (2017) “Irish droughts in newspaper archives: Rediscovering forgotten hazards?” Weather, 72(6), 151-155. Laura Eerkes-Medrano, University of Victoria This past winter I was fortunate to join the Arctia Otso icebreaker in the Gulf of Bothnia, Finland, from March 2 to March 24, 2017. I had sailed the Northwest Passage aboard the Canadian Coast Guard ships Sir Wilfrid Laurier and Louis S. St-Laurent in 2015. Going to Finland to travel on an icebreaker for 20 days was my next big step as a Canadian scientist. My goals were to observe how changing ice and weather conditions affect marine shipping operations, and to learn more about the human element in terms of how the crew use instruments and information to make decisions. I also hoped to learn what additional weather and sea-ice information, and in what format, would be useful for improving weather and sea-ice forecasting, ultimately contributing to safer shipping activities. A common challenge when preparing to join an icebreaker in Canada is to determine the exact date the ship will arrive in port. Difficult ice and weather conditions can prevent the ship from arriving at the specified date. In the Gulf of Bothnia, since distances are shorter than they are in Canada, icebreakers generally will arrive at port on the predetermined date, but changes in weather and ice conditions may affect the operational area for a ship, meaning it may go to a different port for fuel replenishment and crew changes. As I was flying from the west coast of Canada to Finland in winter, I had to allow a couple of days on either side of the Otso’s planned arrival in case the port location changed or my plane was delayed by weather. Once on board the Otso, the first thing I learned was that, with less sea ice, paradoxically, there is more work for icebreakers. In the past, ice would form in the Bay of Bothnia in October or November. Although a declining sea ice average has been observed in recent years, the trend is not linear. Mild winters were also observed in the 70s and 80s. With less sea ice cover, new thin ice is constantly forming. This ice is broken up by winds, and because the thin ice floes are very mobile, fractures in the ice cover (leads) and pressure ridges, resulting from the interaction of ice floes colliding with each other, are constantly forming, depending on how the wind blows. More ridge formation means that there are more vessels getting stuck in these ridges and requiring assistance. 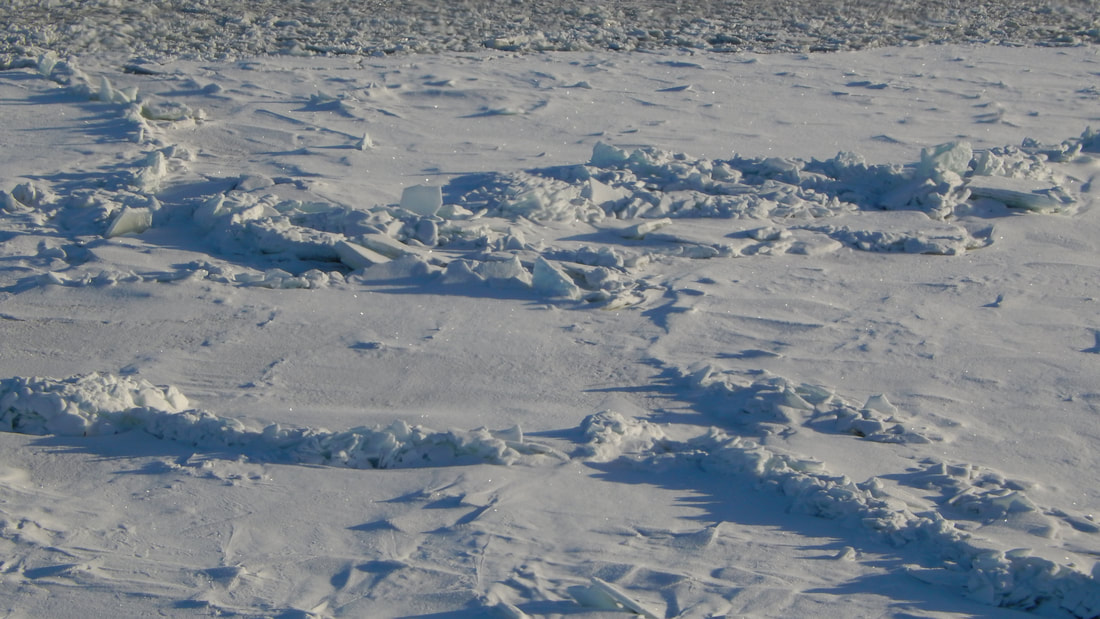 In recent years, the pattern of ice formation has changed, and new thin ice is constantly forming. Pressure ridges, resulting from the interaction of ice floes colliding with each other, are constantly forming, depending on how the wind blows. More ridge formation means that there are more vessels getting stuck in these ridges and requiring assistance. (Photo credit: LEM. March 2017, Gulf of Bothnia) During this past winter (2016–2017), the sea ice in the Bay of Bothnia, the northernmost part of the gulf, was particularly problematic. The warm temperatures of early winter meant ice formation did not start until early January. This late ice formation gave the south and southwest winds of the January storms a longer fetch. These winds pushed the shuga—lumps of new spongy ice a few centimeters across that tend to form in rough seas—and slush ice to the northern part of the bay, where they piled up, forming a shuga-belt. This belt was several kilometers wide and a few meters deep. The stickiness and the thickness of this shuga-belt caused problems for shipping. Each vessel needed about five to six hours of icebreaker assistance to cross the belt. This contrasts with a more typical winter, where crossing the shuga that forms at the ice edge usually takes about an hour. Weather, wind in particular, is an important element in the icebreaker business. On March 2, the day I arrived, traffic in the northern Gulf of Bothnia was completely dependent on icebreaker assistance to reach the ports of Tornio, Kemi and Oulu. The tracks opened by the icebreakers would not stay open for long due to the strong winds from the south. At the same time, there was not much ice to break in Kokkola, since all the ice had been pushed to the north. Visibility is another factor when assisting a vessel. In foggy conditions it is often hard to determine exactly how close the moving vessel is, even with the use of radar. Luckily the crew on the Otso are highly skilled in ice navigation in all weather and ice conditions. They were able to make very good decisions about what approach to take—either breaking the ice or offering a tow—when assisting a vessel. In the past, forming a convoy was the preferred option for assisting vessels in this environment. This is now less frequently a choice. The vessel tracks do not remain open because the wind, gaining strength over the long fetch of open water, pushes the ice floes against the shore ice, forming ridges and compressed areas, making navigation difficult. Vessels waiting for icebreaker assistance also face an additional threat that can add a time pressure on operations. In the past, a beset vessel would simply remain in the ice while waiting for an icebreaker. Now, under conditions of thinner, more mobile ice, there is a greater danger of a beset vessel drifting towards shallow areas. To ensure safety drifting vessels are given higher priority, which often means assisting them one at a time instead of using the convoy approach. The icebreaker’s response to vessels in need of assistance depends on the circumstances. Every situation is different, and various factors need to be considered when making the decision, including the type of event, the beset vessel’s ice class, the training and experience of its crew, how the crew on the assisted vessel are maneuvering and how they are using radars and instruments. It also depends on the instruments and information available to the icebreaker crew, and the accuracy of that information. Depending on the wind speed, the icebreaker crew could decide to assist a vessel. However, if the wind is blowing at 25 m/s or more, the icebreaker will not move; it is unsafe to assist vessels under these conditions due to the possibility of ice drifting and ridging, and the chance the track opened by the icebreaker will not remain open long enough to assist the vessel.
The main criteria in the decision to respond is safety and the timeliness of delivering assistance. Other factors that Arctia icebreakers consider are fuel consumption, the number of vessels an icebreaker will be able to assist per trip, and the efficiency of icebreaker operations. The Otso’s crew always strive to find ways to do things better while maintaining quality and remaining competitive. This was a great learning experience and an example of the industry-academia partnerships supported by Tom Ekegren, senior vice president at Arctia Icebreaking Ltd., and the Marine Environmental Observation Prediction and Response Network (MEOPAR). This project was funded by MEOPAR, a Canadian Centre of Excellence. Captain Duke Snider at MartechPolar has been a key supporter of this project and facilitated this opportunity with Arctia Ltd. |
Archives
August 2021
Categories |

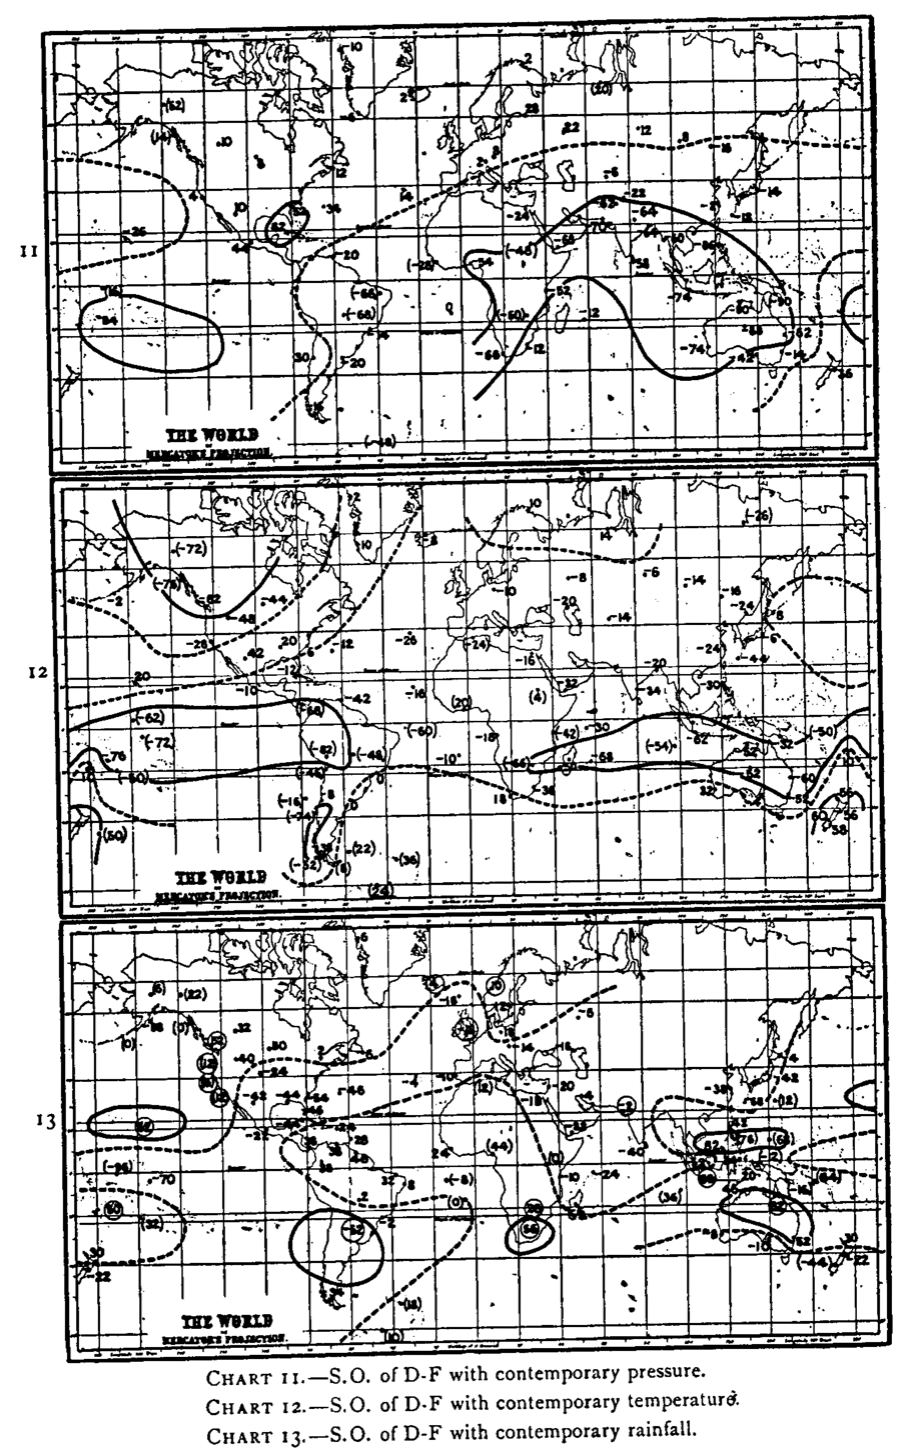
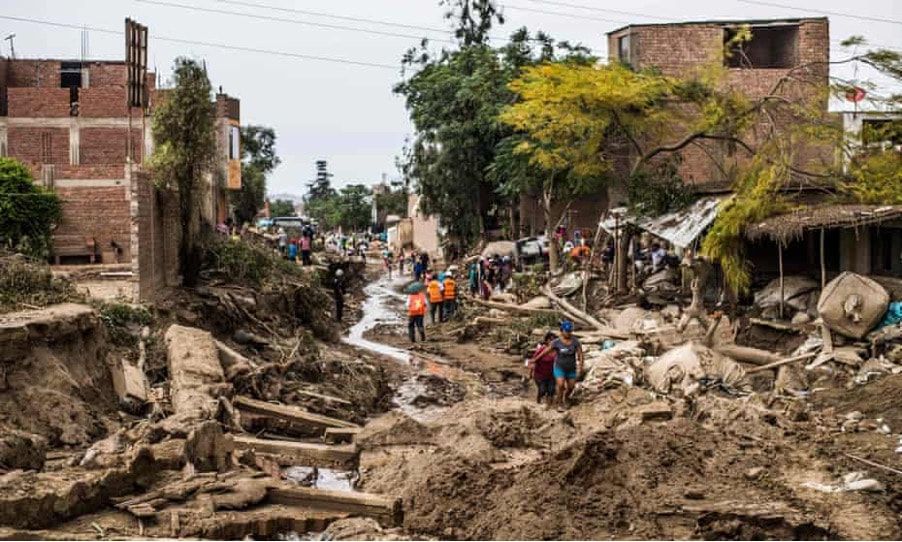
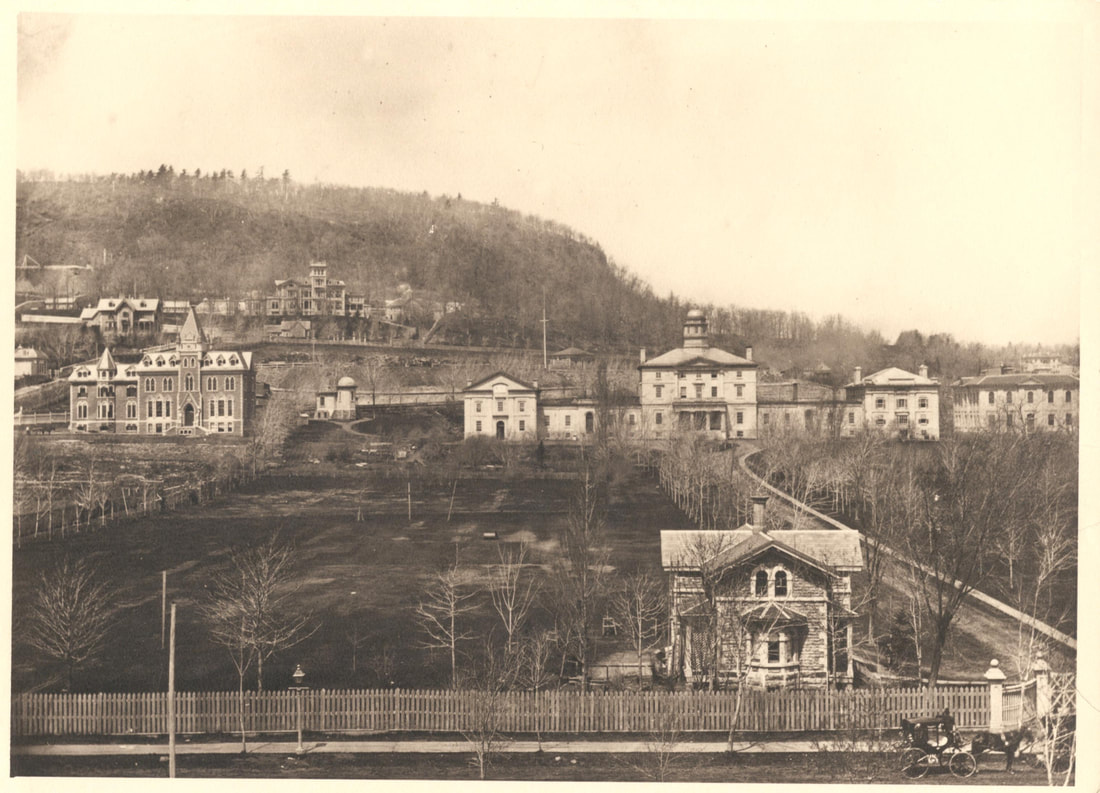
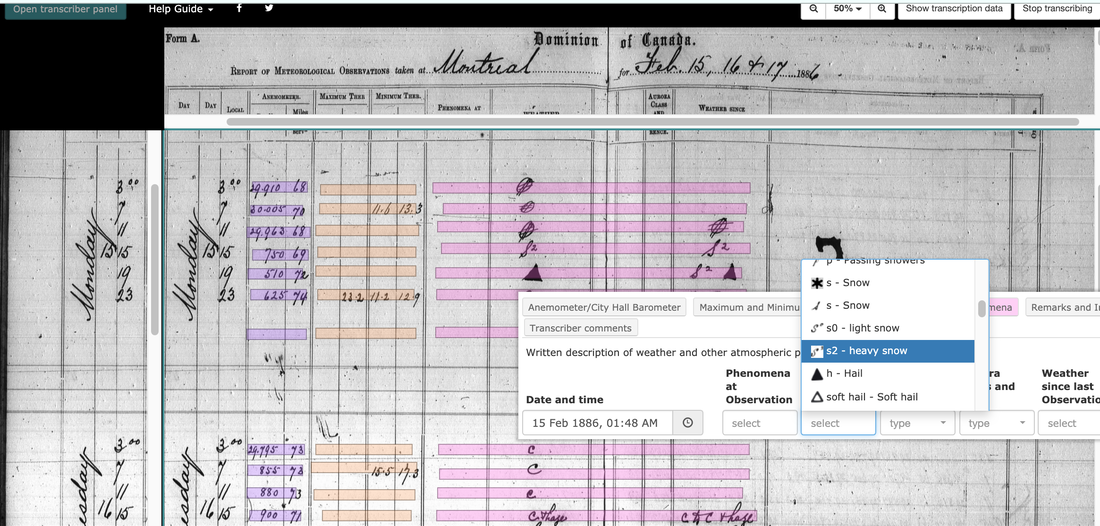

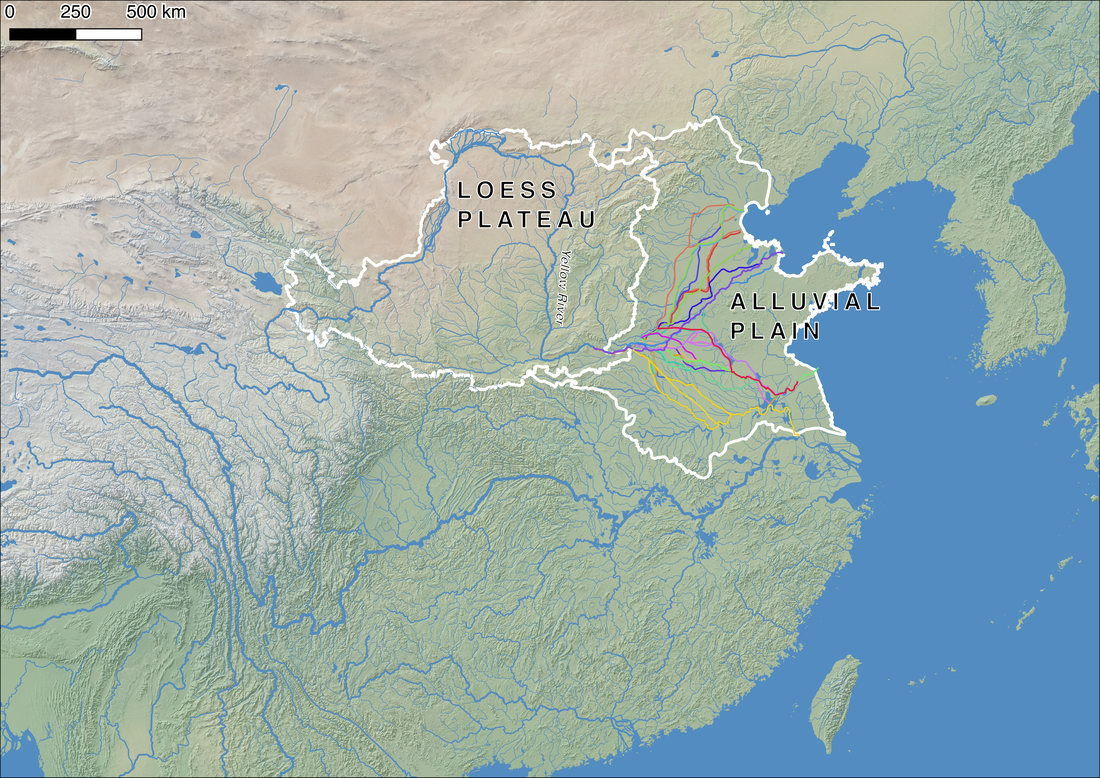
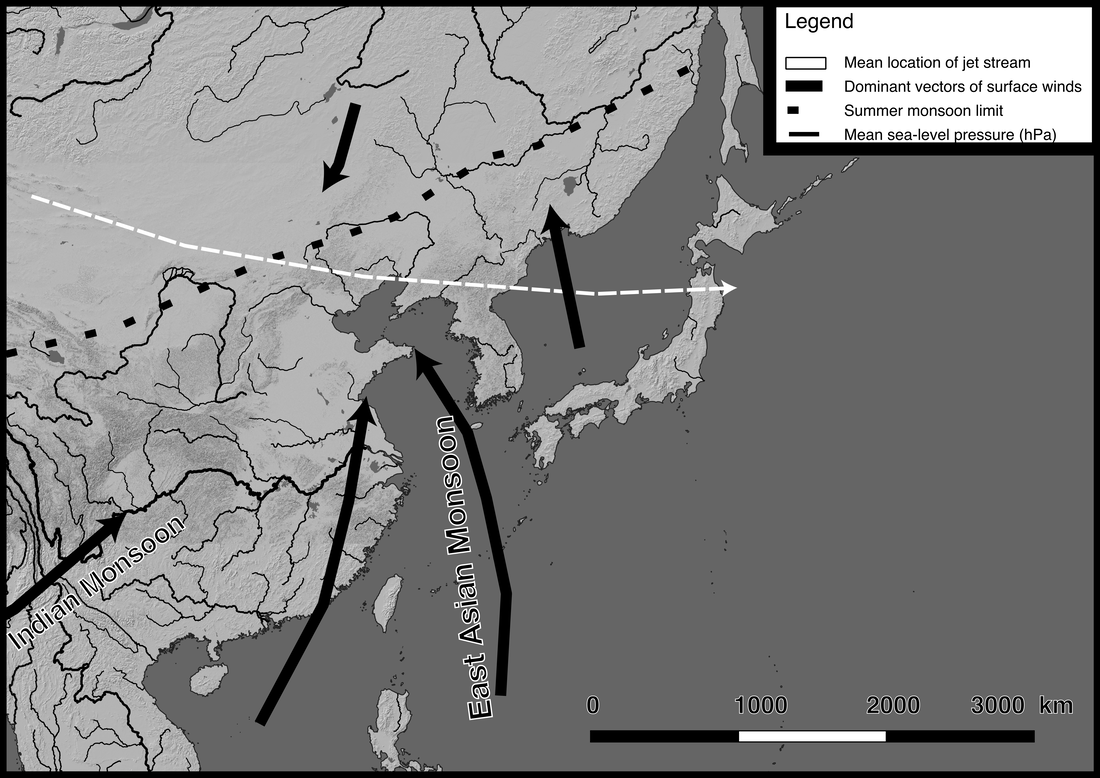
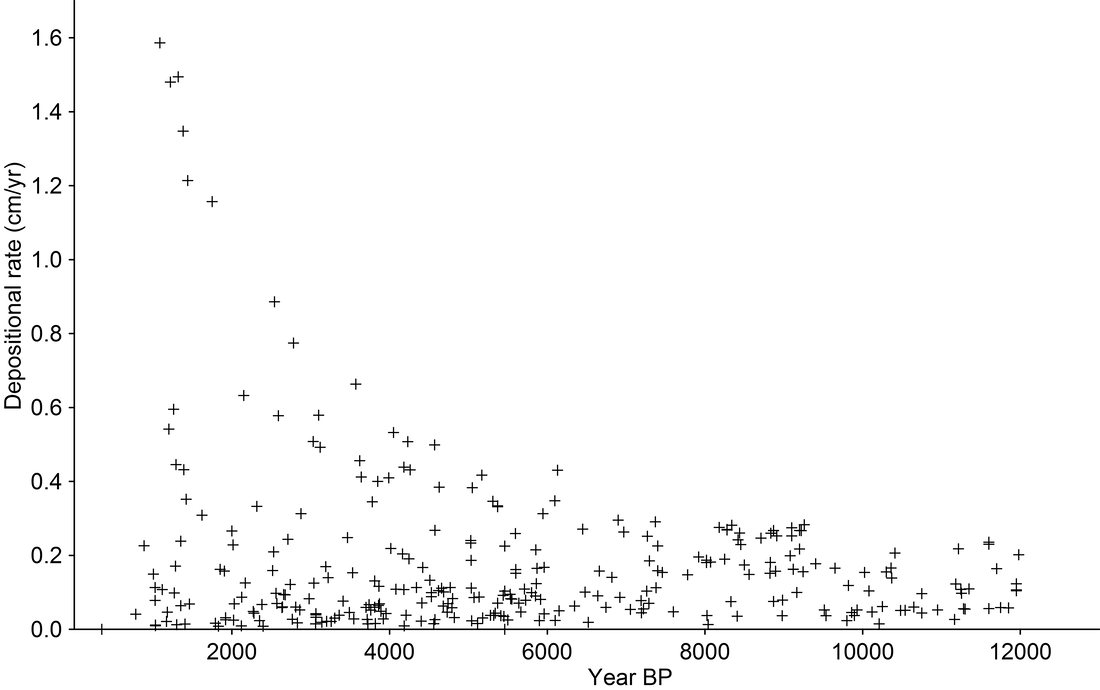
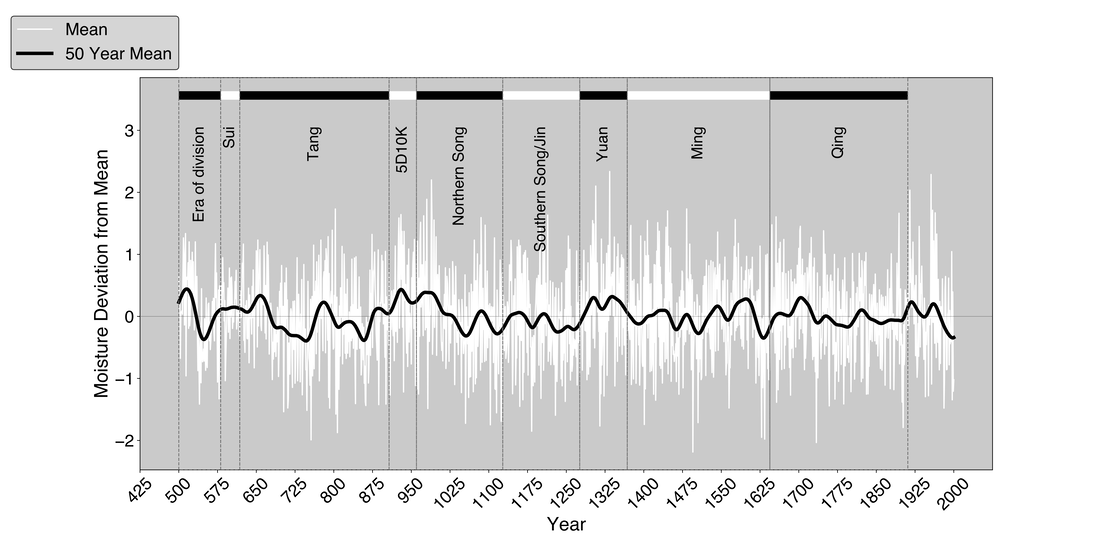
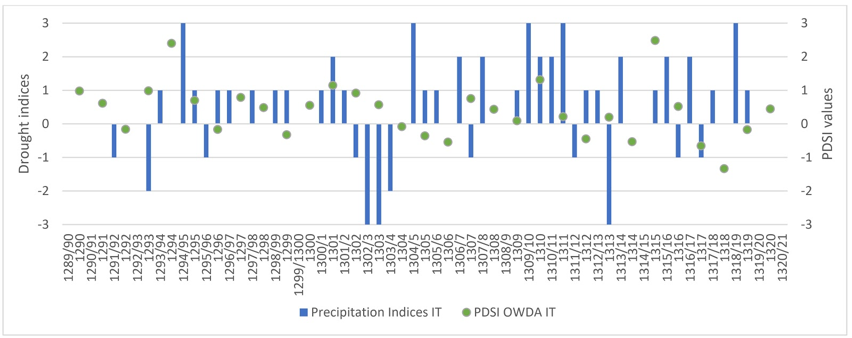
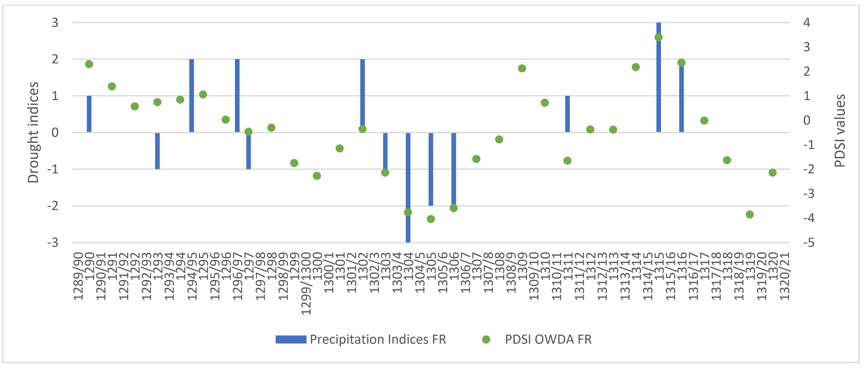
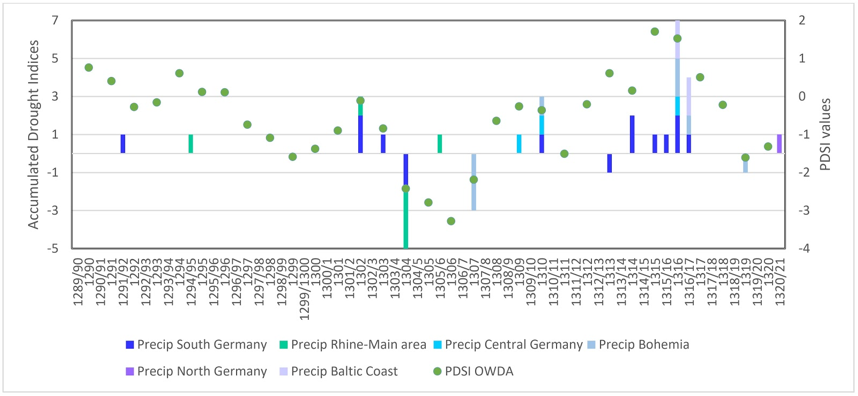
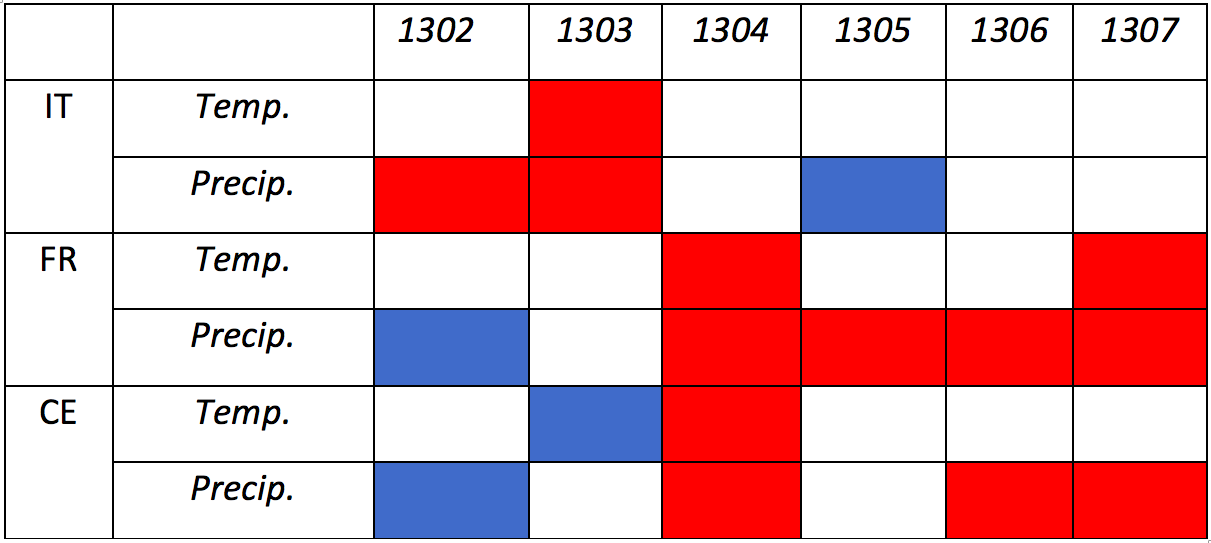
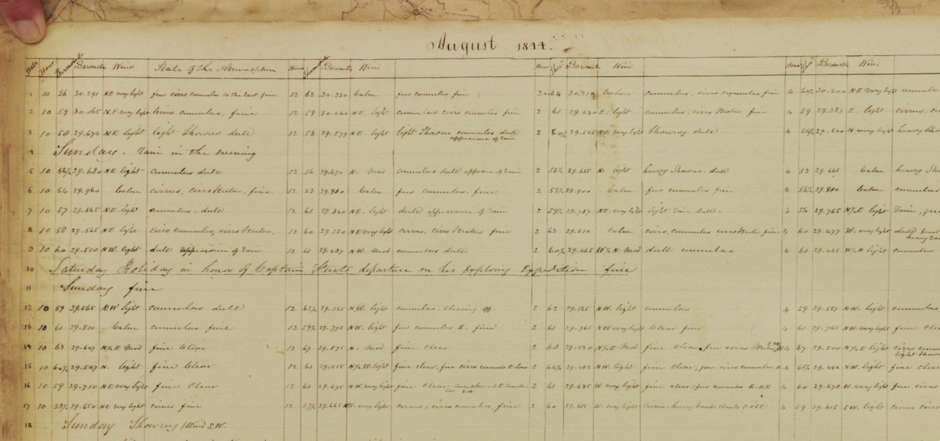
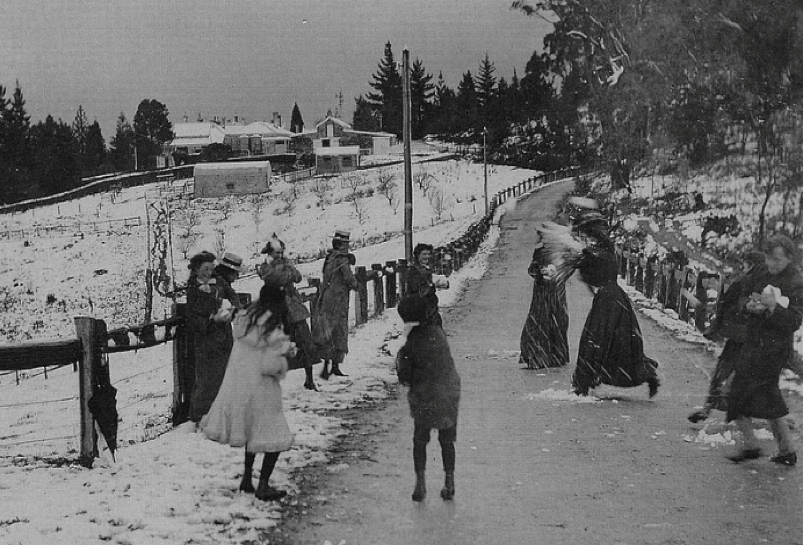
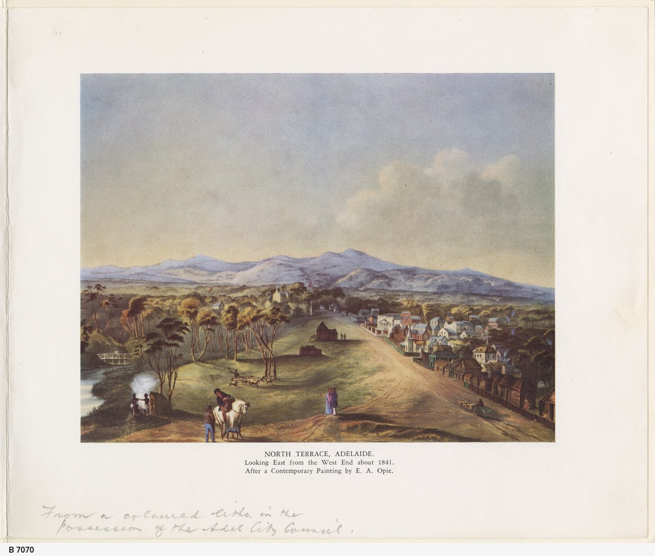
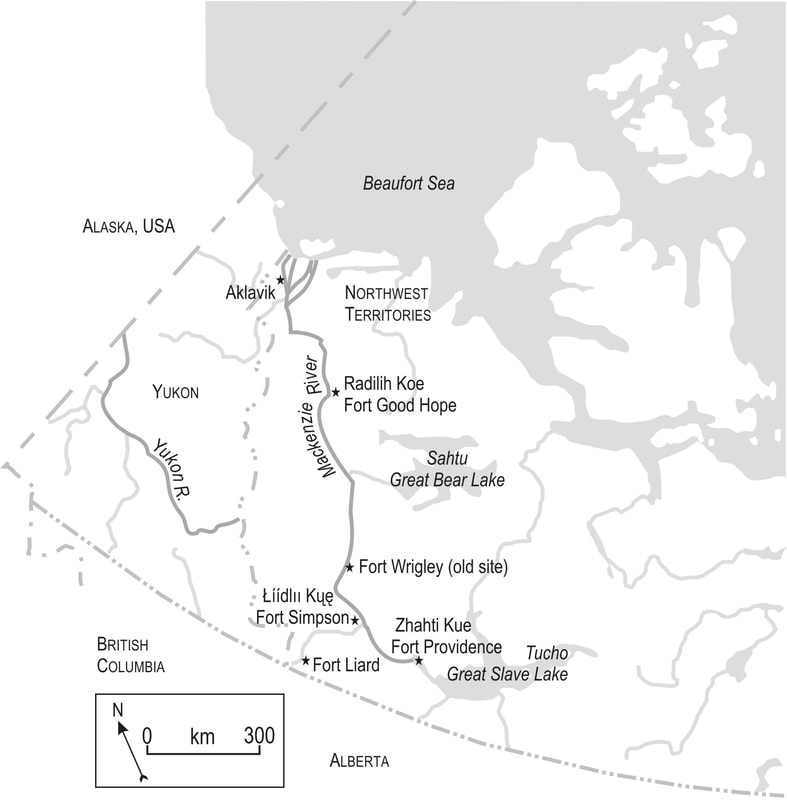
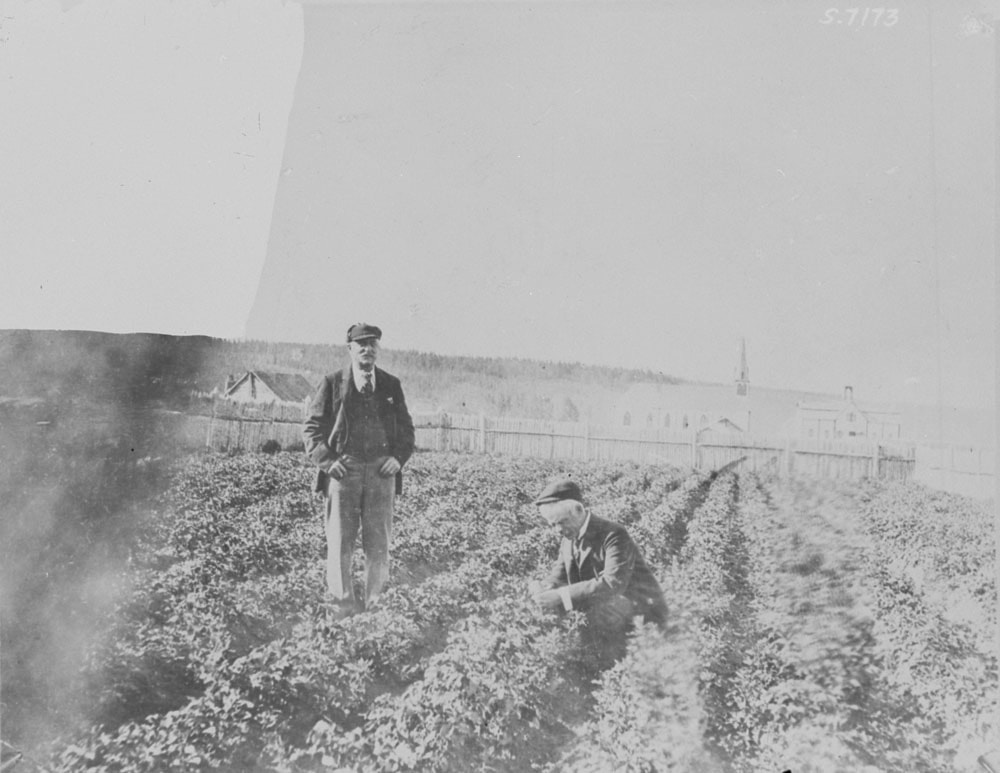
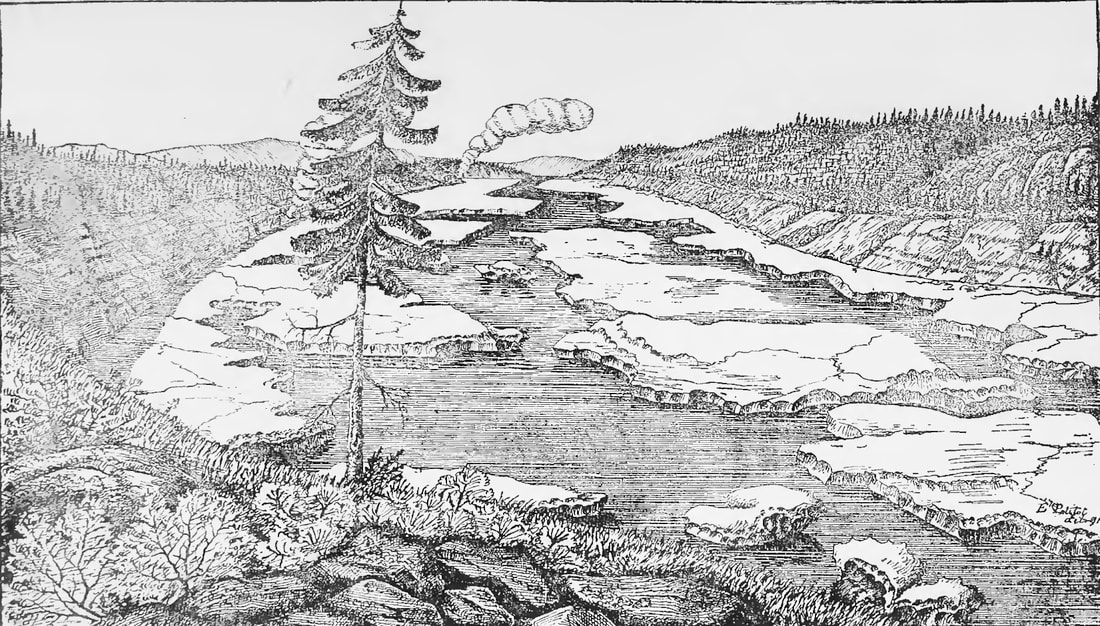
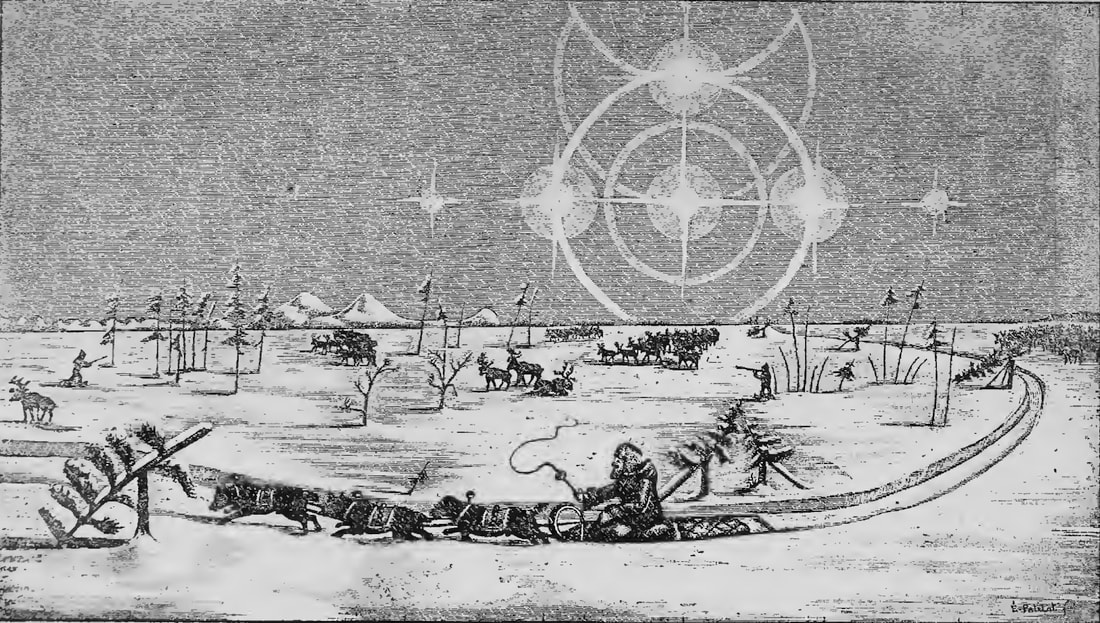
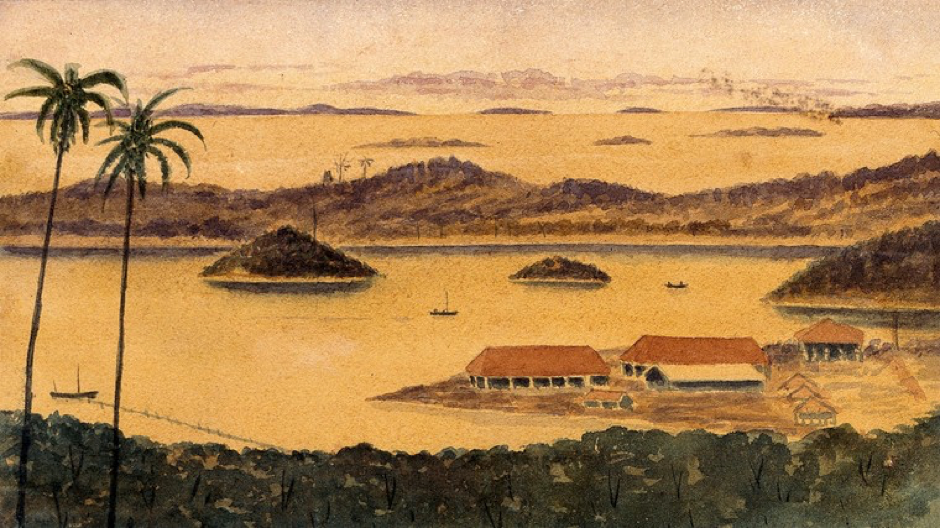
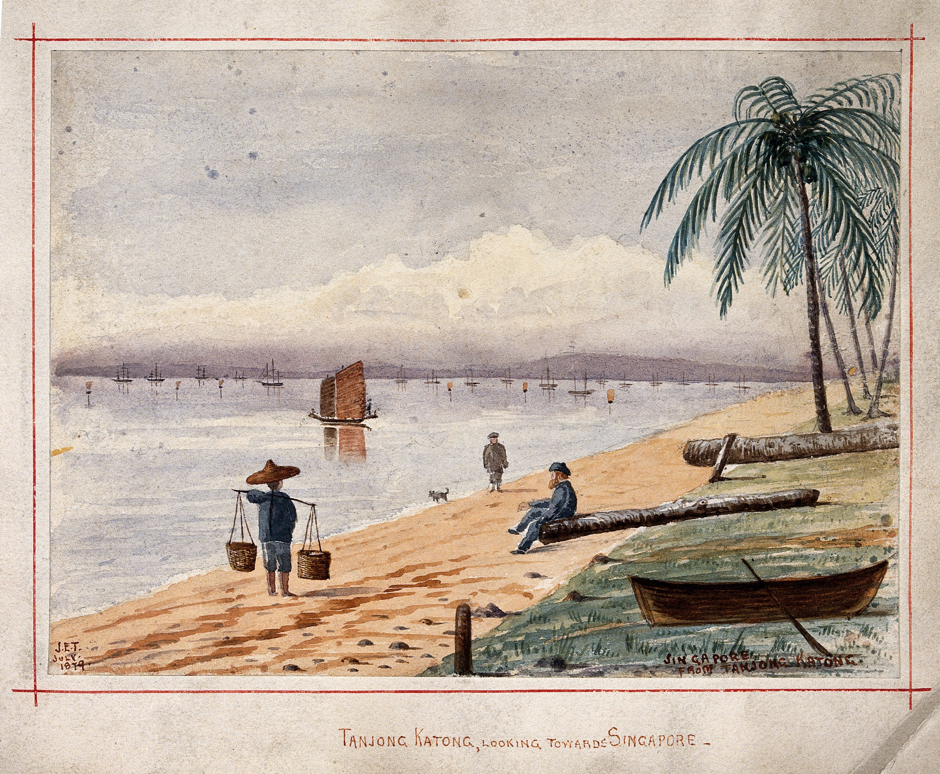
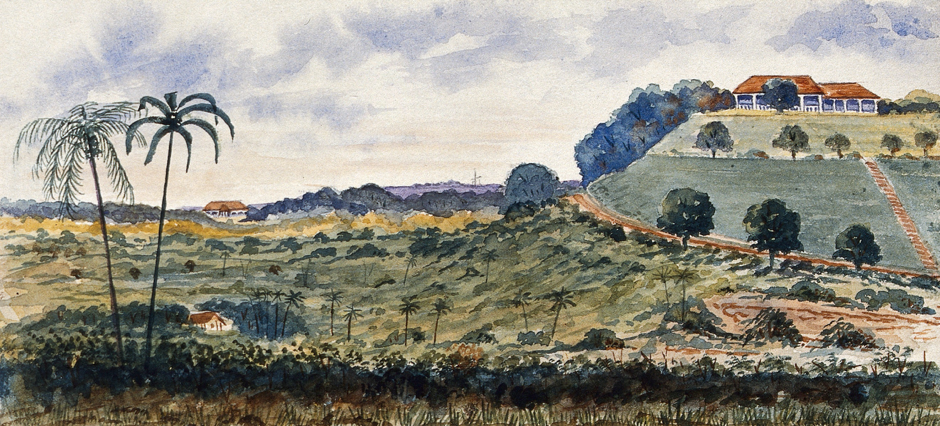
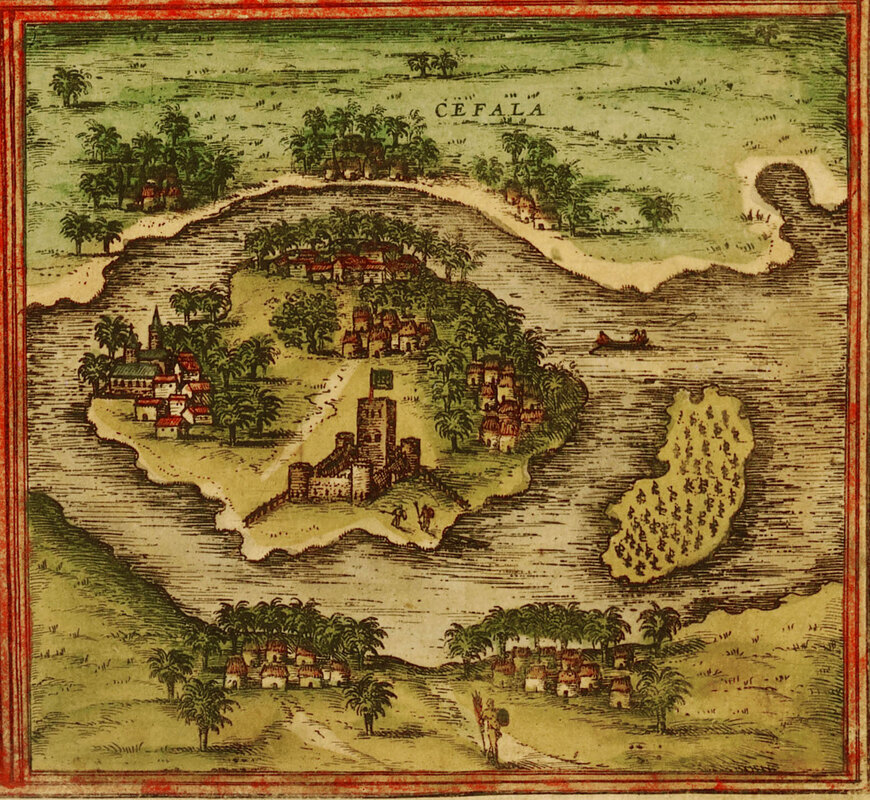
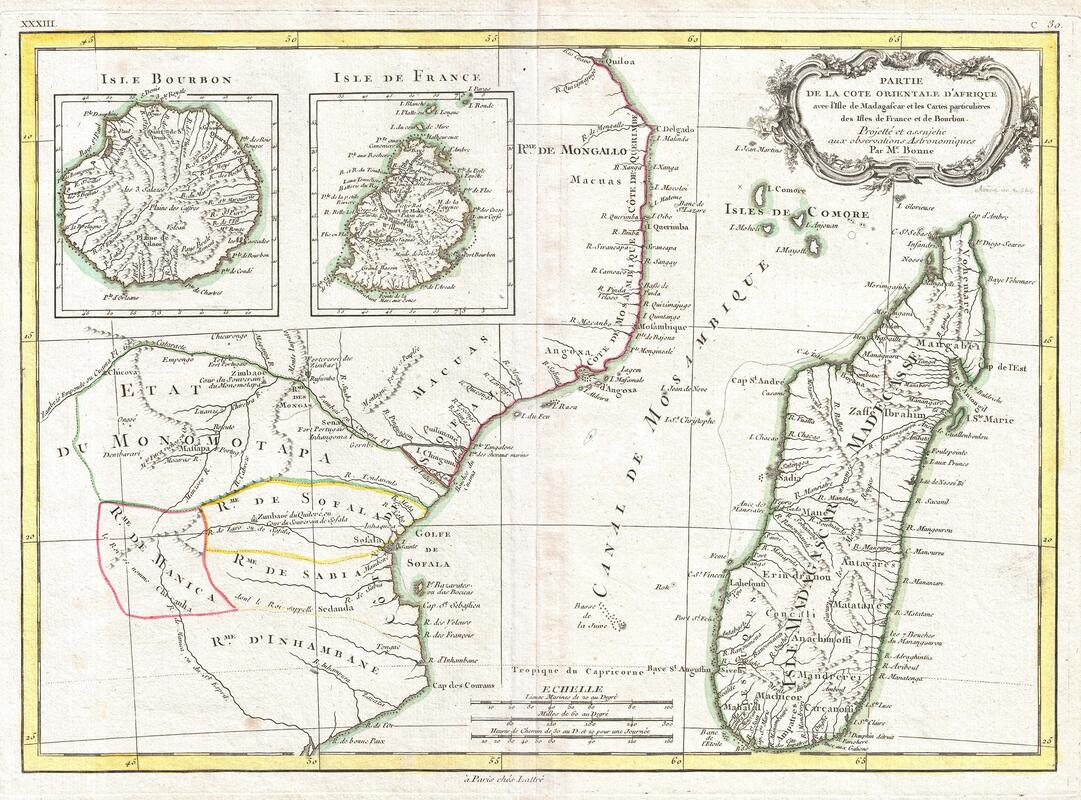
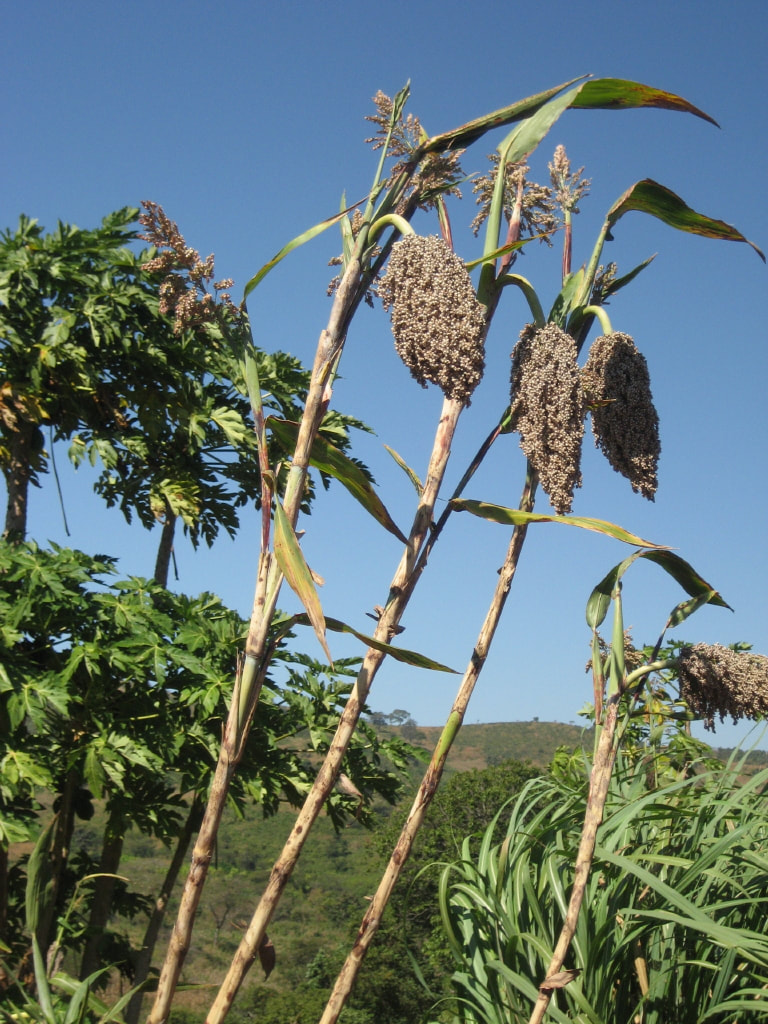
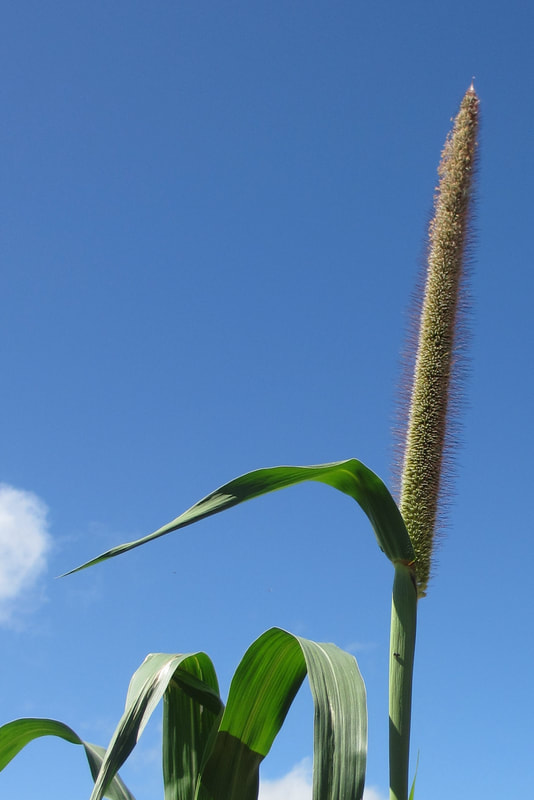
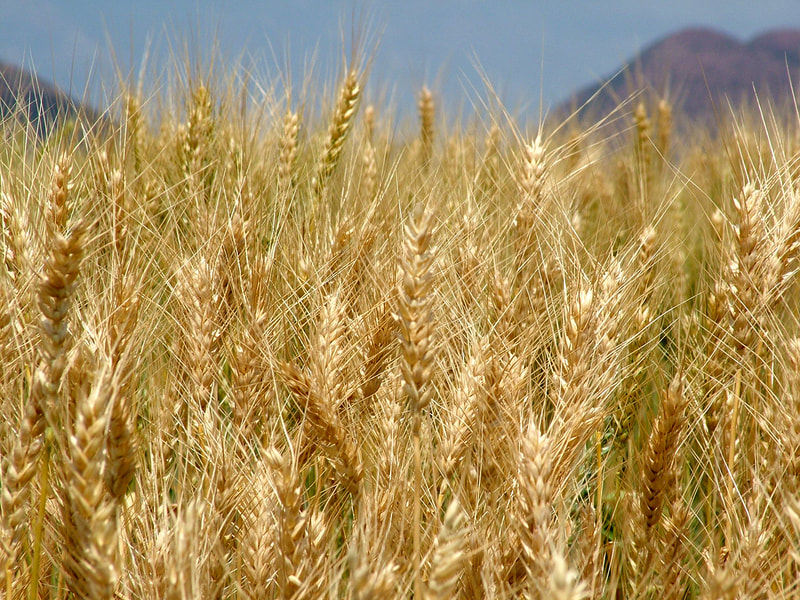
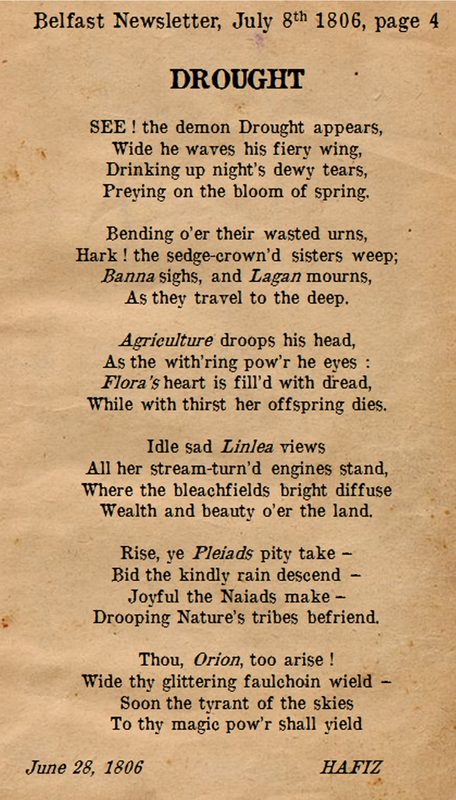

 RSS Feed