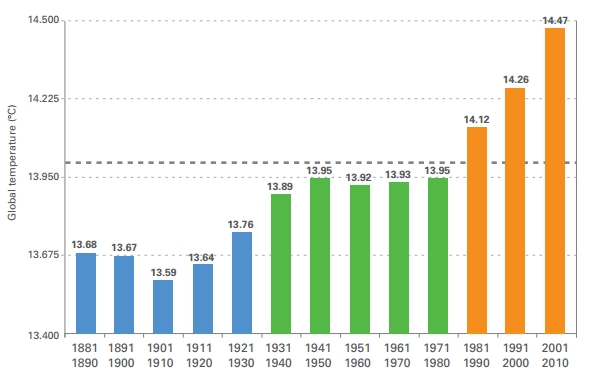
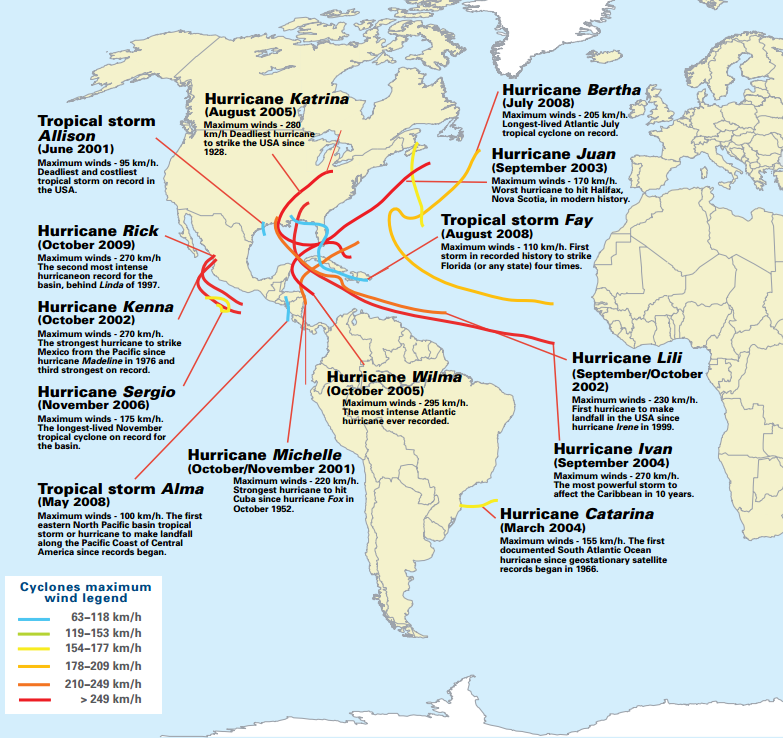
 Last year the World Meteorological Organization released an important summary report on the world’s climate and how we make sense of it. The World’s Climate: 2001-2010 was unfortunately overshadowed by the publication of the Fifth Summary for Policymakers written by the UN’s Intergovernmental Panel on Climate Change. However, its conclusions are continuing to trickle through blogs and media outlets, as they shed new light on the past, present, and future of the world’s climate. Some of these conclusions will be familiar to scientists, but they are worth repeating for scholars of different disciplines, policymakers, and the general public. Among them: 1. There is no “pause” in global warming. According to the science summarized by the WMO, the decade between 2001 and 2010 was the warmest since the beginning of reliable instrumental measurements (ca. 1850). Average global temperatures in that decade were 0.47° C higher than they were between 1961 and 1990, and 0.88° C higher than they were from 1901 to 1910. Between 2001 and 2010, nine years were among the ten warmest ever recorded. The last year of the decade, 2010, was also the hottest ever recorded, and nowhere was heating more pronounced than in Greenland. Indeed warming was particularly severe across the entire northern hemisphere, especially on land, which was 0.79° C hotter than the 1961-90 average. 2. The world is continuing to warm despite variability in natural climatic trends. From 2001 to 2010, the world did not experience a major El Niño event, a natural warming of the equatorial Pacific Ocean that raises global temperatures. Instead, strong La Niña events marked by a natural cooling of the same waters prevailed in 2008 and even 2010. Weak La Niña events, or neutral conditions, accompanied most other years. Meanwhile, the North Atlantic Oscillation and the Arctic Oscillation, linked regions of high atmospheric pressure, switched into their “negative” phase in 2009-10. This chilled winter temperatures across northern and central Europe. However, the steady increase of atmospheric greenhouse gases in this decade overwhelmed the cooling influence of natural climatic signals. Carbon Dioxide, which has now risen by 39% since preindustrial times, increased to 380 parts per million (ppm), from 361.5 ppm in the previous decade. Methane, which has risen by a whopping 158% since the preindustrial era, rose from 1,758 to 1,790 parts per billion (ppb). The wholesale transformation of the world’s atmosphere is well underway, and it is changing weather now. Speaking of which: 3. Linking climate change to extreme weather is difficult, but the evidence is overwhelming. Historical climatologists struggle with this all the time: how can we link a local weather event that transpires over hours, or days, to a gradual climatic trend? Even when supercomputers are involved, there are no easy answers. Instead, we must rely on probability, and when we do we discover that the evidence can be very persuasive. The same holds true in our study of the present and the future. According to the WMO, 56 countries reported their highest absolute daily maximum temperature record from 1961 to 2010 in the most recent decade. Only 14 countries reported their absolute daily minimum temperature in that period. Dramatic heat waves, like the one in the summer of 2010 that contributed to 55,000 deaths in Russia, were very likely triggered or worsened by the influence of anthropogenic climate change. Moreover, warm air can hold more moisture, and higher temperatures can speed up the hydrological cycle. Therefore climate change has probably contributed to the higher frequency, and increased severity, of extreme precipitation events. Globally the first decade of the twenty-first century was also among the wettest on record, and 2010 was the wettest year ever recorded. In the decade floods were the extreme weather-related event that was most frequently experienced around the world. Scientists also found that 2001-10 was accompanied by the most tropical cyclones ever recorded in the North Atlantic Basin. The 1981-2010 long-term average of 12 named storms per year was exceeded by three storms. In 2005 there were no fewer than 27 storms – a record – of which seven were classified as major hurricanes (including hurricane Katrina). However, the average or below-average cyclonic activity in other regions reveals that we must be cautious when linking major storms to a hotter climate. The great human and infrastructural damage inflicted by storms can as often reflect intensified human activity as the effect of climate change.
Ultimately: The WMO study is the latest major report that employs research into past climates to demonstrate the scale of global warming and undermine the “pause” hypothesis. It goes without saying that dramatic action is needed soon, but it should also be noted that further study of the past can contribute to that action. The better we understand our plight, the better we can confront it. Source: The Global Climate 2001-2010, A Decade of Climate Extremes – Summary Report. Geneva: World Meteorological Organization, 2013.
1 Comment
|
Relevant Links:World Meteorological Organization Homepage.
WMO Press Release No. 976. WMO Provisional Statement on Status of Climate in 2013. WMO's State of the Climate Report: Experts Respond. |


